| Param | Original file | Final file |
|---|---|---|
| Filename | modeM0/AS1A07_062T01_9000003392_22969cztM0_level2.evt | modeM0/AS1A07_062T01_9000003392_22969cztM0_level2_quad_clean.evt |
| Size (bytes) | 438,586,560 | 95,385,600 |
| Size | 418.3 MB | 91.0 MB |
| Events in quadrant A | 3,038,219 | 627,006 |
| Events in quadrant B | 3,140,849 | 641,916 |
| Events in quadrant C | 3,211,242 | 600,539 |
| Events in quadrant D | 3,470,064 | 585,448 |
| Mode M9 | |||
|---|---|---|---|
| Quadrant | BADHDUFLAG | Total packets | Discarded packets |
| A | 0 | 15 | 0 |
| B | 0 | 16 | 0 |
| C | 0 | 16 | 0 |
| D | 0 | 16 | 0 |
| Mode SS | |||
|---|---|---|---|
| Quadrant | BADHDUFLAG | Total packets | Discarded packets |
| A | 0 | 128 | 0 |
| B | 0 | 128 | 0 |
| C | 0 | 128 | 0 |
| D | 0 | 128 | 0 |
| Mode M0 | |||
|---|---|---|---|
| Quadrant | BADHDUFLAG | Total packets | Discarded packets |
| A | 0 | 13029 | 2 |
| B | 0 | 13244 | 2 |
| C | 0 | 13466 | 2 |
| D | 0 | 14493 | 3 |
| Quadrant | Total seconds | Saturated seconds | Saturation percentage |
|---|---|---|---|
| A | 6207 | 14 | 0.225552% |
| B | 6207 | 37 | 0.596101% |
| C | 6207 | 112 | 1.804414% |
| D | 6206 | 97 | 1.563004% |
Noise dominated data is calculated using 1-second bins in cleaned event files. If a bin has >2000 counts, and if more than 50% of those come from <1% of pixels, then it is considered to be noise-dominated and hence unusable.
| Quadrant | # 1 sec bins | Bins with >0 counts | Bins with >2000 counts | High rate bins dominated by noise | Noise dominated (total time) | Noise dominated (detector-on time) | Marked lightcurve |
|---|---|---|---|---|---|---|---|
| A | 7447 | 6208 | 0 | 0 | 0.00% | 0.00% | 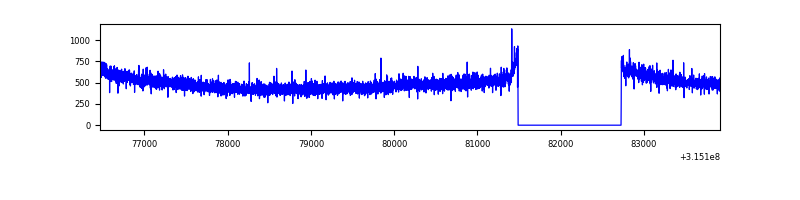 |
| B | 7447 | 6208 | 2 | 2 | 0.03% | 0.03% | 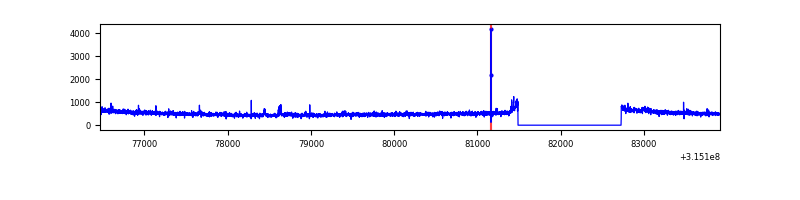 |
| C | 7447 | 6208 | 29 | 29 | 0.39% | 0.47% | 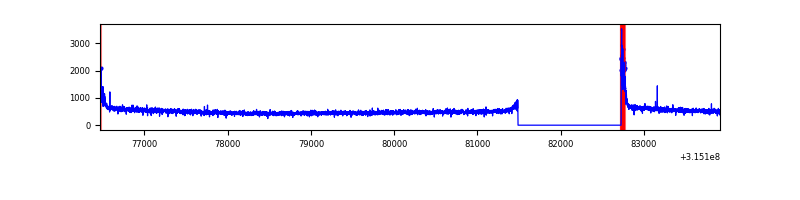 |
| D | 7446 | 6207 | 55 | 55 | 0.74% | 0.89% |  |
Top three noisy pixels from each quadrant. If the there are fewer than three noisy pixels in the level2.evt file, extra rows are filled as -1
| Pixel properties | Quadrant properties | ||||||
|---|---|---|---|---|---|---|---|
| Quadrant | DetID | PixID | Counts | Sigma | Mean | Median | Sigma |
| A | 13 | 170 | 13545 | 81.73 | 781 | 764 | 156.4 |
| A | 6 | 16 | 11756 | 70.29 | 781 | 764 | 156.4 |
| A | 13 | 254 | 10913 | 64.9 | 781 | 764 | 156.4 |
| B | 12 | 111 | 17608 | 115.18 | 786 | 767 | 146.2 |
| B | 0 | 245 | 16911 | 110.41 | 786 | 767 | 146.2 |
| B | 0 | 183 | 15768 | 102.59 | 786 | 767 | 146.2 |
| C | 0 | 10 | 133395 | 757.52 | 755 | 761 | 175.1 |
| C | 14 | 238 | 119404 | 677.61 | 755 | 761 | 175.1 |
| C | 0 | 239 | 9174 | 48.05 | 755 | 761 | 175.1 |
| D | 1 | 52 | 373219 | 2016.64 | 761 | 739 | 184.7 |
| D | 13 | 153 | 82985 | 445.29 | 761 | 739 | 184.7 |
| D | 9 | 85 | 42778 | 227.6 | 761 | 739 | 184.7 |
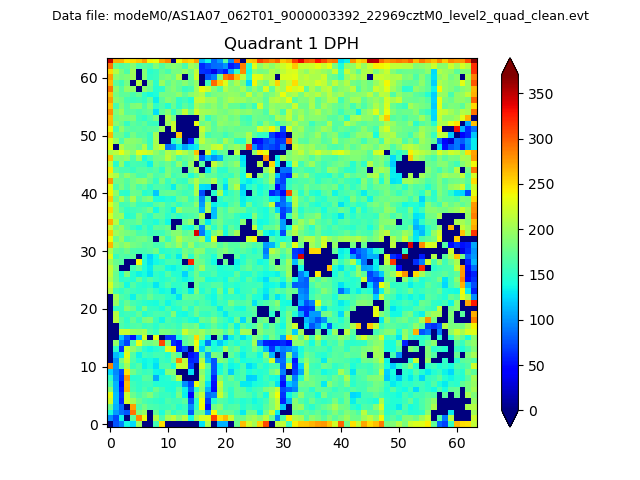
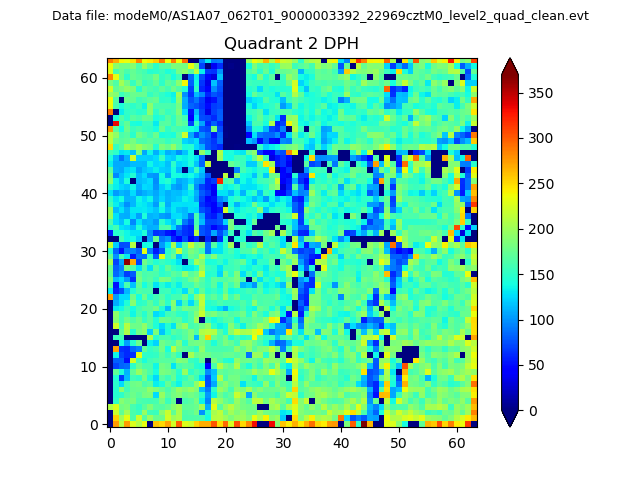
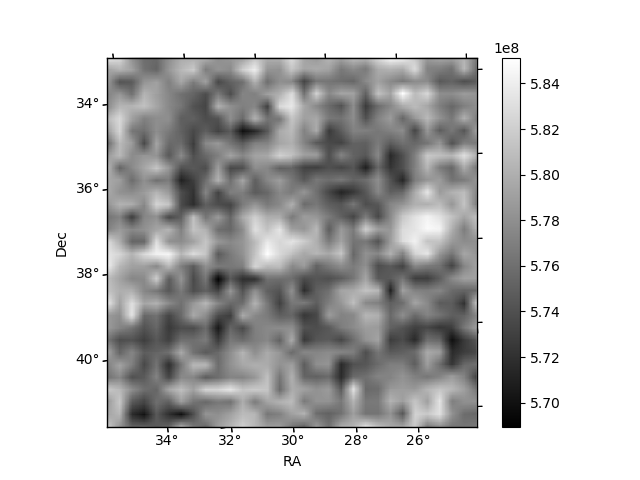
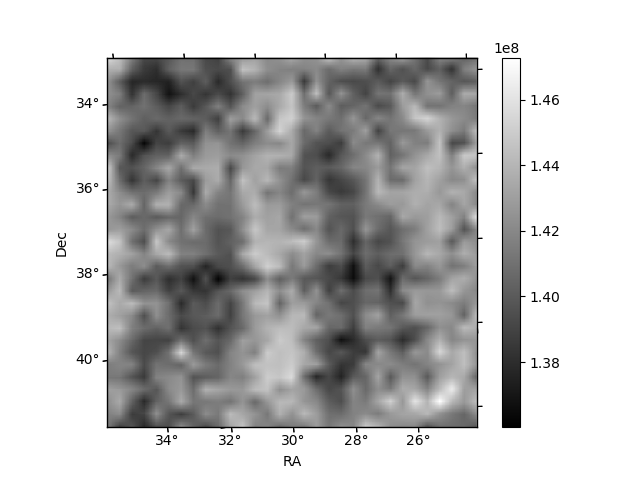
Histogram calculated using DETX and DETY for each event in the final _common_clean file
| Quadrant A | 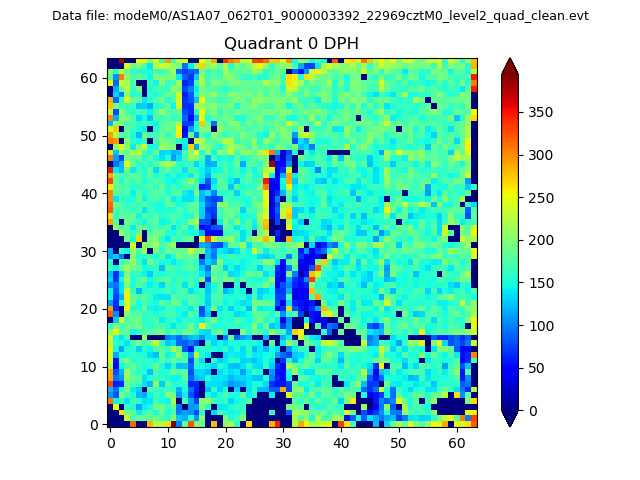 |
 |
Quadrant B |
|---|---|---|---|
| Quadrant D | 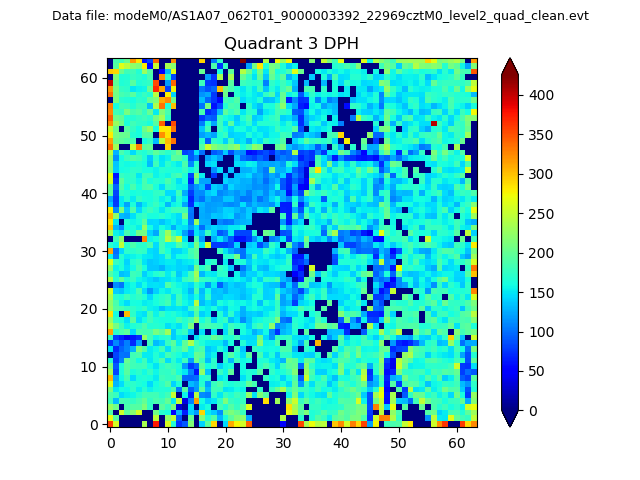 |
 |
Quadrant C |
| Plot type | Count rate plots | Images |
|---|---|---|
| Comparison with Poisson distribution Blue bars denote a histogram of data divided into 1 sec bins. Red curve is a Poisson curve with rate = median count rate of data. |
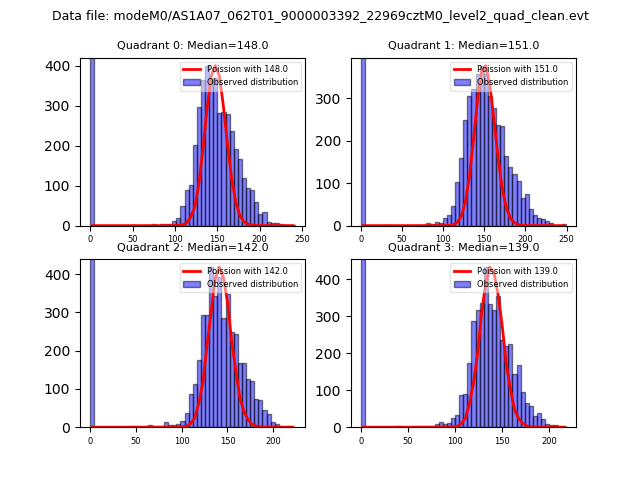 |
 |
| Quadrant-wise count rates Data is divided into 100 sec bins |
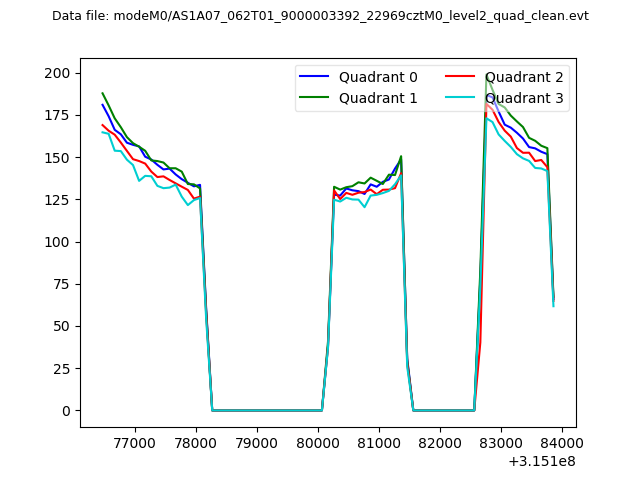 |
|
| Module-wise count rates for Quadrant A Data is divided into 100 sec bins |
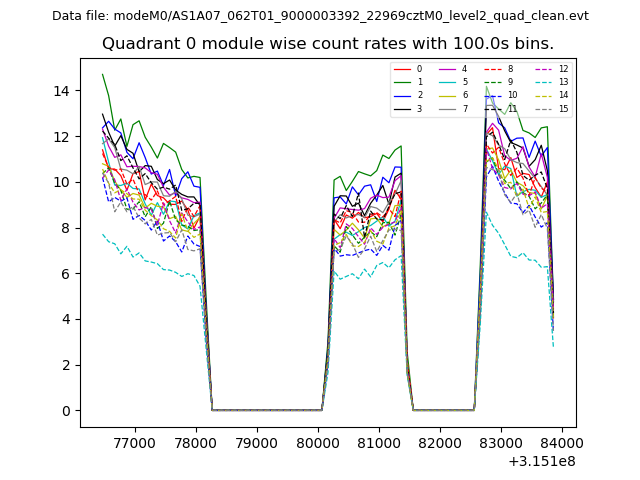 |
 |
| Module-wise count rates for Quadrant B Data is divided into 100 sec bins |
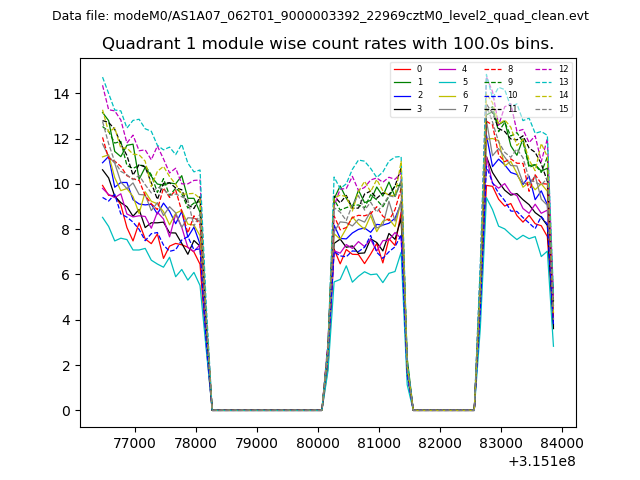 |
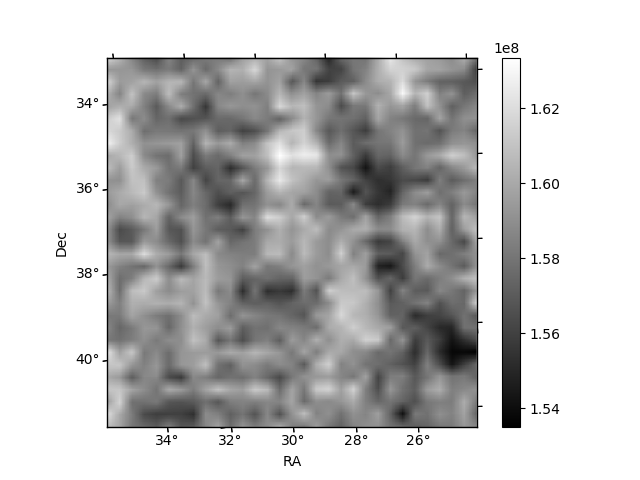 |
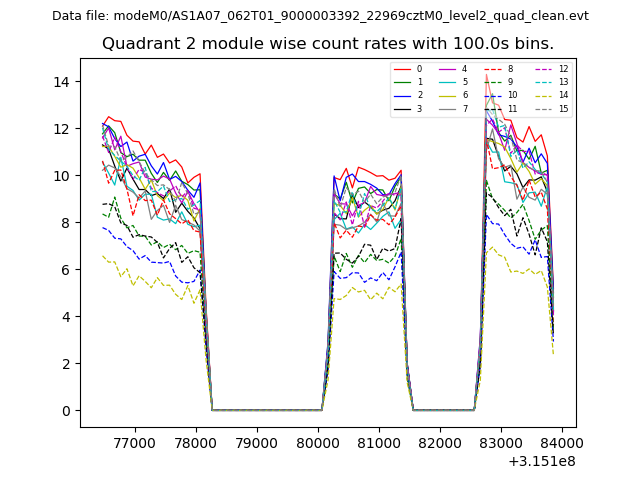
| Module-wise count rates for Quadrant C Data is divided into 100 sec bins |
 |
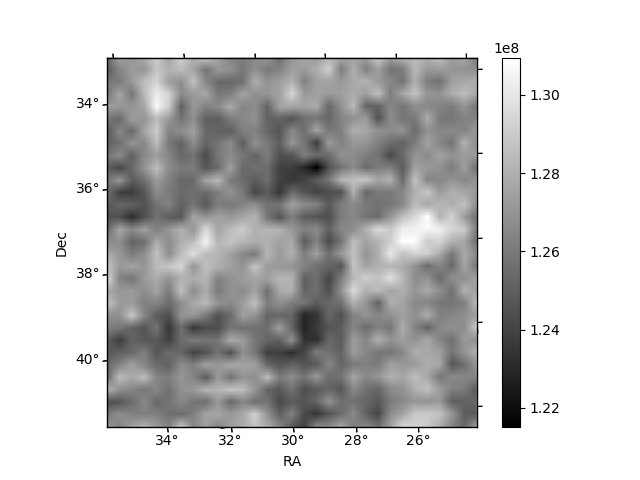 |
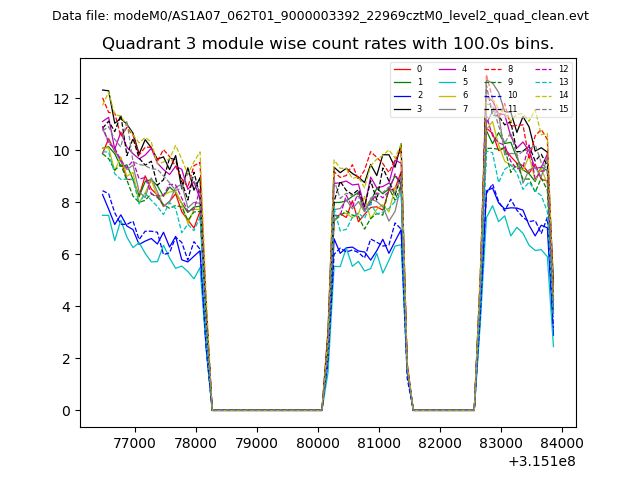
| Module-wise count rates for Quadrant D Data is divided into 100 sec bins |
 |
 |
| Parameter | Plot |
|---|---|
| CZT HV Monitor | 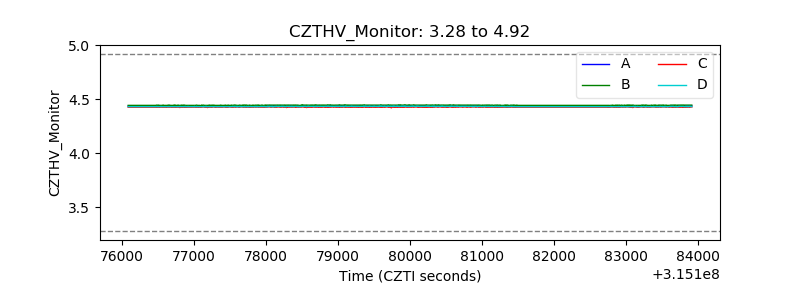 |
| D_VDD | 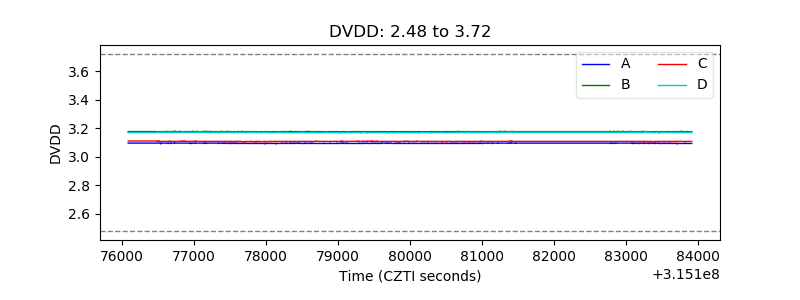 |
| Temperature 1 | 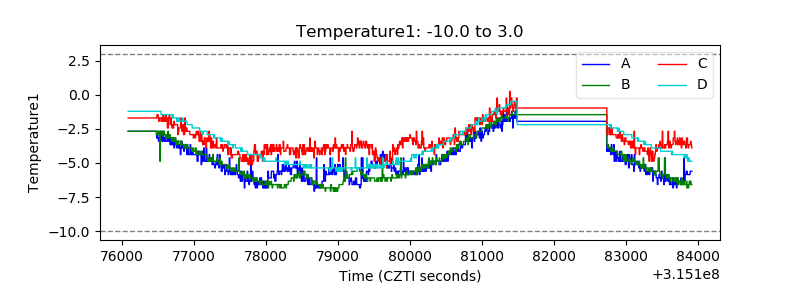 |
| Veto HV Monitor | 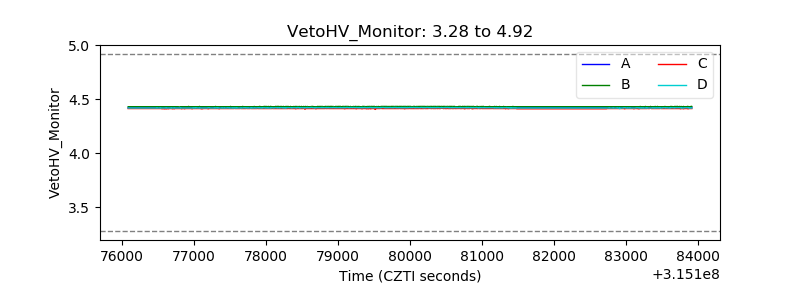 |
| Veto LLD | 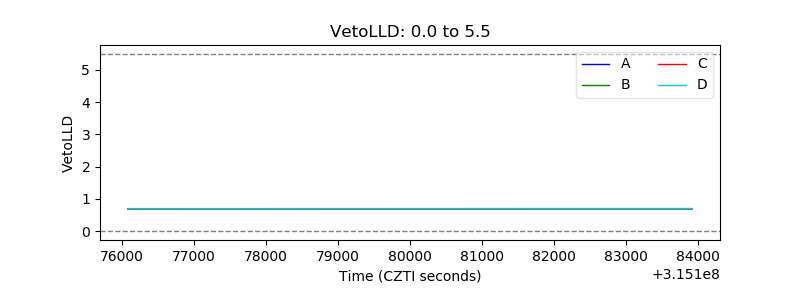 |
| Alpha Counter | 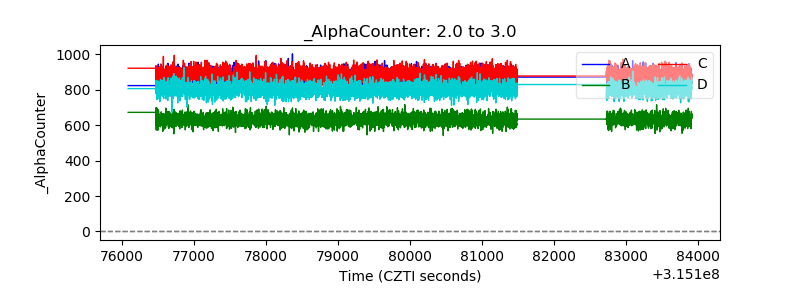 |
| _CPM_Rate | 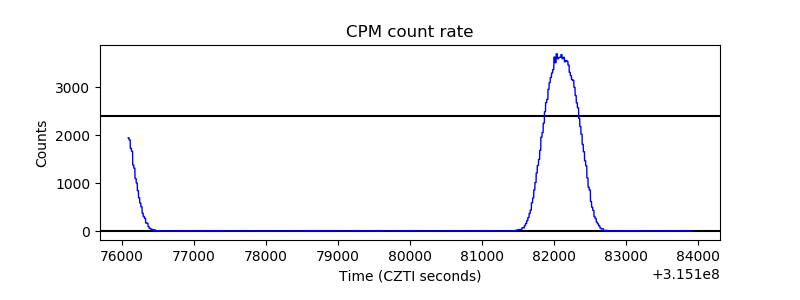 |
| CZT Counter | 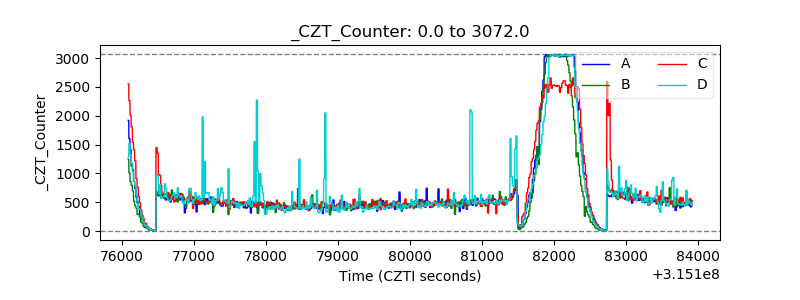 |
| +2.5 Volts monitor |  |
| +5 Volts monitor |  |
| _ROLL_ROT | 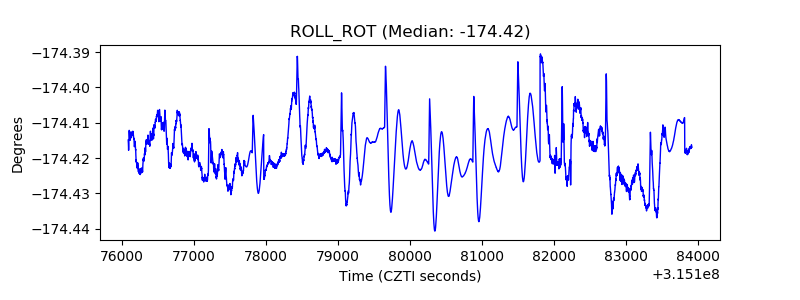 |
| _Roll_DEC | 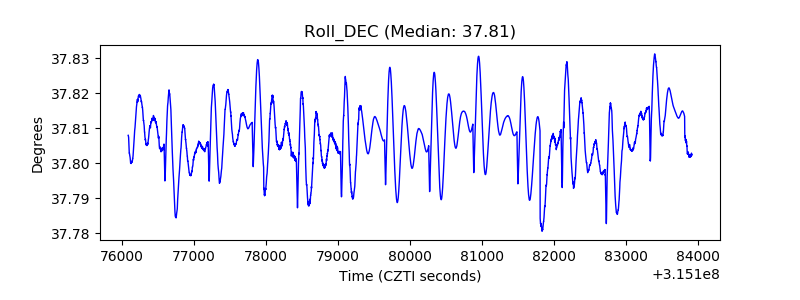 |
| _Roll_RA | 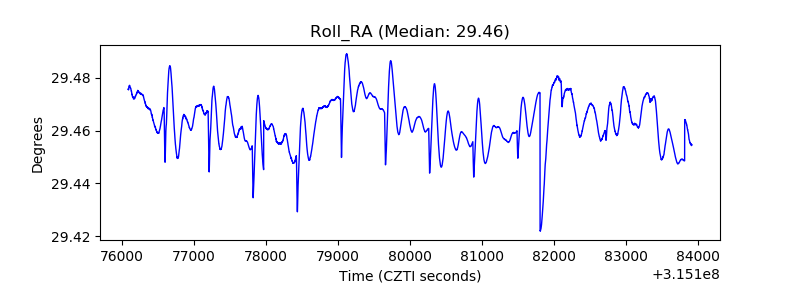 |
| Veto Counter | 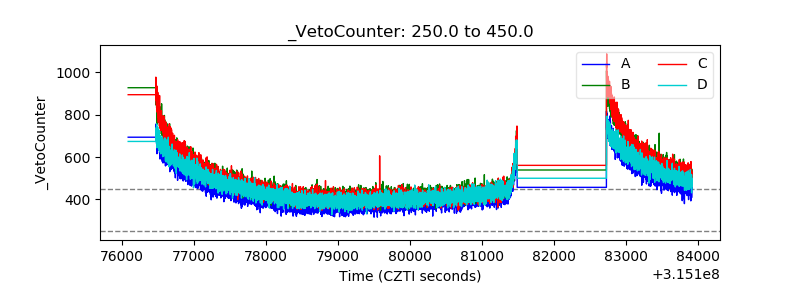 |