| Param | Original file | Final file |
|---|---|---|
| Filename | modeM0/AS1A07_062T01_9000003392_22972cztM0_level2.evt | modeM0/AS1A07_062T01_9000003392_22972cztM0_level2_quad_clean.evt |
| Size (bytes) | 453,579,840 | 72,826,560 |
| Size | 432.6 MB | 69.5 MB |
| Events in quadrant A | 3,177,743 | 454,316 |
| Events in quadrant B | 3,293,209 | 464,067 |
| Events in quadrant C | 3,334,882 | 427,991 |
| Events in quadrant D | 3,503,232 | 419,357 |
| Mode M9 | |||
|---|---|---|---|
| Quadrant | BADHDUFLAG | Total packets | Discarded packets |
| A | 0 | 13 | 0 |
| B | 0 | 13 | 0 |
| C | 0 | 13 | 0 |
| D | 0 | 13 | 0 |
| Mode SS | |||
|---|---|---|---|
| Quadrant | BADHDUFLAG | Total packets | Discarded packets |
| A | 0 | 128 | 0 |
| B | 0 | 128 | 0 |
| C | 0 | 128 | 0 |
| D | 0 | 128 | 0 |
| Mode M0 | |||
|---|---|---|---|
| Quadrant | BADHDUFLAG | Total packets | Discarded packets |
| A | 0 | 13155 | 2 |
| B | 0 | 13503 | 2 |
| C | 0 | 13587 | 3 |
| D | 0 | 14487 | 2 |
| Quadrant | Total seconds | Saturated seconds | Saturation percentage |
|---|---|---|---|
| A | 6294 | 29 | 0.460756% |
| B | 6294 | 42 | 0.667302% |
| C | 6293 | 104 | 1.652630% |
| D | 6294 | 75 | 1.191611% |
Noise dominated data is calculated using 1-second bins in cleaned event files. If a bin has >2000 counts, and if more than 50% of those come from <1% of pixels, then it is considered to be noise-dominated and hence unusable.
| Quadrant | # 1 sec bins | Bins with >0 counts | Bins with >2000 counts | High rate bins dominated by noise | Noise dominated (total time) | Noise dominated (detector-on time) | Marked lightcurve |
|---|---|---|---|---|---|---|---|
| A | 7639 | 6295 | 0 | 0 | 0.00% | 0.00% |  |
| B | 7639 | 6295 | 1 | 1 | 0.01% | 0.02% |  |
| C | 7638 | 6294 | 5 | 5 | 0.07% | 0.08% |  |
| D | 7639 | 6295 | 47 | 47 | 0.62% | 0.75% |  |
Top three noisy pixels from each quadrant. If the there are fewer than three noisy pixels in the level2.evt file, extra rows are filled as -1
| Pixel properties | Quadrant properties | ||||||
|---|---|---|---|---|---|---|---|
| Quadrant | DetID | PixID | Counts | Sigma | Mean | Median | Sigma |
| A | 13 | 254 | 10467 | 59.15 | 823 | 808 | 163.3 |
| A | 0 | 226 | 7185 | 39.05 | 823 | 808 | 163.3 |
| A | 3 | 137 | 6716 | 36.18 | 823 | 808 | 163.3 |
| B | 0 | 183 | 29476 | 186.04 | 824 | 806 | 154.1 |
| B | 12 | 111 | 17823 | 110.43 | 824 | 806 | 154.1 |
| B | 0 | 190 | 17495 | 108.3 | 824 | 806 | 154.1 |
| C | 14 | 238 | 126203 | 685.81 | 785 | 792 | 182.9 |
| C | 0 | 10 | 105134 | 570.6 | 785 | 792 | 182.9 |
| C | 0 | 239 | 40149 | 215.22 | 785 | 792 | 182.9 |
| D | 13 | 153 | 149168 | 780.92 | 787 | 768 | 190.0 |
| D | 1 | 52 | 131393 | 687.38 | 787 | 768 | 190.0 |
| D | 12 | 233 | 77136 | 401.87 | 787 | 768 | 190.0 |
Histogram calculated using DETX and DETY for each event in the final _common_clean file
| Quadrant A |  |
 |
Quadrant B |
|---|---|---|---|
| Quadrant D |  |
 |
Quadrant C |
| Plot type | Count rate plots | Images |
|---|---|---|
| Comparison with Poisson distribution Blue bars denote a histogram of data divided into 1 sec bins. Red curve is a Poisson curve with rate = median count rate of data. |
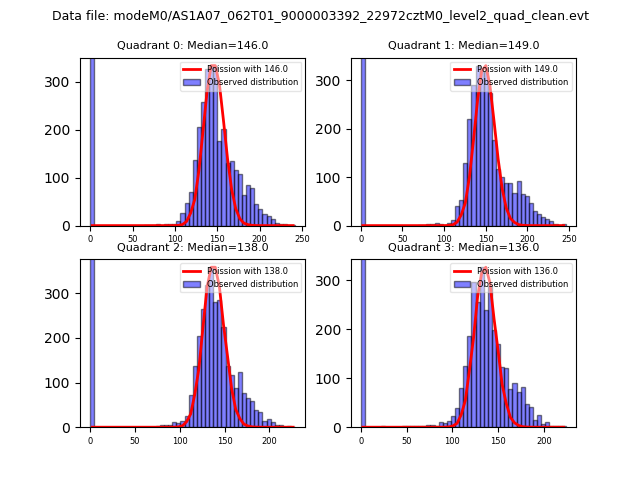 |
 |
| Quadrant-wise count rates Data is divided into 100 sec bins |
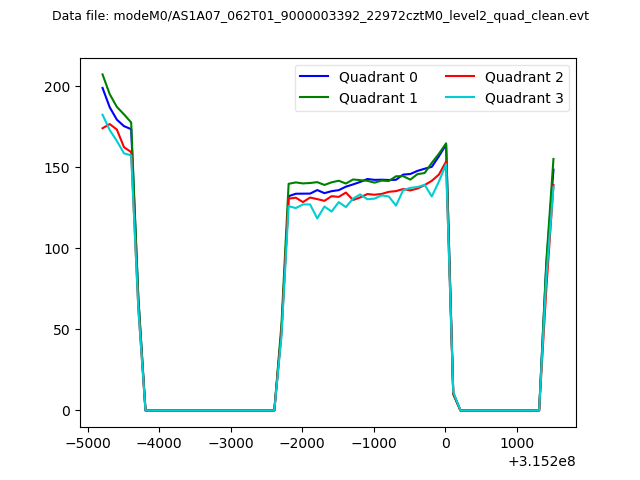 |
|
| Module-wise count rates for Quadrant A Data is divided into 100 sec bins |
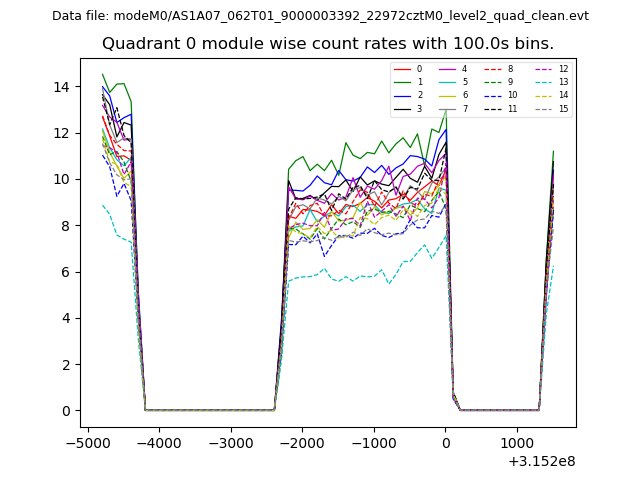 |
 |
| Module-wise count rates for Quadrant B Data is divided into 100 sec bins |
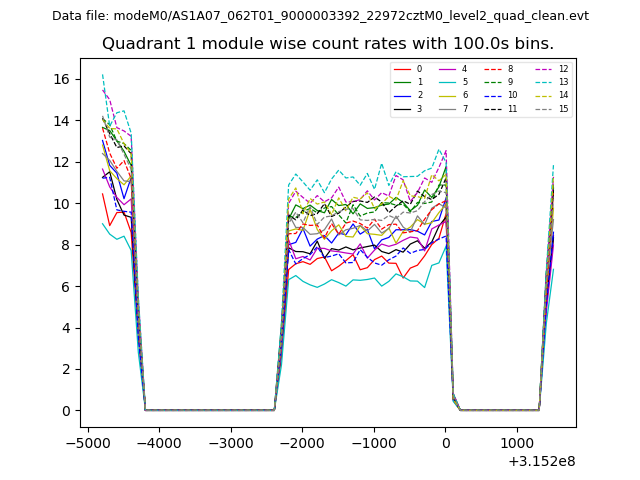 |
 |
| Module-wise count rates for Quadrant C Data is divided into 100 sec bins |
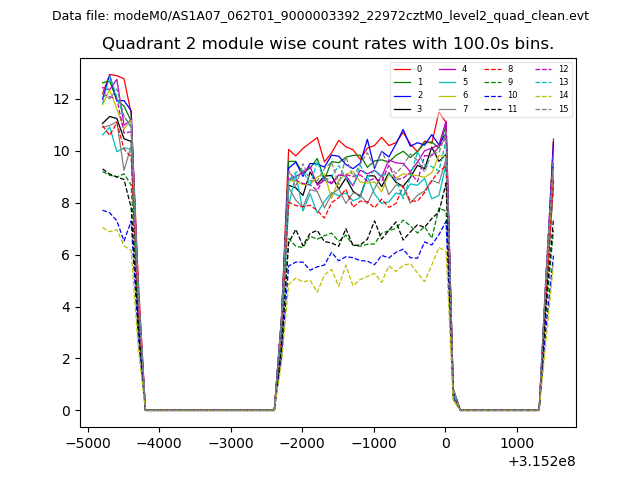 |
 |
| Module-wise count rates for Quadrant D Data is divided into 100 sec bins |
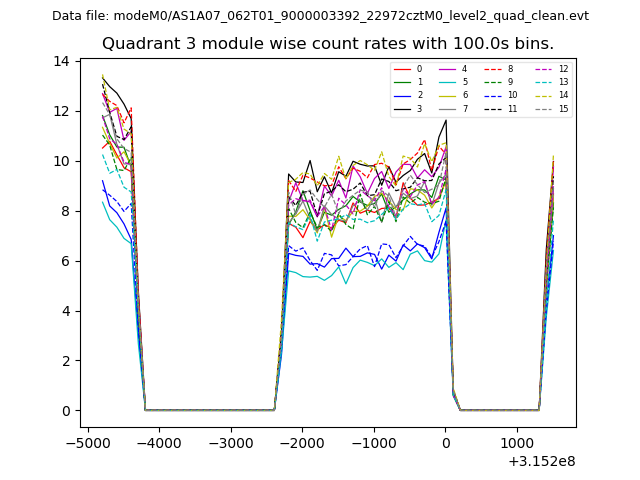 |
 |
| Parameter | Plot |
|---|---|
| CZT HV Monitor | 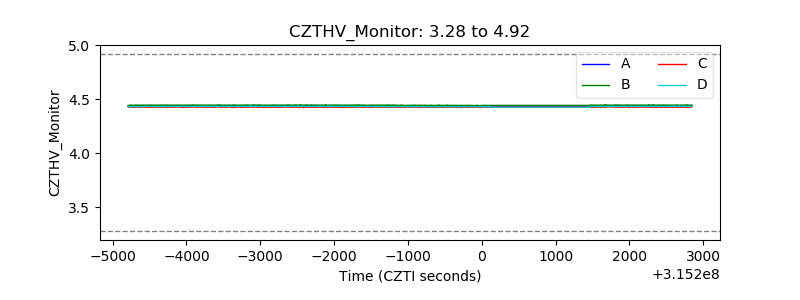 |
| D_VDD |  |
| Temperature 1 |  |
| Veto HV Monitor |  |
| Veto LLD |  |
| Alpha Counter | 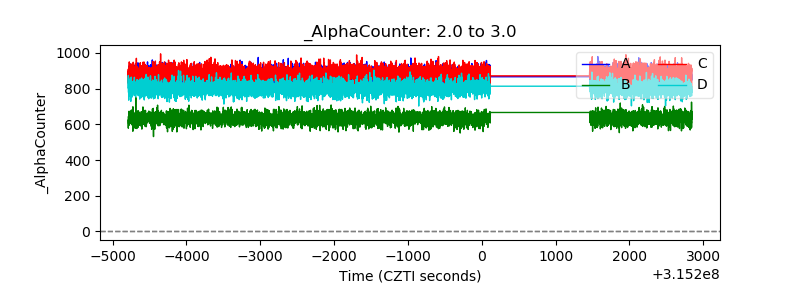 |
| _CPM_Rate | 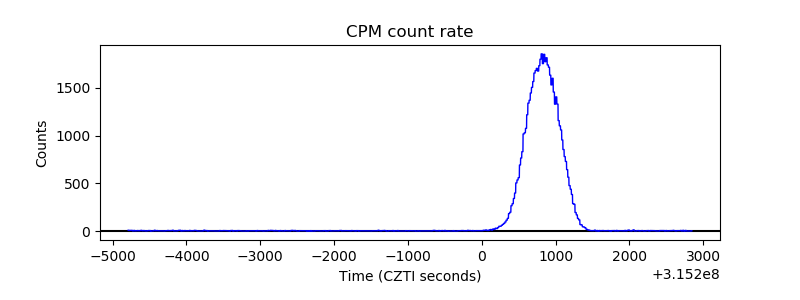 |
| CZT Counter |  |
| +2.5 Volts monitor |  |
| +5 Volts monitor |  |
| _ROLL_ROT | 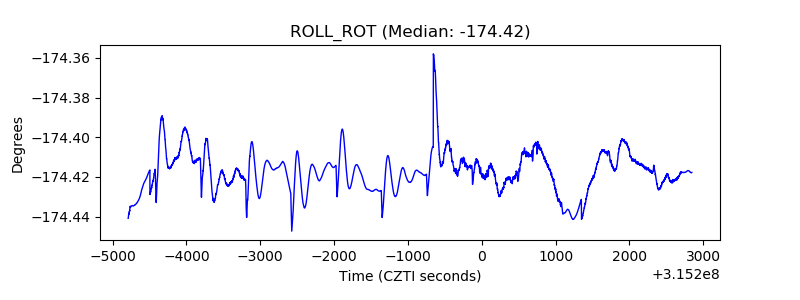 |
| _Roll_DEC | 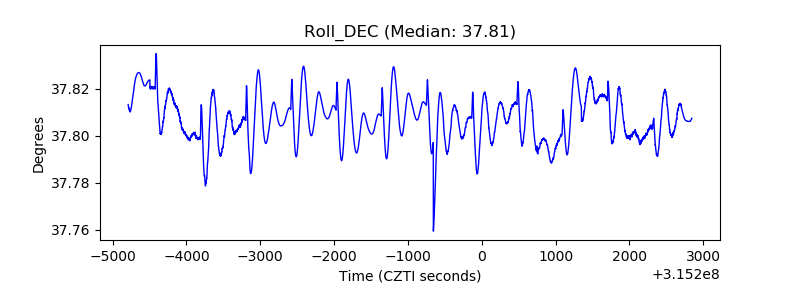 |
| _Roll_RA |  |
| Veto Counter | 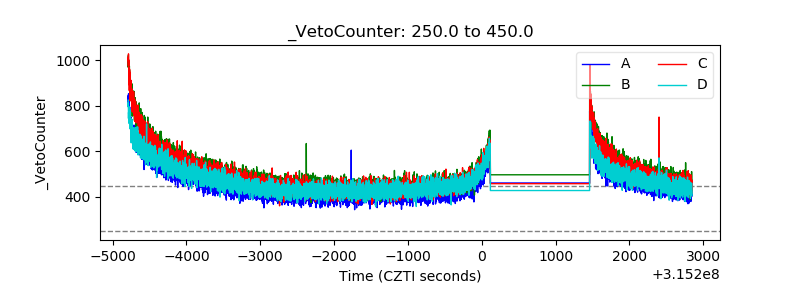 |