| Param | Original file | Final file |
|---|---|---|
| Filename | modeM0/AS1A07_062T01_9000003392_22973cztM0_level2.evt | modeM0/AS1A07_062T01_9000003392_22973cztM0_level2_quad_clean.evt |
| Size (bytes) | 464,348,160 | 69,690,240 |
| Size | 442.8 MB | 66.5 MB |
| Events in quadrant A | 3,210,534 | 426,205 |
| Events in quadrant B | 3,272,963 | 429,855 |
| Events in quadrant C | 3,386,421 | 403,107 |
| Events in quadrant D | 3,750,580 | 396,783 |
| Mode M9 | |||
|---|---|---|---|
| Quadrant | BADHDUFLAG | Total packets | Discarded packets |
| A | 0 | 14 | 0 |
| B | 0 | 15 | 0 |
| C | 0 | 15 | 0 |
| D | 0 | 15 | 0 |
| Mode SS | |||
|---|---|---|---|
| Quadrant | BADHDUFLAG | Total packets | Discarded packets |
| A | 0 | 132 | 0 |
| B | 0 | 132 | 0 |
| C | 0 | 132 | 0 |
| D | 0 | 132 | 0 |
| Mode M0 | |||
|---|---|---|---|
| Quadrant | BADHDUFLAG | Total packets | Discarded packets |
| A | 0 | 13477 | 2 |
| B | 0 | 13574 | 2 |
| C | 0 | 13933 | 2 |
| D | 0 | 15502 | 2 |
| Quadrant | Total seconds | Saturated seconds | Saturation percentage |
|---|---|---|---|
| A | 6513 | 19 | 0.291724% |
| B | 6512 | 32 | 0.491400% |
| C | 6512 | 137 | 2.103808% |
| D | 6512 | 92 | 1.412776% |
Noise dominated data is calculated using 1-second bins in cleaned event files. If a bin has >2000 counts, and if more than 50% of those come from <1% of pixels, then it is considered to be noise-dominated and hence unusable.
| Quadrant | # 1 sec bins | Bins with >0 counts | Bins with >2000 counts | High rate bins dominated by noise | Noise dominated (total time) | Noise dominated (detector-on time) | Marked lightcurve |
|---|---|---|---|---|---|---|---|
| A | 7683 | 6514 | 0 | 0 | 0.00% | 0.00% | 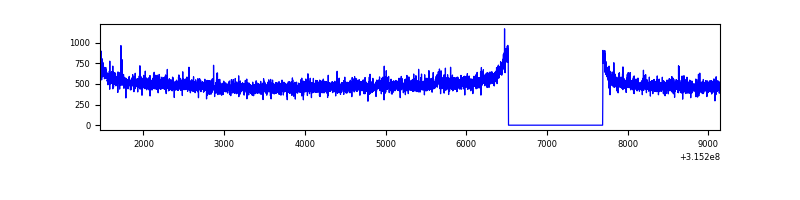 |
| B | 7682 | 6513 | 0 | 0 | 0.00% | 0.00% | 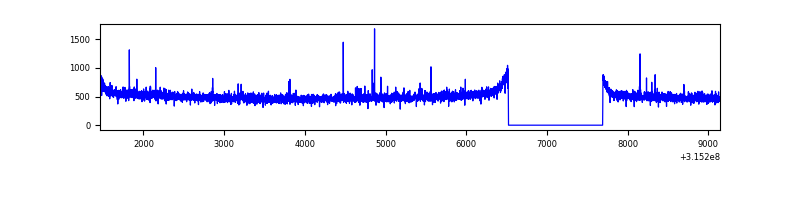 |
| C | 7682 | 6513 | 17 | 17 | 0.22% | 0.26% | 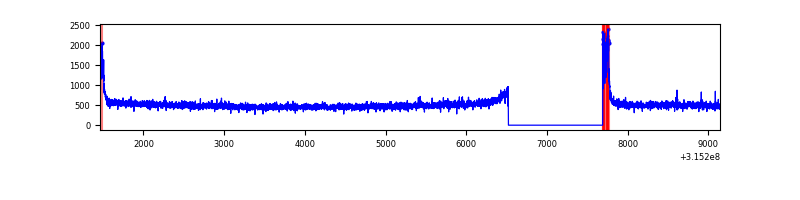 |
| D | 7682 | 6513 | 67 | 67 | 0.87% | 1.03% | 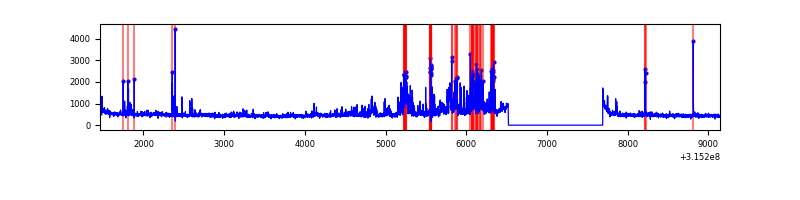 |
Top three noisy pixels from each quadrant. If the there are fewer than three noisy pixels in the level2.evt file, extra rows are filled as -1
| Pixel properties | Quadrant properties | ||||||
|---|---|---|---|---|---|---|---|
| Quadrant | DetID | PixID | Counts | Sigma | Mean | Median | Sigma |
| A | 13 | 170 | 21431 | 126.06 | 827 | 811 | 163.6 |
| A | 13 | 254 | 10494 | 59.2 | 827 | 811 | 163.6 |
| A | 0 | 226 | 7131 | 38.64 | 827 | 811 | 163.6 |
| B | 12 | 111 | 18656 | 114.85 | 826 | 806 | 155.4 |
| B | 0 | 189 | 17735 | 108.92 | 826 | 806 | 155.4 |
| B | 11 | 111 | 16474 | 100.81 | 826 | 806 | 155.4 |
| C | 0 | 10 | 182974 | 999.45 | 783 | 790 | 182.3 |
| C | 14 | 238 | 124673 | 679.62 | 783 | 790 | 182.3 |
| C | 0 | 239 | 23273 | 123.34 | 783 | 790 | 182.3 |
| D | 13 | 172 | 289049 | 1510.85 | 791 | 769 | 190.8 |
| D | 1 | 52 | 149033 | 777.04 | 791 | 769 | 190.8 |
| D | 8 | 195 | 93958 | 488.4 | 791 | 769 | 190.8 |
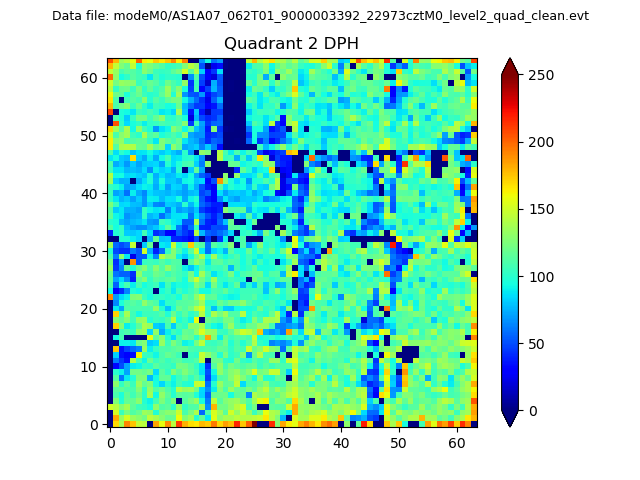
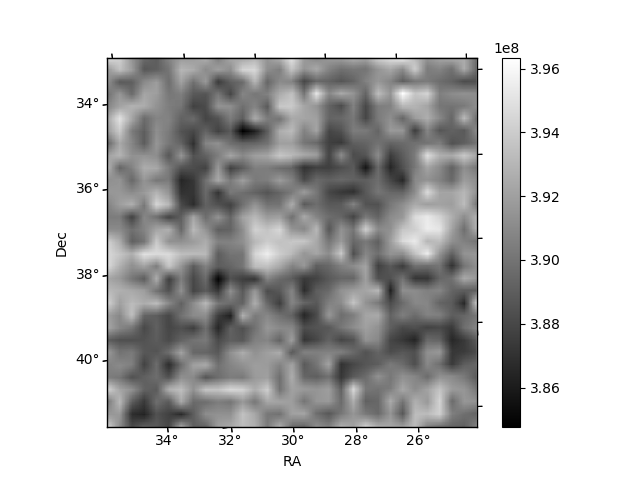
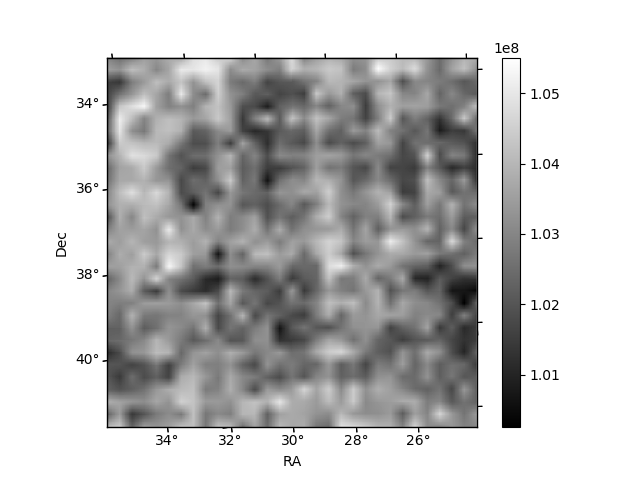
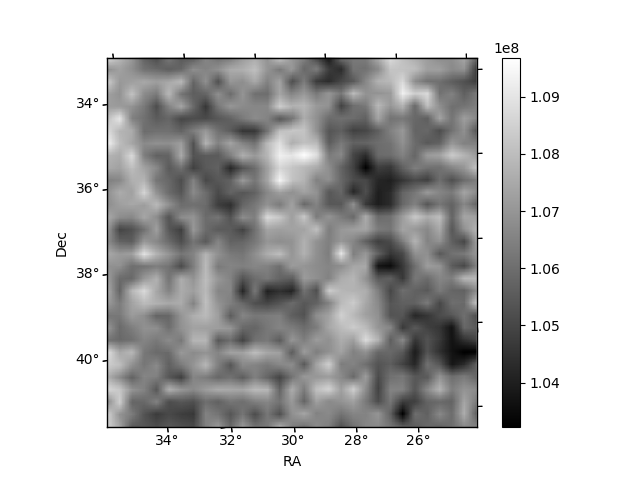
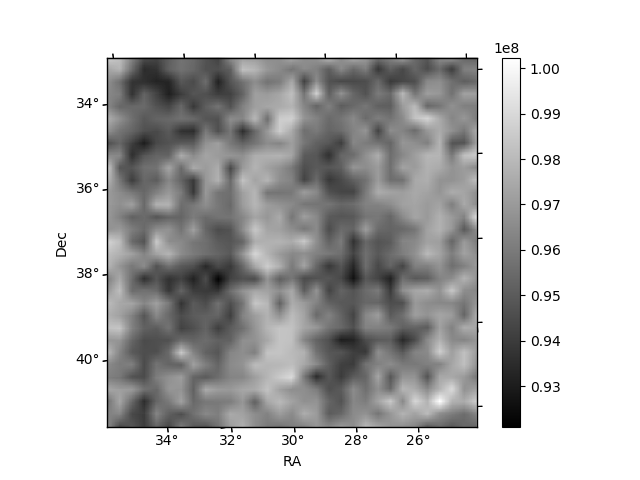
Histogram calculated using DETX and DETY for each event in the final _common_clean file
| Quadrant A | 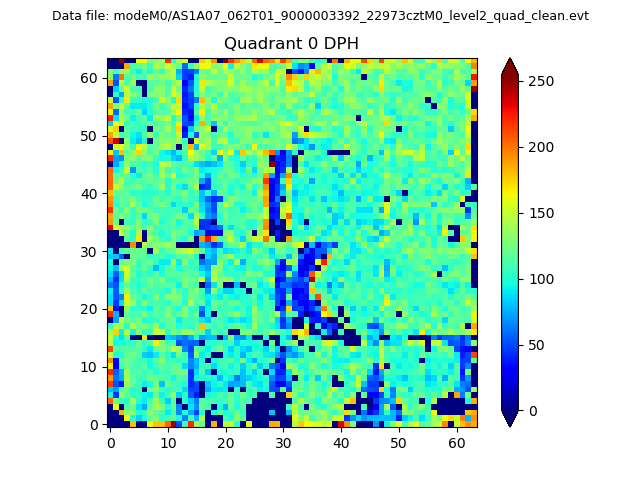 |
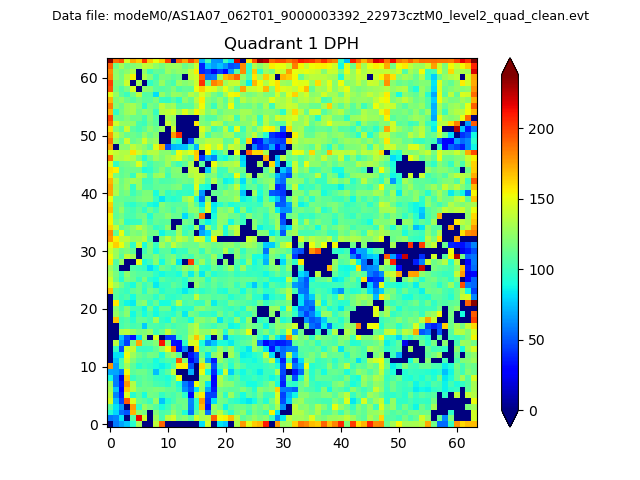 |
Quadrant B |
|---|---|---|---|
| Quadrant D | 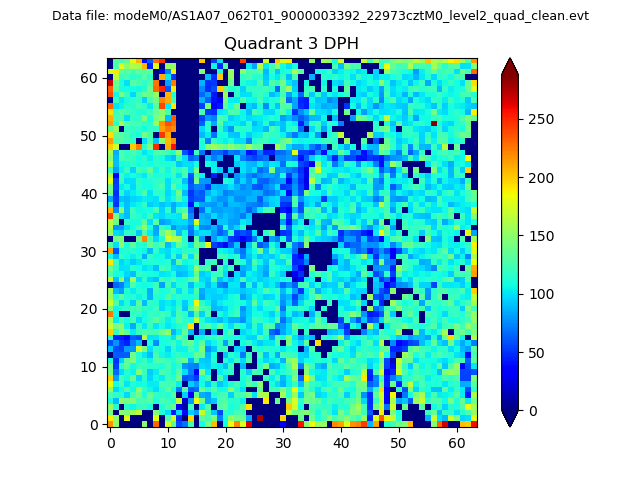 |
 |
Quadrant C |
| Plot type | Count rate plots | Images |
|---|---|---|
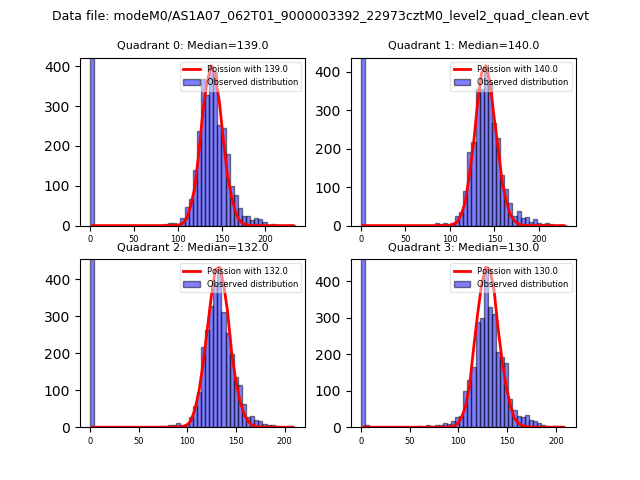
| Comparison with Poisson distribution Blue bars denote a histogram of data divided into 1 sec bins. Red curve is a Poisson curve with rate = median count rate of data. |
 |
 |
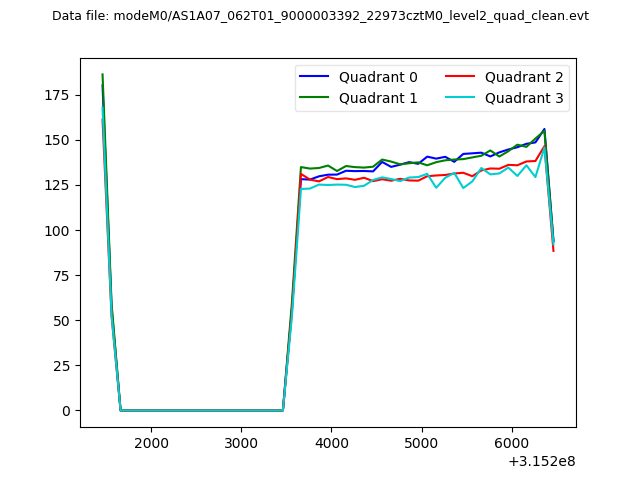
| Quadrant-wise count rates Data is divided into 100 sec bins |
 |
|
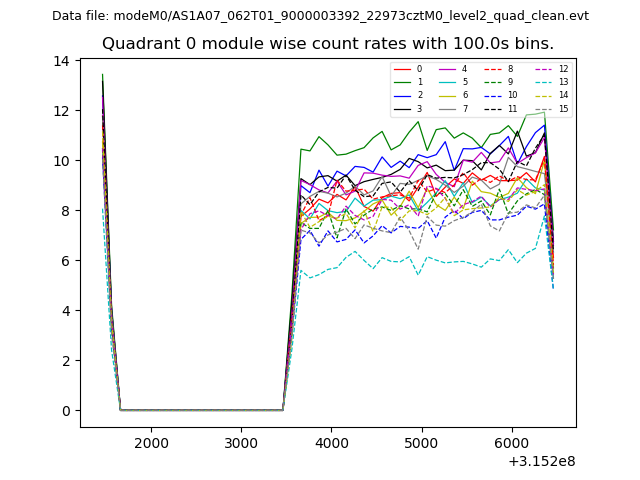
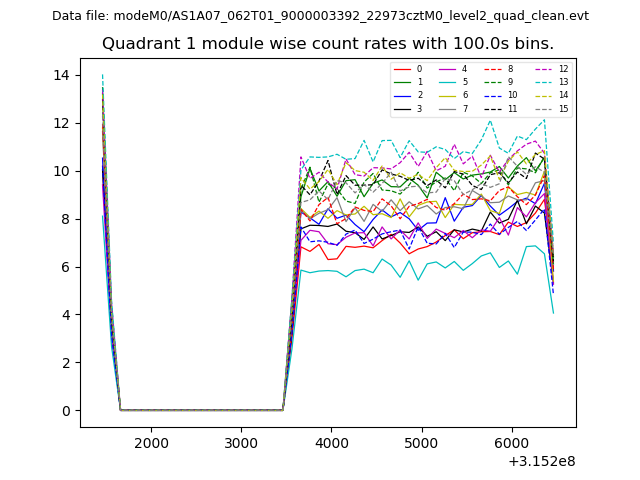
| Module-wise count rates for Quadrant A Data is divided into 100 sec bins |
 |
 |
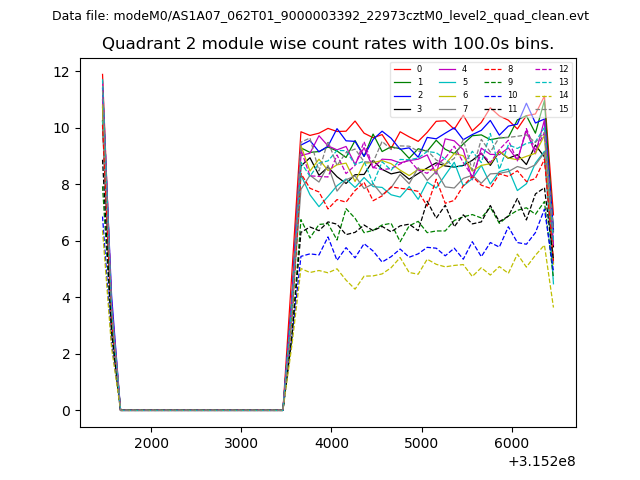
| Module-wise count rates for Quadrant B Data is divided into 100 sec bins |
 |
 |
| Module-wise count rates for Quadrant C Data is divided into 100 sec bins |
 |
 |
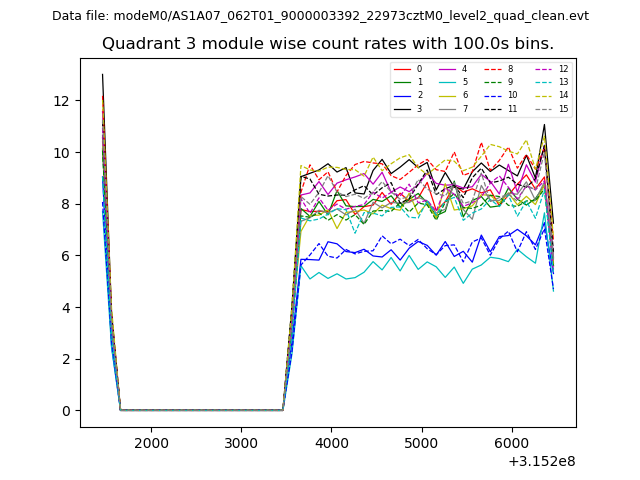
| Module-wise count rates for Quadrant D Data is divided into 100 sec bins |
 |
 |
| Parameter | Plot |
|---|---|
| CZT HV Monitor | 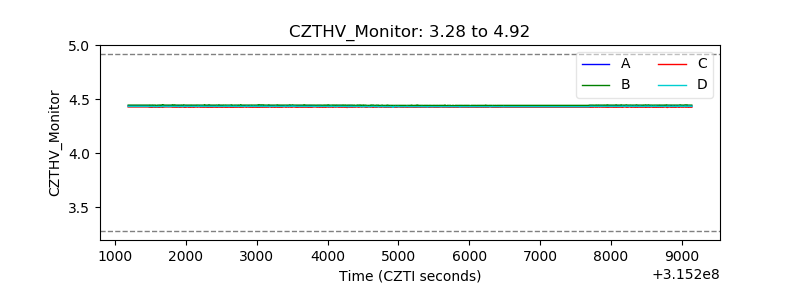 |
| D_VDD | 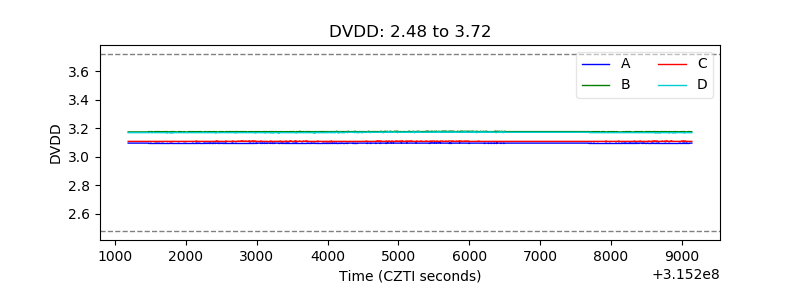 |
| Temperature 1 | 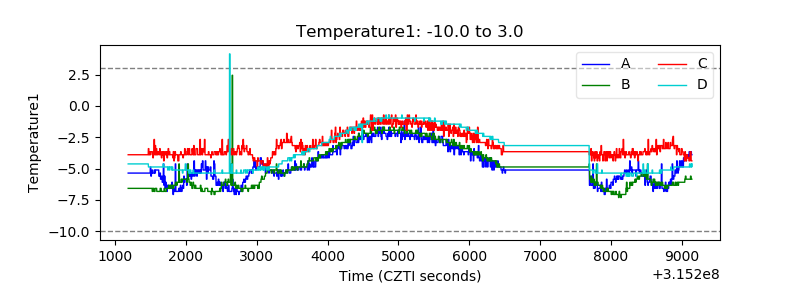 |
| Veto HV Monitor | 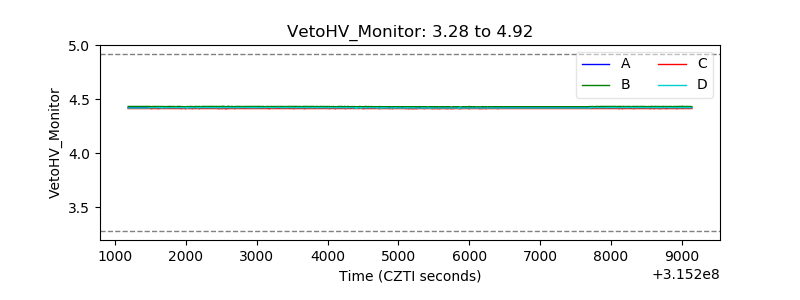 |
| Veto LLD |  |
| Alpha Counter |  |
| _CPM_Rate | 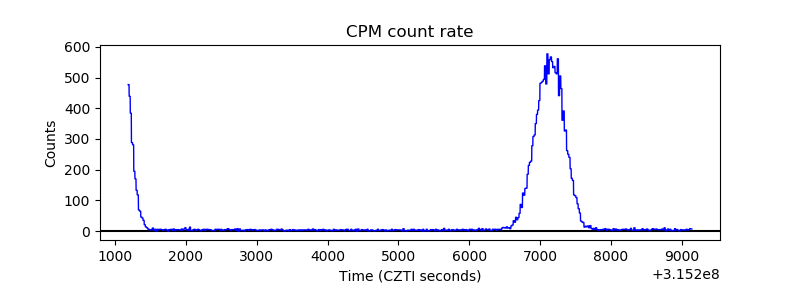 |
| CZT Counter | 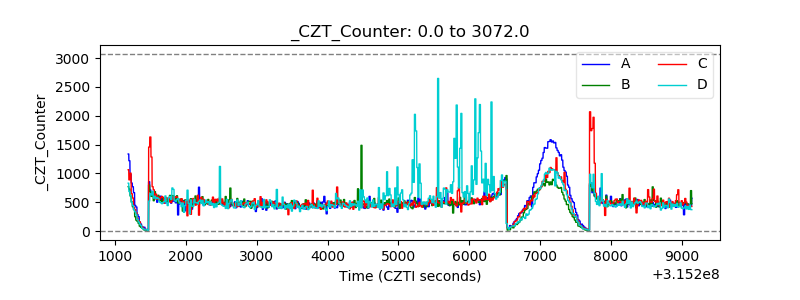 |
| +2.5 Volts monitor |  |
| +5 Volts monitor | 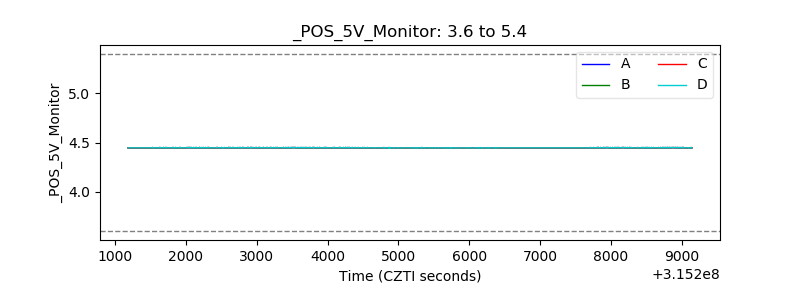 |
| _ROLL_ROT | 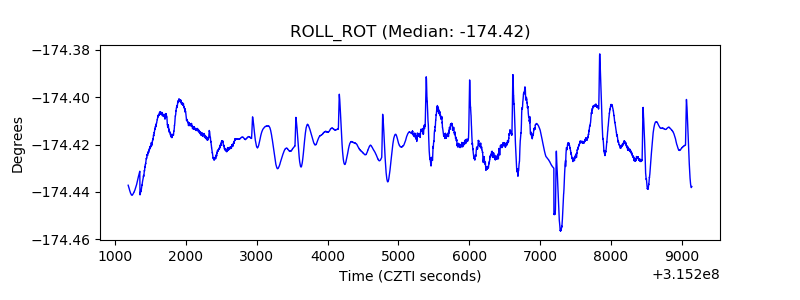 |
| _Roll_DEC | 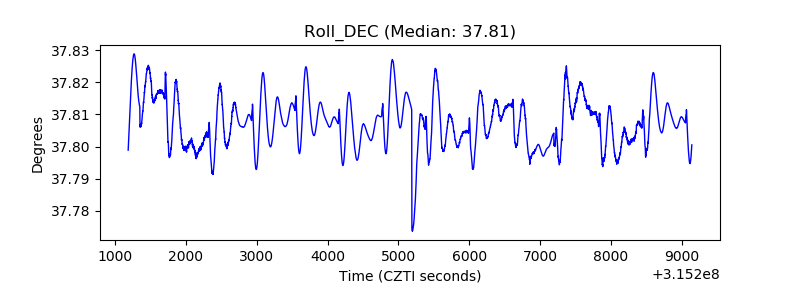 |
| _Roll_RA | 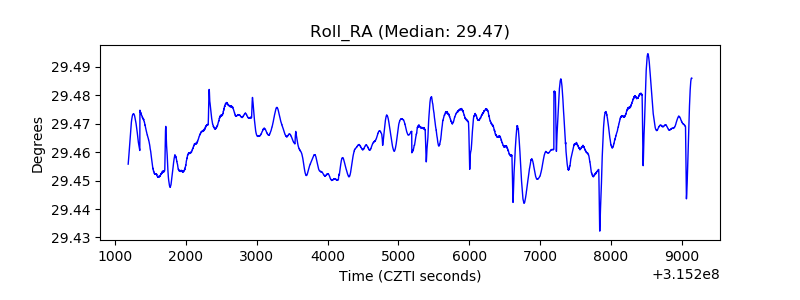 |
| Veto Counter | 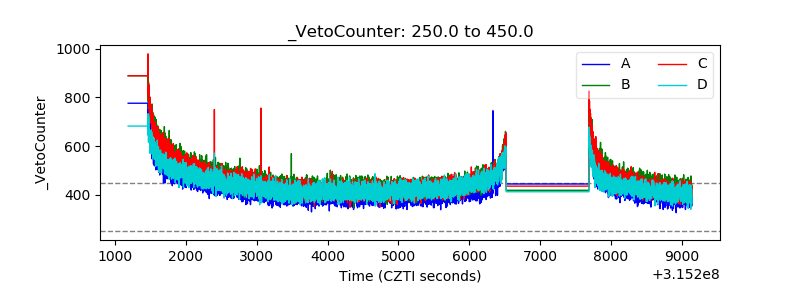 |