| Param | Original file | Final file |
|---|---|---|
| Filename | modeM0/AS1A07_062T01_9000003392_22974cztM0_level2.evt | modeM0/AS1A07_062T01_9000003392_22974cztM0_level2_quad_clean.evt |
| Size (bytes) | 469,448,640 | 79,557,120 |
| Size | 447.7 MB | 75.9 MB |
| Events in quadrant A | 3,305,695 | 495,756 |
| Events in quadrant B | 3,333,000 | 498,610 |
| Events in quadrant C | 3,591,658 | 470,759 |
| Events in quadrant D | 3,519,943 | 465,136 |
| Mode M9 | |||
|---|---|---|---|
| Quadrant | BADHDUFLAG | Total packets | Discarded packets |
| A | 0 | 8 | 0 |
| B | 0 | 8 | 0 |
| C | 0 | 8 | 0 |
| D | 0 | 8 | 0 |
| Mode SS | |||
|---|---|---|---|
| Quadrant | BADHDUFLAG | Total packets | Discarded packets |
| A | 0 | 138 | 0 |
| B | 0 | 138 | 0 |
| C | 0 | 138 | 0 |
| D | 0 | 138 | 0 |
| Mode M0 | |||
|---|---|---|---|
| Quadrant | BADHDUFLAG | Total packets | Discarded packets |
| A | 0 | 14094 | 2 |
| B | 0 | 14149 | 2 |
| C | 0 | 14817 | 2 |
| D | 0 | 15042 | 2 |
| Quadrant | Total seconds | Saturated seconds | Saturation percentage |
|---|---|---|---|
| A | 6876 | 87 | 1.265271% |
| B | 6876 | 101 | 1.468877% |
| C | 6876 | 205 | 2.981385% |
| D | 6875 | 139 | 2.021818% |
Noise dominated data is calculated using 1-second bins in cleaned event files. If a bin has >2000 counts, and if more than 50% of those come from <1% of pixels, then it is considered to be noise-dominated and hence unusable.
| Quadrant | # 1 sec bins | Bins with >0 counts | Bins with >2000 counts | High rate bins dominated by noise | Noise dominated (total time) | Noise dominated (detector-on time) | Marked lightcurve |
|---|---|---|---|---|---|---|---|
| A | 7626 | 6877 | 0 | 0 | 0.00% | 0.00% | 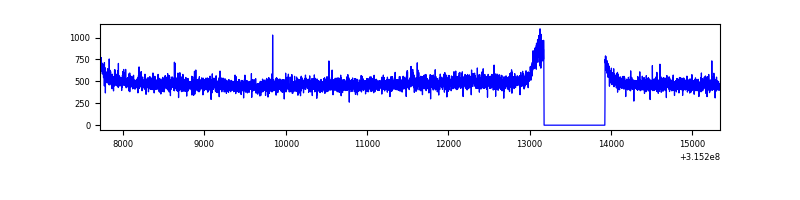 |
| B | 7626 | 6877 | 0 | 0 | 0.00% | 0.00% | 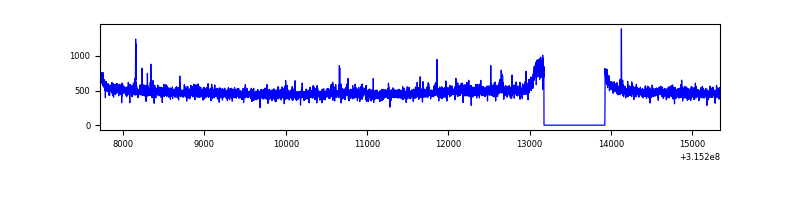 |
| C | 7626 | 6877 | 17 | 17 | 0.22% | 0.25% | 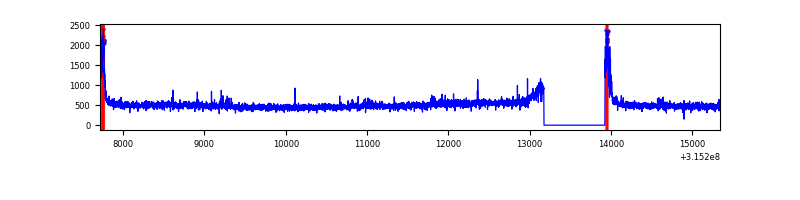 |
| D | 7625 | 6876 | 66 | 66 | 0.87% | 0.96% | 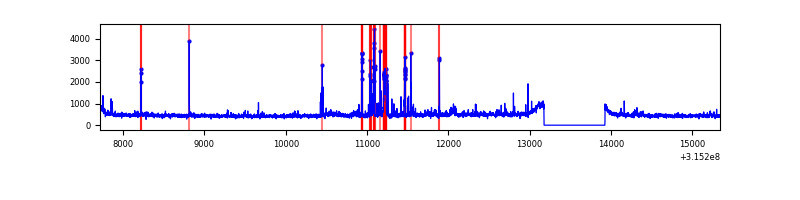 |
Top three noisy pixels from each quadrant. If the there are fewer than three noisy pixels in the level2.evt file, extra rows are filled as -1
| Pixel properties | Quadrant properties | ||||||
|---|---|---|---|---|---|---|---|
| Quadrant | DetID | PixID | Counts | Sigma | Mean | Median | Sigma |
| A | 13 | 170 | 44419 | 257.15 | 845 | 826 | 169.5 |
| A | 13 | 254 | 11256 | 61.52 | 845 | 826 | 169.5 |
| A | 0 | 226 | 7368 | 38.59 | 845 | 826 | 169.5 |
| B | 12 | 111 | 19662 | 117.32 | 842 | 820 | 160.6 |
| B | 11 | 111 | 17383 | 103.13 | 842 | 820 | 160.6 |
| B | 14 | 111 | 15053 | 88.62 | 842 | 820 | 160.6 |
| C | 0 | 10 | 284632 | 1507.05 | 805 | 808 | 188.3 |
| C | 14 | 238 | 127889 | 674.77 | 805 | 808 | 188.3 |
| C | 0 | 239 | 20026 | 102.04 | 805 | 808 | 188.3 |
| D | 7 | 38 | 175543 | 886.26 | 818 | 794 | 197.2 |
| D | 1 | 52 | 83226 | 418.06 | 818 | 794 | 197.2 |
| D | 13 | 153 | 63790 | 319.49 | 818 | 794 | 197.2 |
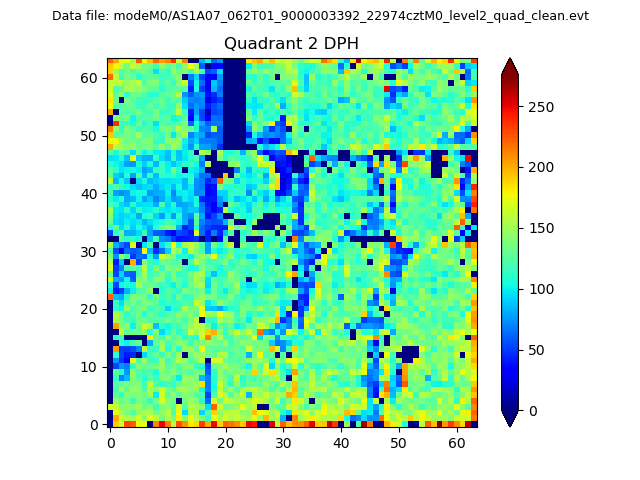
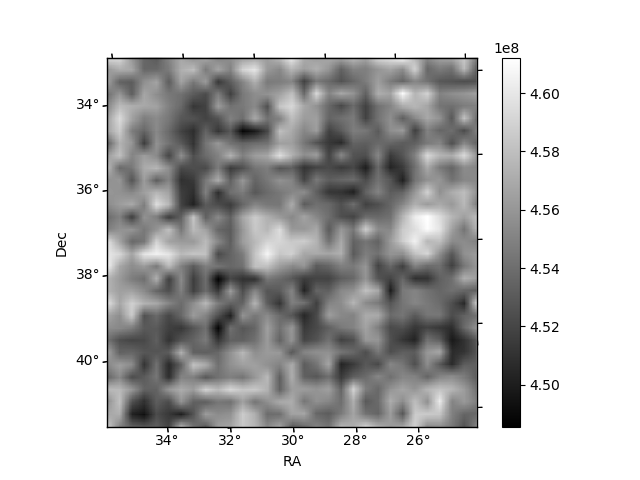
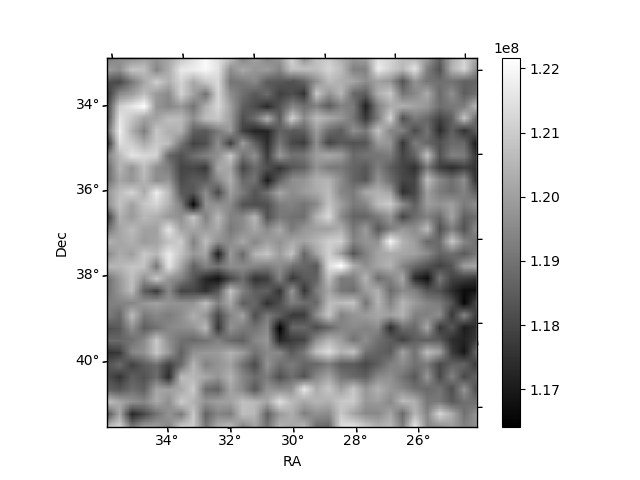
Histogram calculated using DETX and DETY for each event in the final _common_clean file
| Quadrant A | 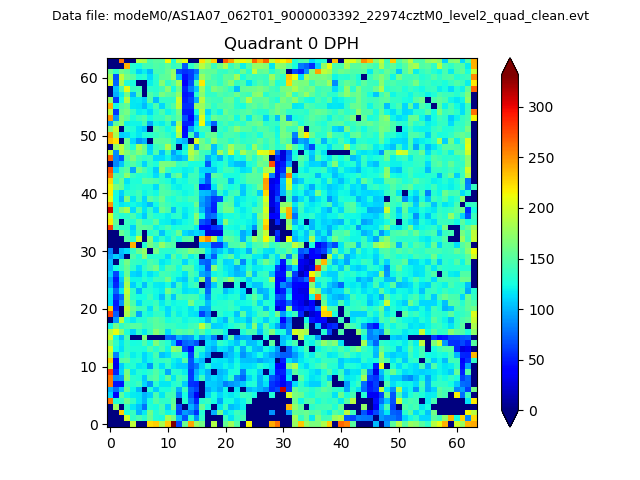 |
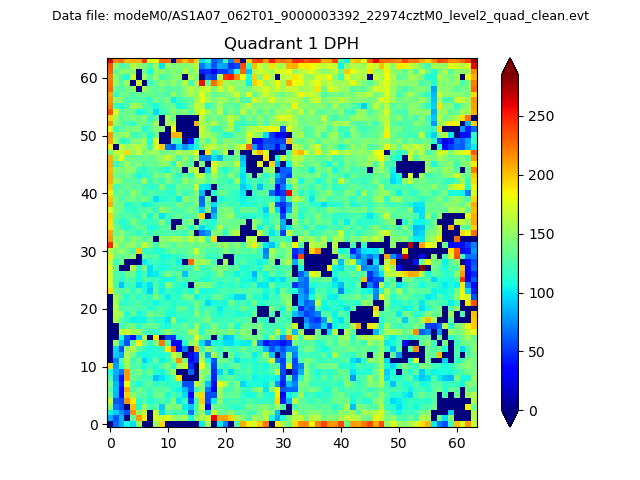 |
Quadrant B |
|---|---|---|---|
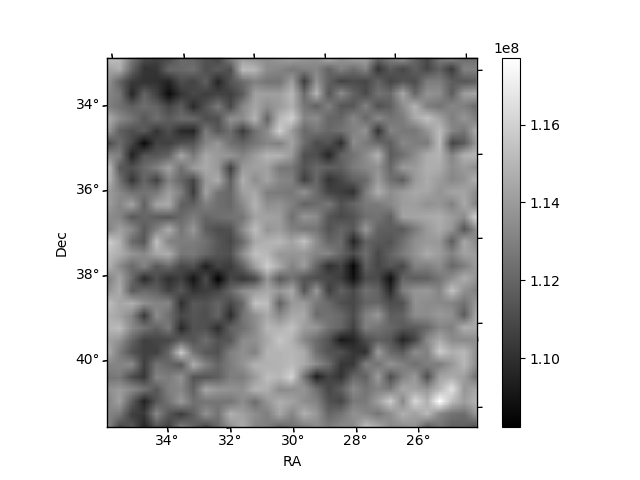
| Quadrant D | 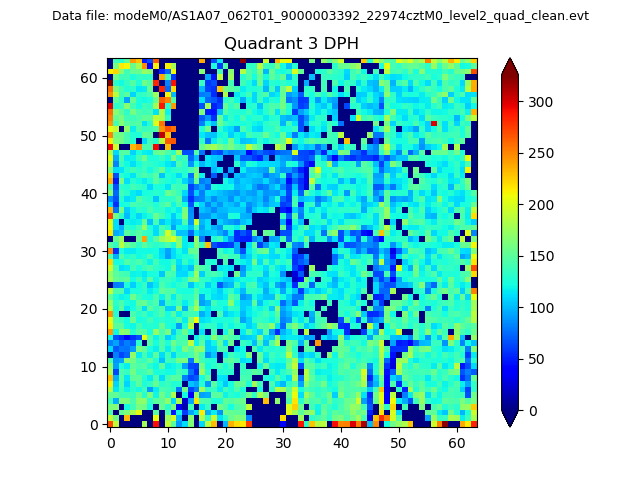 |
 |
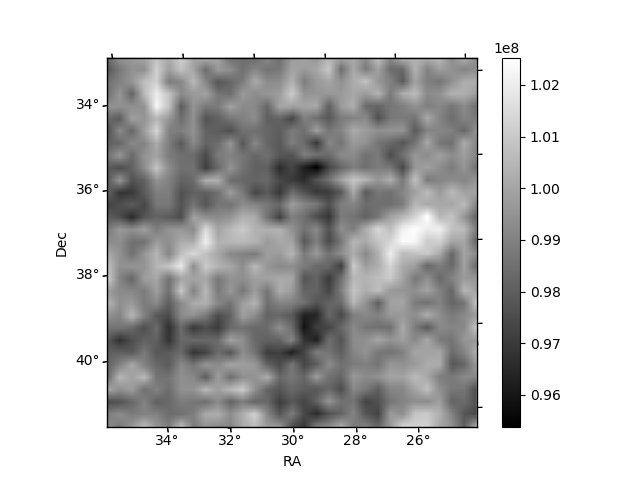
Quadrant C |
| Plot type | Count rate plots | Images |
|---|---|---|
| Comparison with Poisson distribution Blue bars denote a histogram of data divided into 1 sec bins. Red curve is a Poisson curve with rate = median count rate of data. |
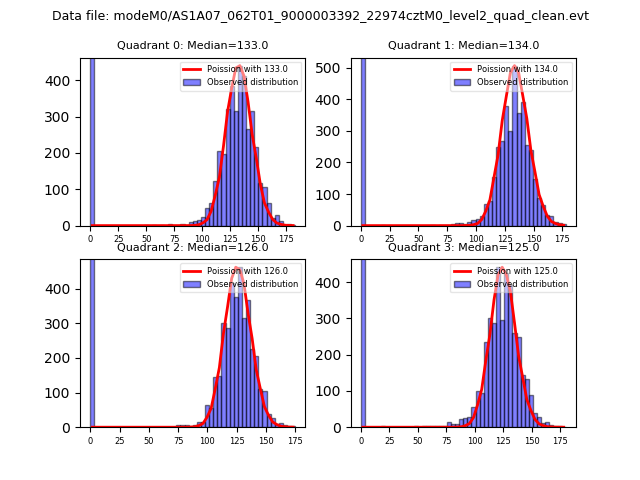 |
 |
| Quadrant-wise count rates Data is divided into 100 sec bins |
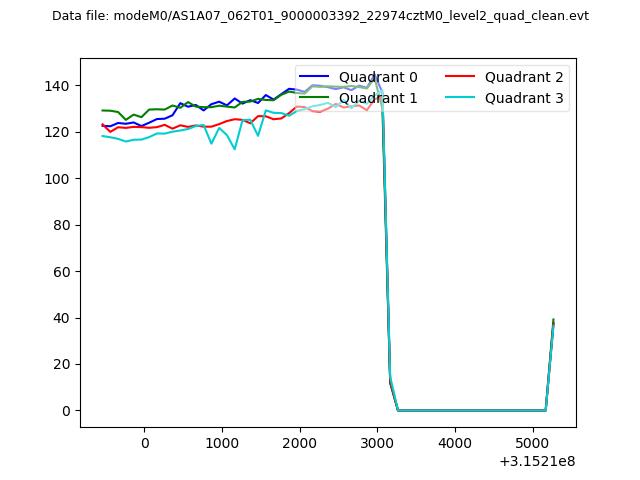 |
|
| Module-wise count rates for Quadrant A Data is divided into 100 sec bins |
 |
 |
| Module-wise count rates for Quadrant B Data is divided into 100 sec bins |
 |
 |
| Module-wise count rates for Quadrant C Data is divided into 100 sec bins |
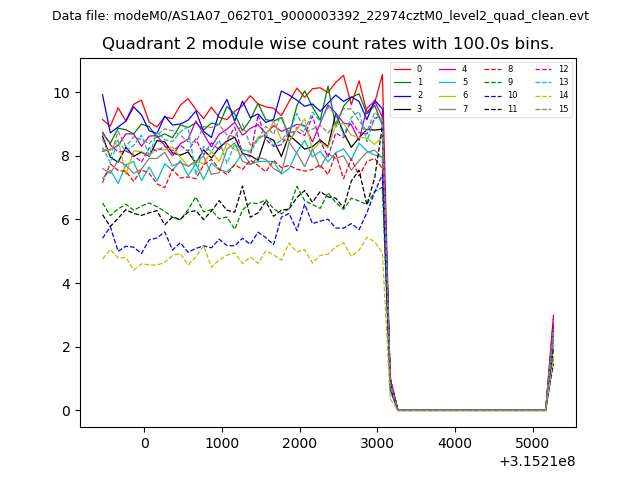 |
 |
| Module-wise count rates for Quadrant D Data is divided into 100 sec bins |
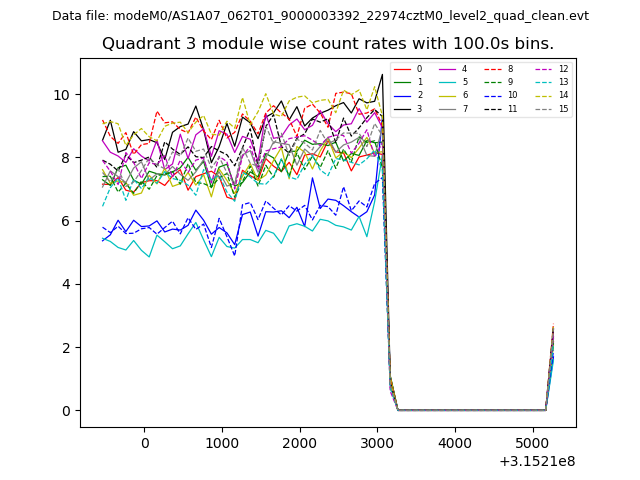 |
 |
| Parameter | Plot |
|---|---|
| CZT HV Monitor | 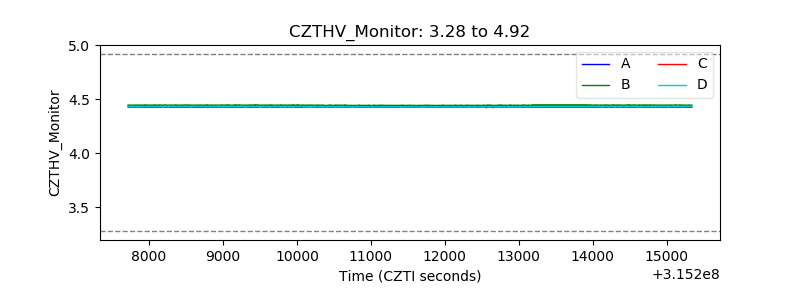 |
| D_VDD | 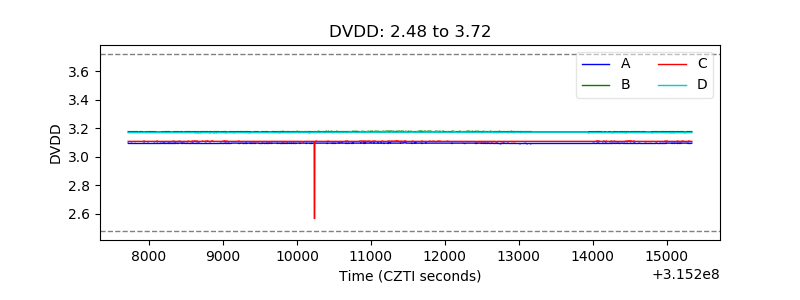 |
| Temperature 1 | 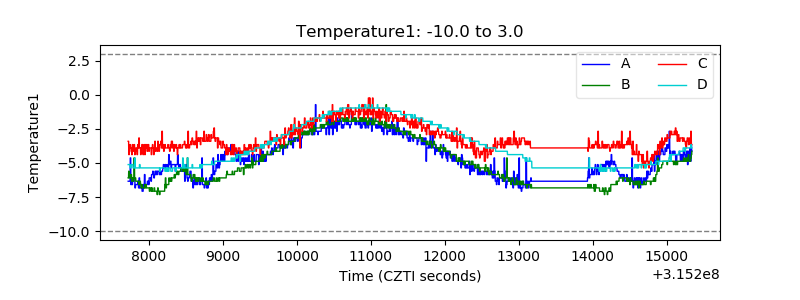 |
| Veto HV Monitor | 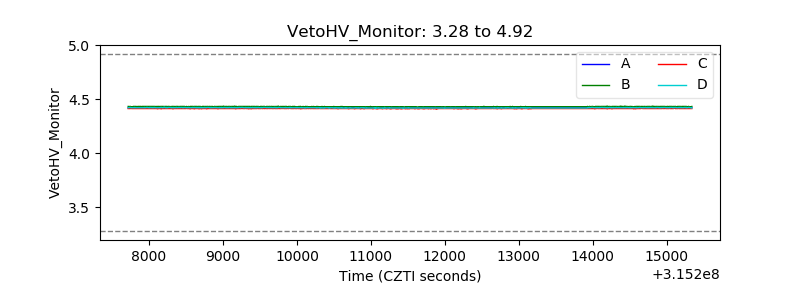 |
| Veto LLD | 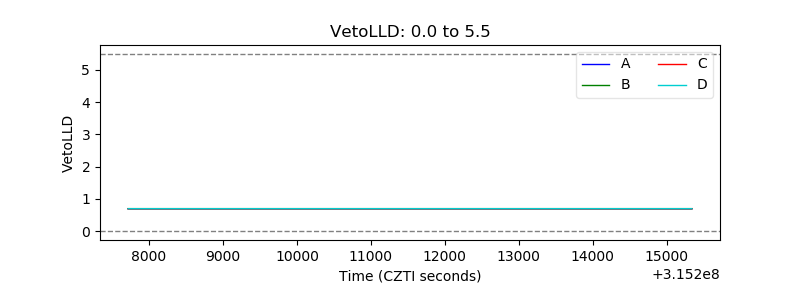 |
| Alpha Counter | 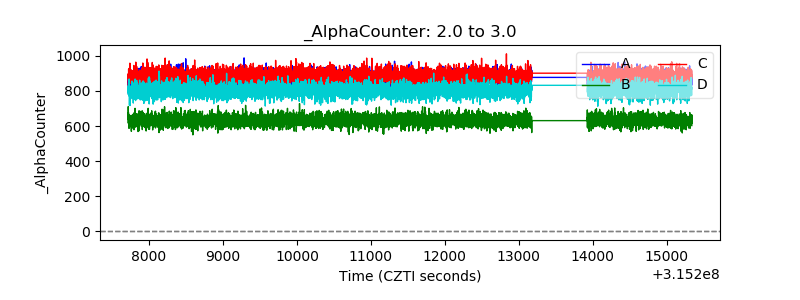 |
| _CPM_Rate | 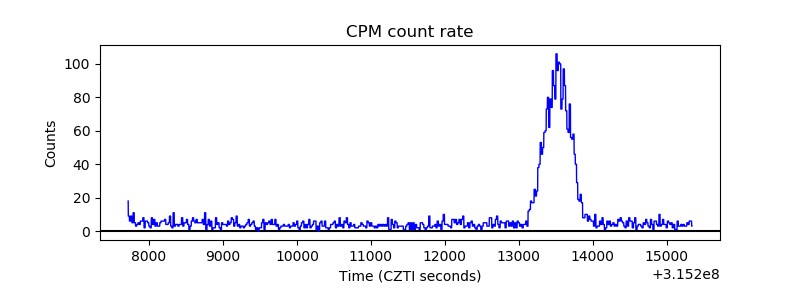 |
| CZT Counter | 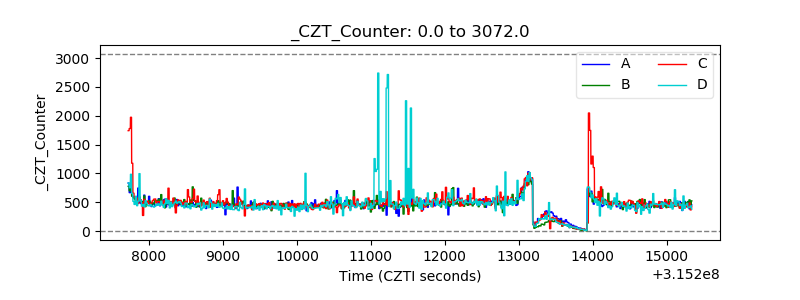 |
| +2.5 Volts monitor | 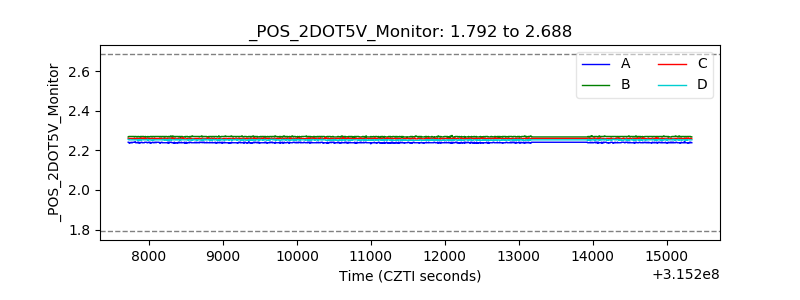 |
| +5 Volts monitor |  |
| _ROLL_ROT | 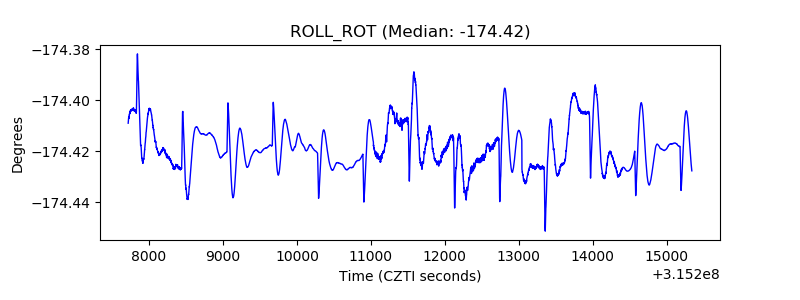 |
| _Roll_DEC | 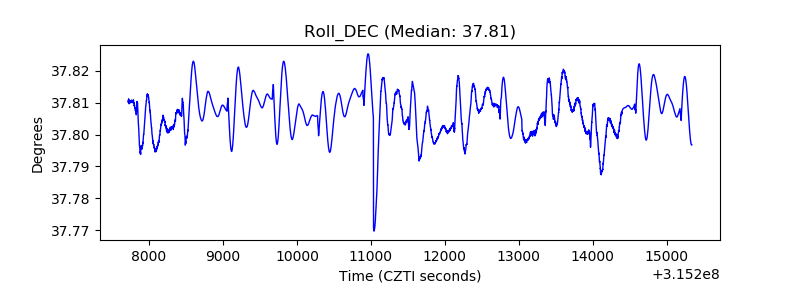 |
| _Roll_RA | 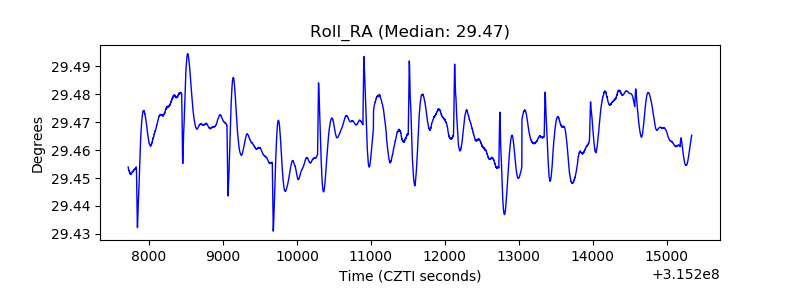 |
| Veto Counter | 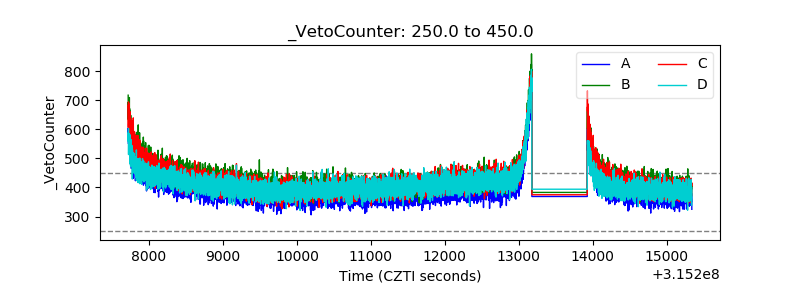 |