| Param | Original file | Final file |
|---|---|---|
| Filename | modeM0/AS1A07_062T01_9000003392_22975cztM0_level2.evt | modeM0/AS1A07_062T01_9000003392_22975cztM0_level2_quad_clean.evt |
| Size (bytes) | 572,794,560 | 107,038,080 |
| Size | 546.3 MB | 102.1 MB |
| Events in quadrant A | 3,994,546 | 681,149 |
| Events in quadrant B | 4,087,654 | 683,526 |
| Events in quadrant C | 4,197,939 | 652,098 |
| Events in quadrant D | 4,499,478 | 644,090 |
| Mode M9 | |||
|---|---|---|---|
| Quadrant | BADHDUFLAG | Total packets | Discarded packets |
| A | 0 | 11 | 0 |
| B | 0 | 11 | 0 |
| C | 0 | 11 | 0 |
| D | 0 | 11 | 0 |
| Mode SS | |||
|---|---|---|---|
| Quadrant | BADHDUFLAG | Total packets | Discarded packets |
| A | 0 | 170 | 0 |
| B | 0 | 170 | 0 |
| C | 0 | 170 | 0 |
| D | 0 | 170 | 0 |
| Mode M0 | |||
|---|---|---|---|
| Quadrant | BADHDUFLAG | Total packets | Discarded packets |
| A | 0 | 17226 | 3 |
| B | 0 | 17420 | 3 |
| C | 0 | 17795 | 3 |
| D | 0 | 18984 | 3 |
| Quadrant | Total seconds | Saturated seconds | Saturation percentage |
|---|---|---|---|
| A | 8364 | 183 | 2.187948% |
| B | 8365 | 217 | 2.594142% |
| C | 8365 | 277 | 3.311417% |
| D | 8365 | 186 | 2.223551% |
Noise dominated data is calculated using 1-second bins in cleaned event files. If a bin has >2000 counts, and if more than 50% of those come from <1% of pixels, then it is considered to be noise-dominated and hence unusable.
| Quadrant | # 1 sec bins | Bins with >0 counts | Bins with >2000 counts | High rate bins dominated by noise | Noise dominated (total time) | Noise dominated (detector-on time) | Marked lightcurve |
|---|---|---|---|---|---|---|---|
| A | 9449 | 8367 | 0 | 0 | 0.00% | 0.00% | 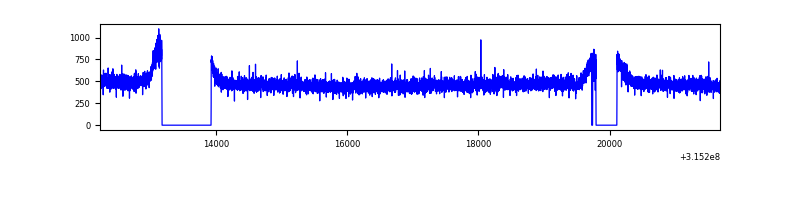 |
| B | 9450 | 8368 | 0 | 0 | 0.00% | 0.00% | 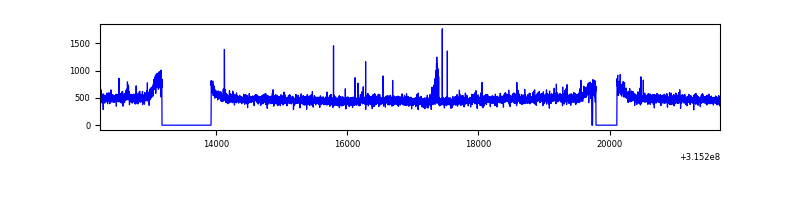 |
| C | 9450 | 8368 | 7 | 7 | 0.07% | 0.08% | 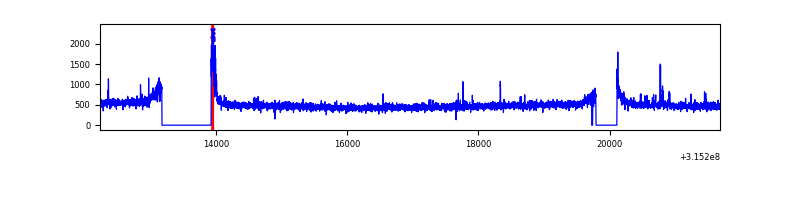 |
| D | 9450 | 8368 | 52 | 52 | 0.55% | 0.62% | 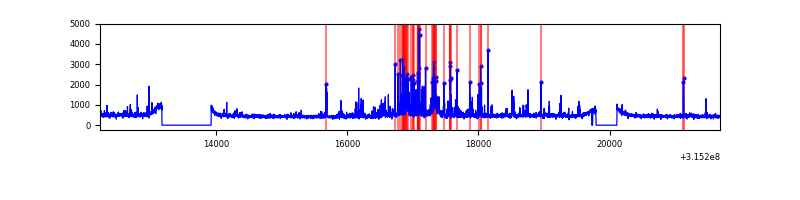 |
Top three noisy pixels from each quadrant. If the there are fewer than three noisy pixels in the level2.evt file, extra rows are filled as -1
| Pixel properties | Quadrant properties | ||||||
|---|---|---|---|---|---|---|---|
| Quadrant | DetID | PixID | Counts | Sigma | Mean | Median | Sigma |
| A | 13 | 170 | 27921 | 129.33 | 1027 | 1001 | 208.1 |
| A | 13 | 254 | 13657 | 60.8 | 1027 | 1001 | 208.1 |
| A | 3 | 137 | 9027 | 38.56 | 1027 | 1001 | 208.1 |
| B | 0 | 190 | 33554 | 164.78 | 1025 | 998 | 197.6 |
| B | 12 | 111 | 24085 | 116.86 | 1025 | 998 | 197.6 |
| B | 11 | 111 | 21457 | 103.55 | 1025 | 998 | 197.6 |
| C | 14 | 238 | 155059 | 667.74 | 984 | 990 | 230.7 |
| C | 0 | 10 | 142862 | 614.88 | 984 | 990 | 230.7 |
| C | 0 | 239 | 31811 | 133.58 | 984 | 990 | 230.7 |
| D | 1 | 52 | 212588 | 860.74 | 1003 | 971 | 245.9 |
| D | 12 | 233 | 167673 | 678.05 | 1003 | 971 | 245.9 |
| D | 13 | 153 | 108676 | 438.08 | 1003 | 971 | 245.9 |
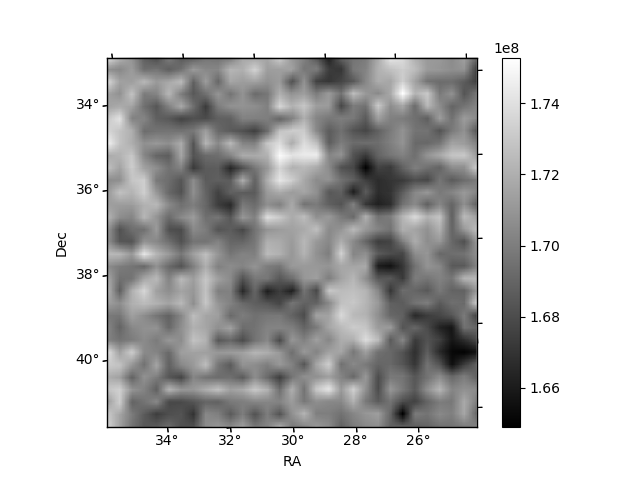
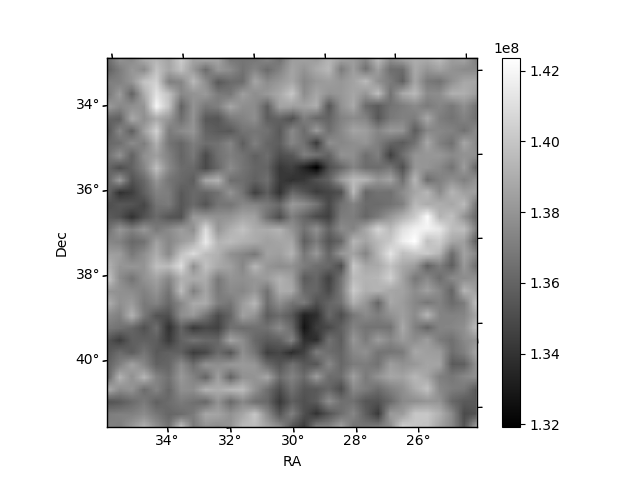
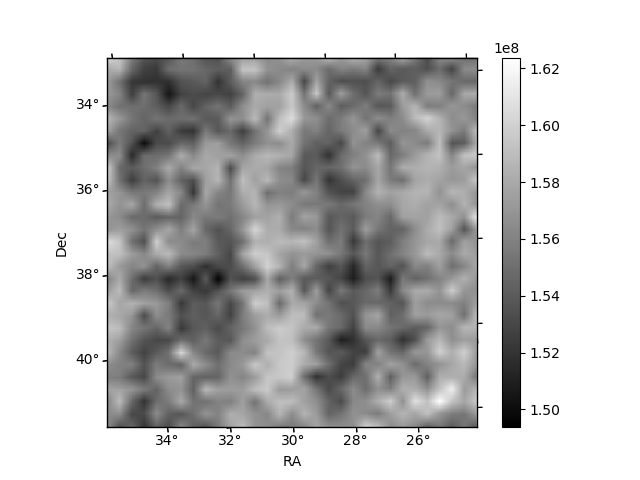
Histogram calculated using DETX and DETY for each event in the final _common_clean file
| Quadrant A | 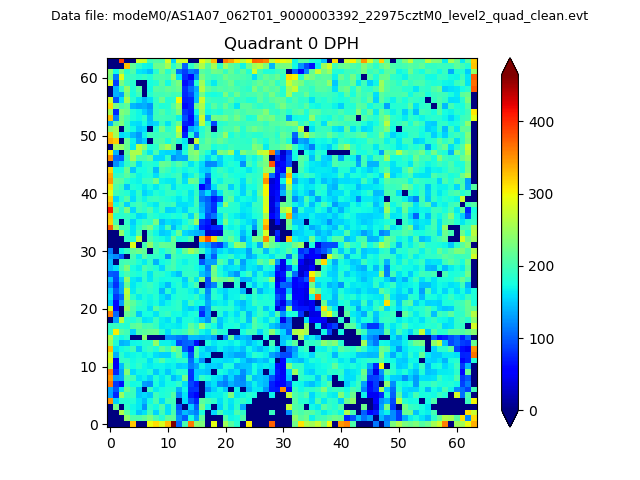 |
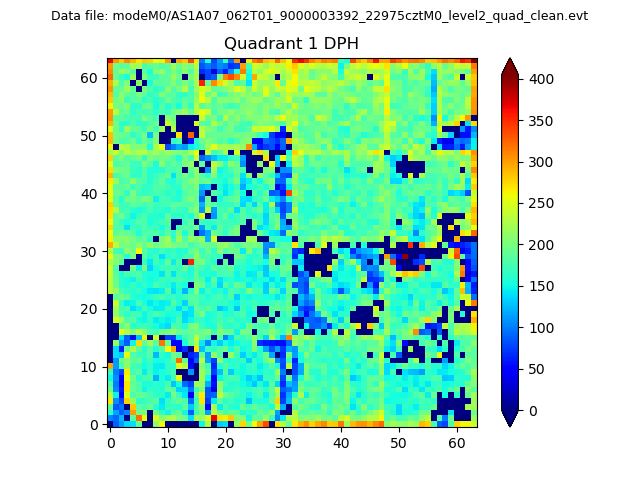 |
Quadrant B |
|---|---|---|---|
| Quadrant D |  |
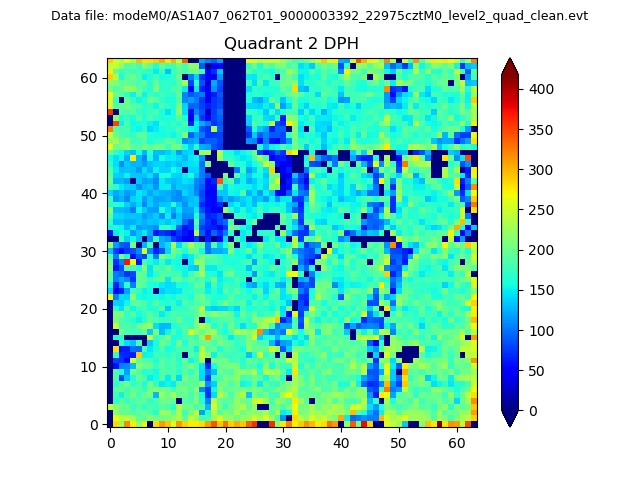 |
Quadrant C |
| Plot type | Count rate plots | Images |
|---|---|---|
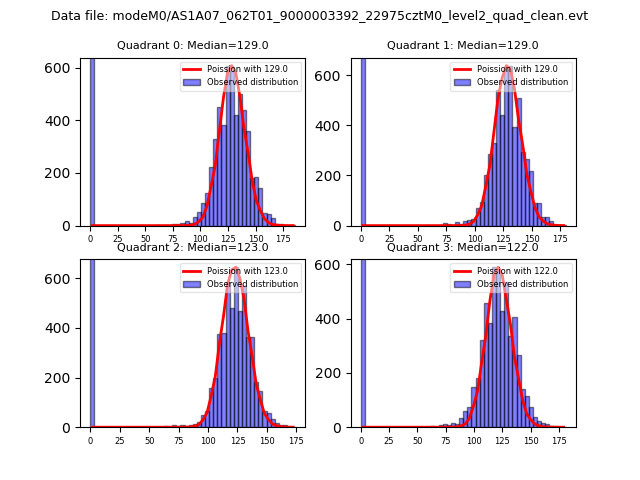
| Comparison with Poisson distribution Blue bars denote a histogram of data divided into 1 sec bins. Red curve is a Poisson curve with rate = median count rate of data. |
 |
 |
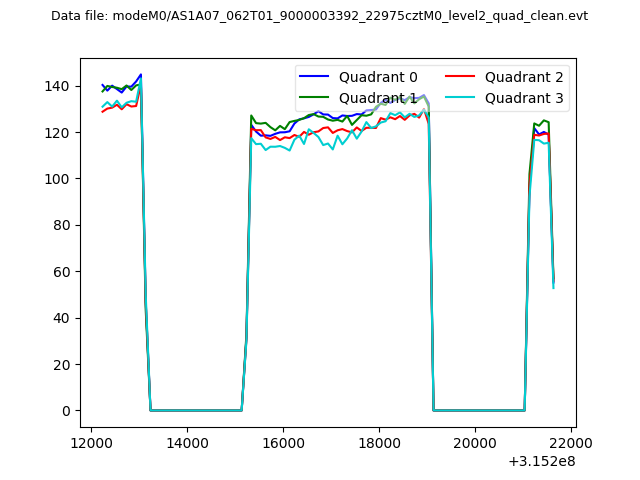
| Quadrant-wise count rates Data is divided into 100 sec bins |
 |
|
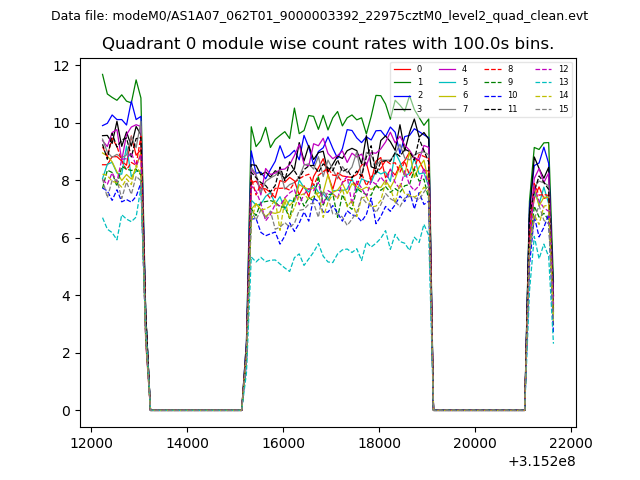
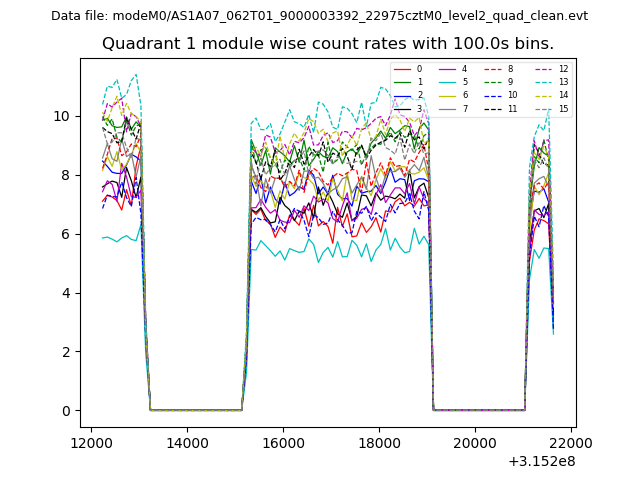
| Module-wise count rates for Quadrant A Data is divided into 100 sec bins |
 |
 |
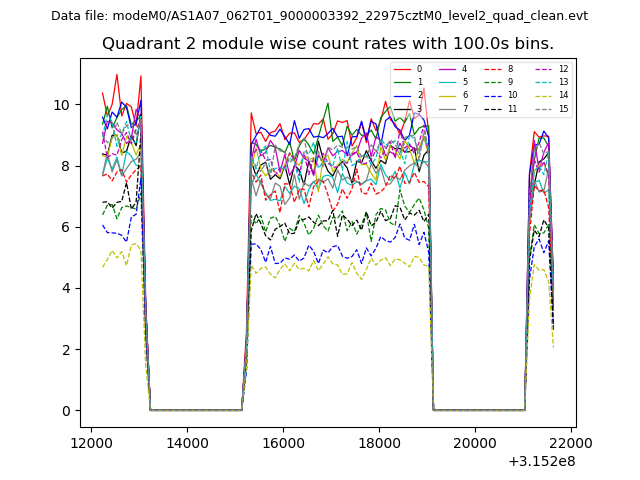
| Module-wise count rates for Quadrant B Data is divided into 100 sec bins |
 |
 |
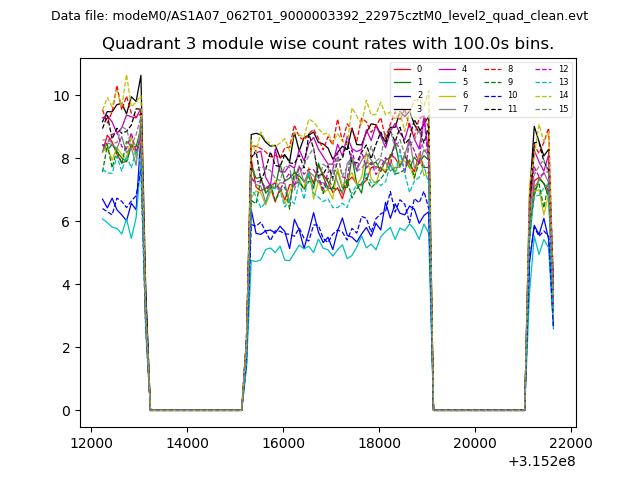
| Module-wise count rates for Quadrant C Data is divided into 100 sec bins |
 |
 |
| Module-wise count rates for Quadrant D Data is divided into 100 sec bins |
 |
 |
| Parameter | Plot |
|---|---|
| CZT HV Monitor |  |
| D_VDD | 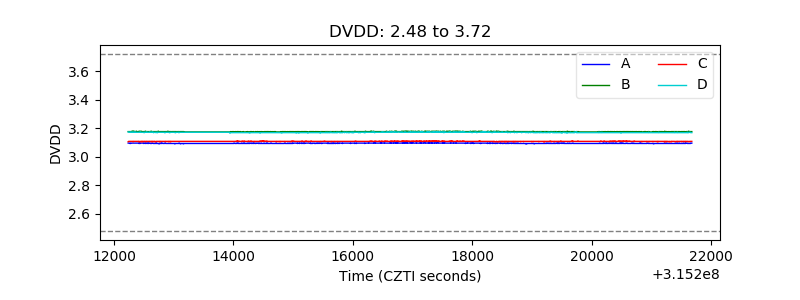 |
| Temperature 1 | 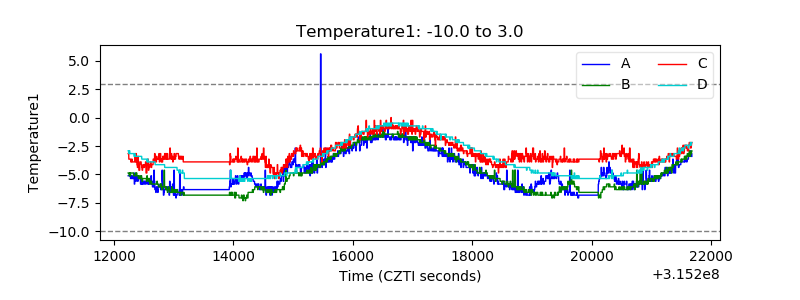 |
| Veto HV Monitor | 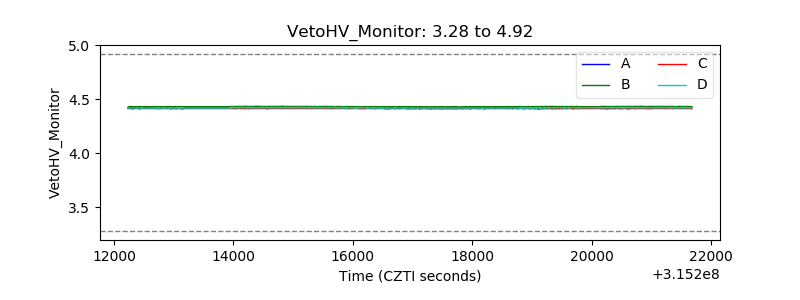 |
| Veto LLD |  |
| Alpha Counter | 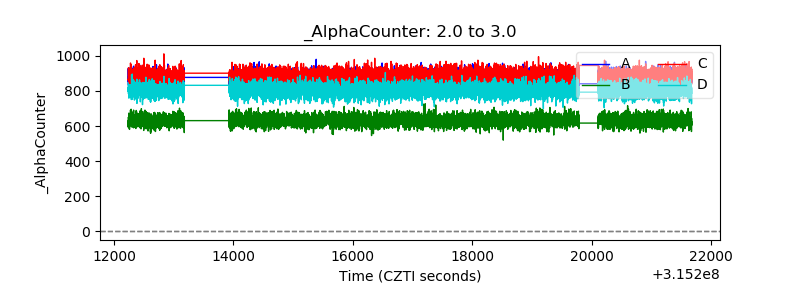 |
| _CPM_Rate | 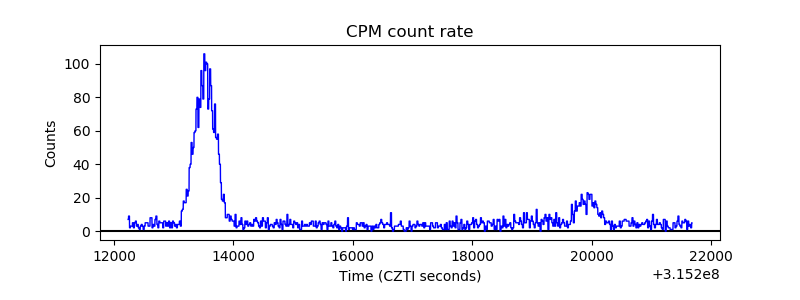 |
| CZT Counter | 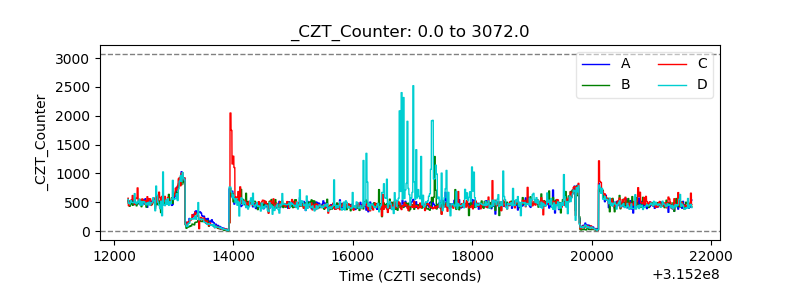 |
| +2.5 Volts monitor |  |
| +5 Volts monitor | 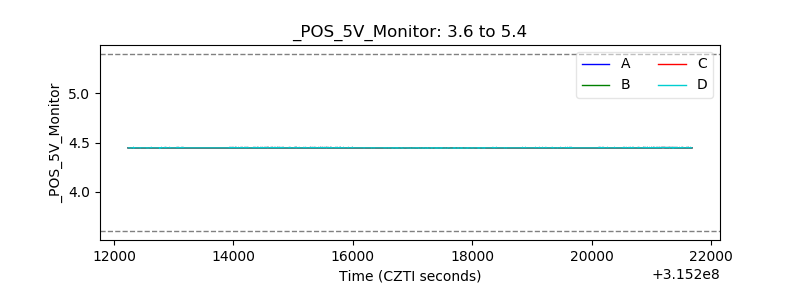 |
| _ROLL_ROT | 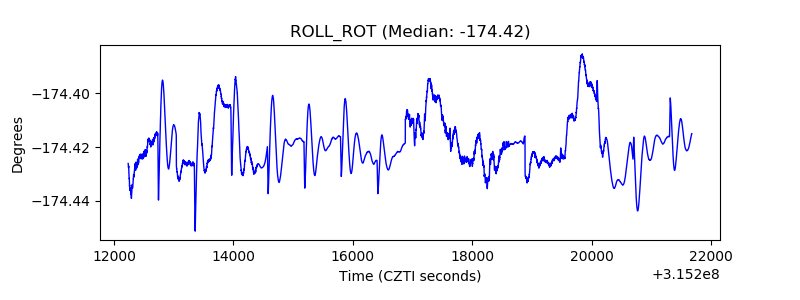 |
| _Roll_DEC | 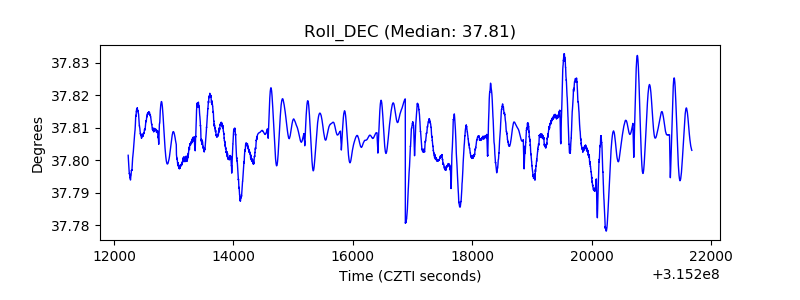 |
| _Roll_RA | 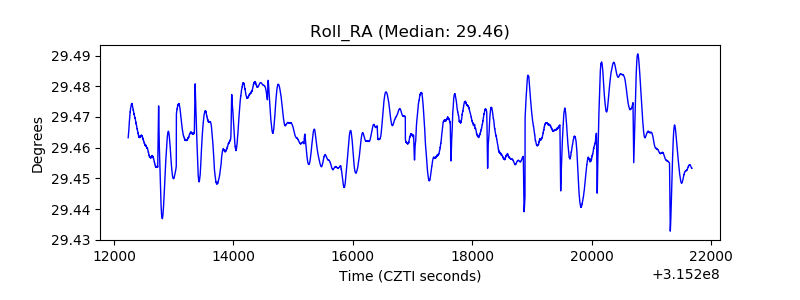 |
| Veto Counter |  |