| Param | Original file | Final file |
|---|---|---|
| Filename | modeM0/AS1A07_062T01_9000003392_22976cztM0_level2.evt | modeM0/AS1A07_062T01_9000003392_22976cztM0_level2_quad_clean.evt |
| Size (bytes) | 300,055,680 | 66,697,920 |
| Size | 286.2 MB | 63.6 MB |
| Events in quadrant A | 2,010,525 | 440,372 |
| Events in quadrant B | 2,108,475 | 438,629 |
| Events in quadrant C | 2,035,006 | 420,094 |
| Events in quadrant D | 2,629,453 | 407,721 |
| Mode SS | |||
|---|---|---|---|
| Quadrant | BADHDUFLAG | Total packets | Discarded packets |
| A | 0 | 90 | 0 |
| B | 0 | 90 | 0 |
| C | 0 | 90 | 0 |
| D | 0 | 90 | 0 |
| Mode M0 | |||
|---|---|---|---|
| Quadrant | BADHDUFLAG | Total packets | Discarded packets |
| A | 0 | 8917 | 0 |
| B | 0 | 9079 | 0 |
| C | 0 | 9033 | 0 |
| D | 0 | 10853 | 0 |
| Quadrant | Total seconds | Saturated seconds | Saturation percentage |
|---|---|---|---|
| A | 4444 | 4 | 0.090009% |
| B | 4444 | 4 | 0.090009% |
| C | 4444 | 17 | 0.382538% |
| D | 4444 | 135 | 3.037804% |
Noise dominated data is calculated using 1-second bins in cleaned event files. If a bin has >2000 counts, and if more than 50% of those come from <1% of pixels, then it is considered to be noise-dominated and hence unusable.
| Quadrant | # 1 sec bins | Bins with >0 counts | Bins with >2000 counts | High rate bins dominated by noise | Noise dominated (total time) | Noise dominated (detector-on time) | Marked lightcurve |
|---|---|---|---|---|---|---|---|
| A | 4444 | 4444 | 0 | 0 | 0.00% | 0.00% | 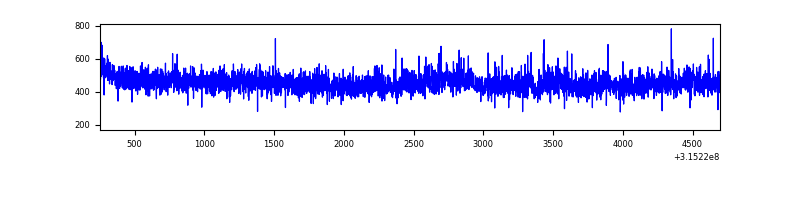 |
| B | 4444 | 4444 | 0 | 0 | 0.00% | 0.00% | 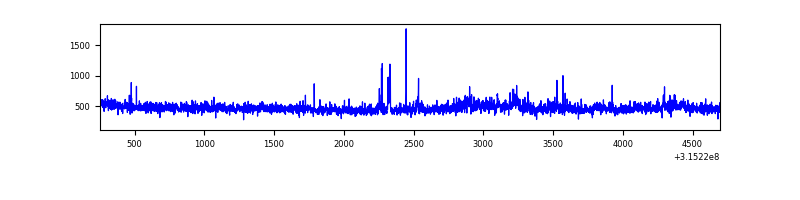 |
| C | 4444 | 4444 | 3 | 3 | 0.07% | 0.07% | 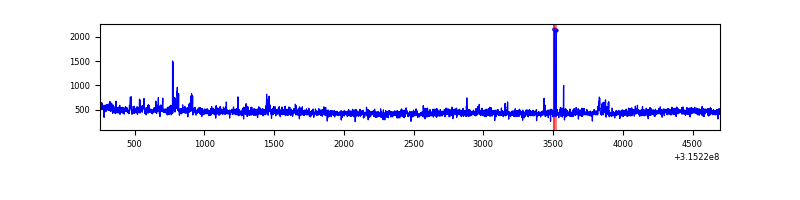 |
| D | 4444 | 4444 | 120 | 120 | 2.70% | 2.70% | 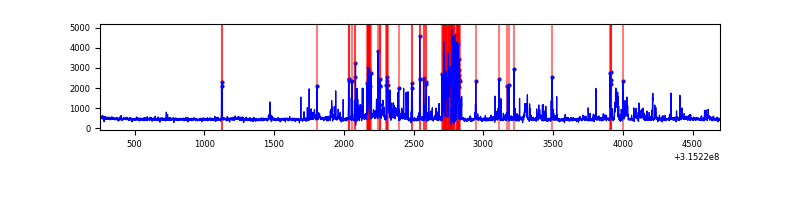 |
Top three noisy pixels from each quadrant. If the there are fewer than three noisy pixels in the level2.evt file, extra rows are filled as -1
| Pixel properties | Quadrant properties | ||||||
|---|---|---|---|---|---|---|---|
| Quadrant | DetID | PixID | Counts | Sigma | Mean | Median | Sigma |
| A | 13 | 170 | 37028 | 351.93 | 511 | 499 | 103.8 |
| A | 13 | 254 | 6834 | 61.03 | 511 | 499 | 103.8 |
| A | 0 | 226 | 4365 | 37.25 | 511 | 499 | 103.8 |
| B | 3 | 209 | 54051 | 543.62 | 506 | 493 | 98.5 |
| B | 0 | 189 | 37591 | 376.55 | 506 | 493 | 98.5 |
| B | 0 | 190 | 30343 | 302.98 | 506 | 493 | 98.5 |
| C | 14 | 238 | 76974 | 665.95 | 485 | 487 | 114.9 |
| C | 0 | 239 | 32910 | 282.3 | 485 | 487 | 114.9 |
| C | 8 | 208 | 15315 | 129.1 | 485 | 487 | 114.9 |
| D | 1 | 52 | 321171 | 2656.33 | 490 | 475 | 120.7 |
| D | 13 | 153 | 292775 | 2421.12 | 490 | 475 | 120.7 |
| D | 12 | 233 | 75181 | 618.79 | 490 | 475 | 120.7 |
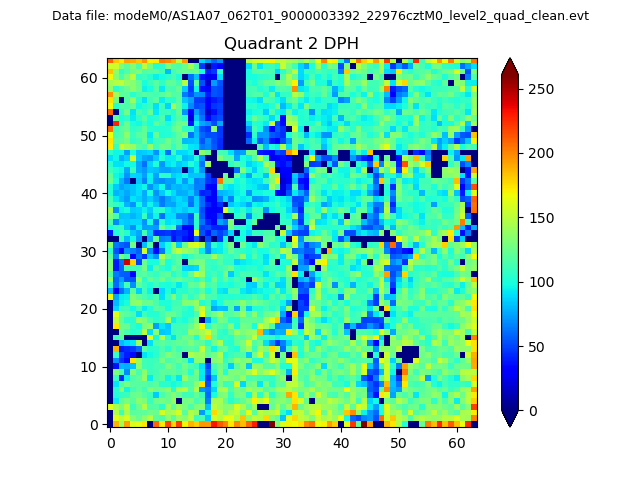
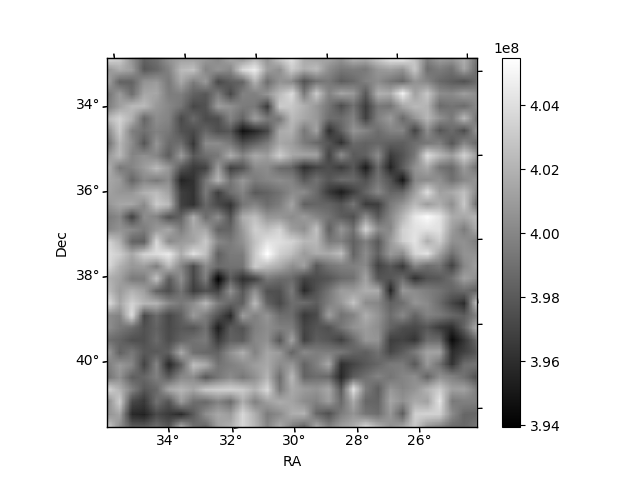
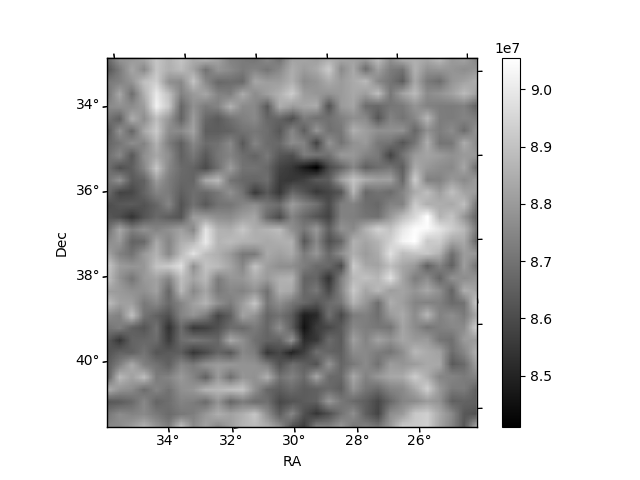
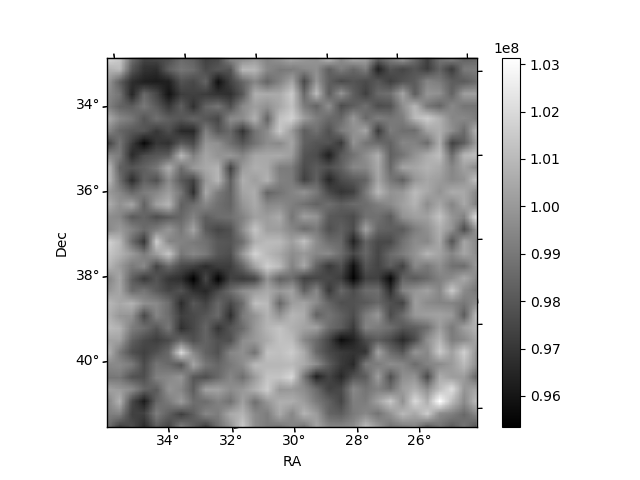
Histogram calculated using DETX and DETY for each event in the final _common_clean file
| Quadrant A | 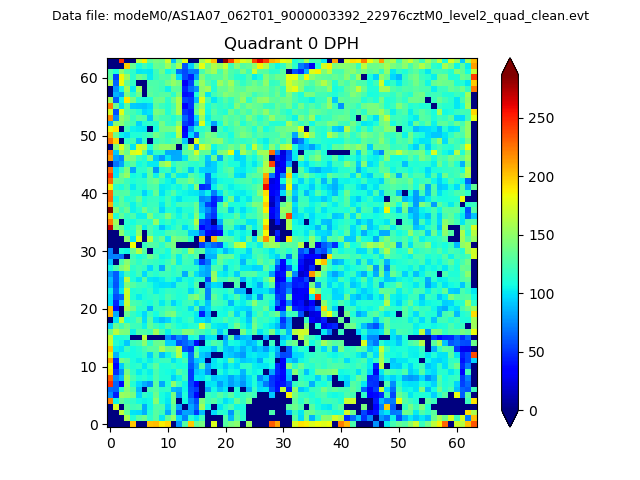 |
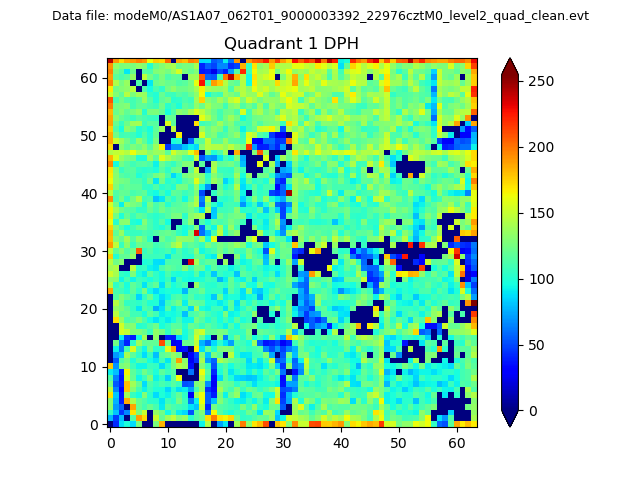 |
Quadrant B |
|---|---|---|---|
| Quadrant D | 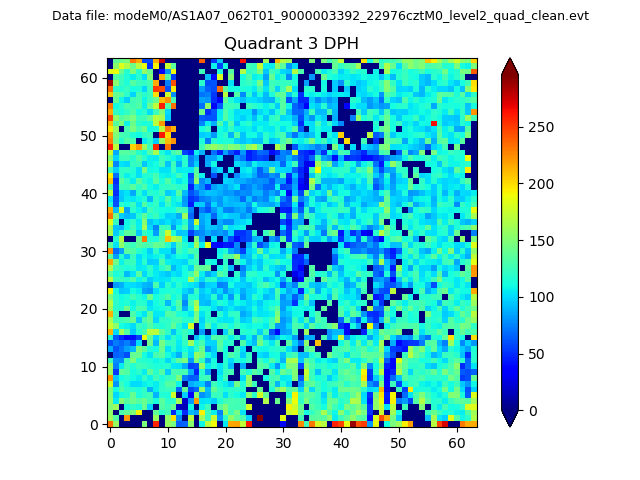 |
 |
Quadrant C |
| Plot type | Count rate plots | Images |
|---|---|---|
| Comparison with Poisson distribution Blue bars denote a histogram of data divided into 1 sec bins. Red curve is a Poisson curve with rate = median count rate of data. |
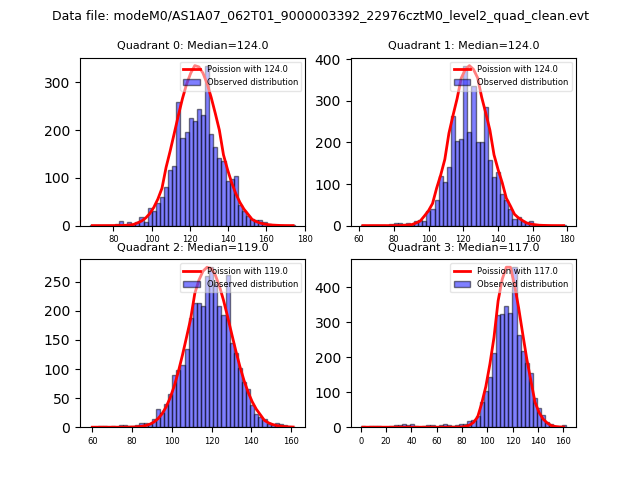 |
 |
| Quadrant-wise count rates Data is divided into 100 sec bins |
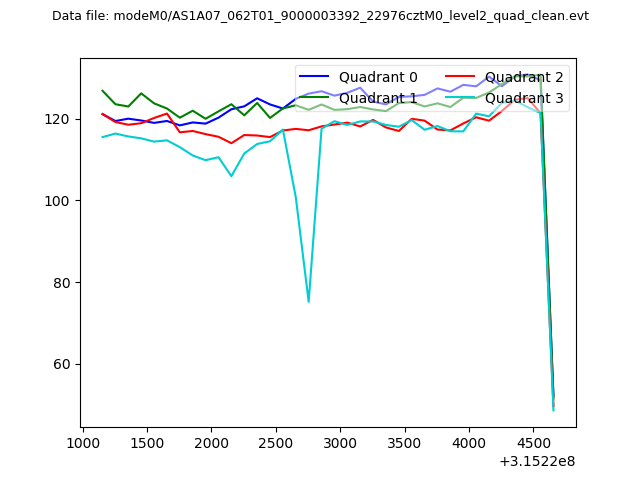 |
|
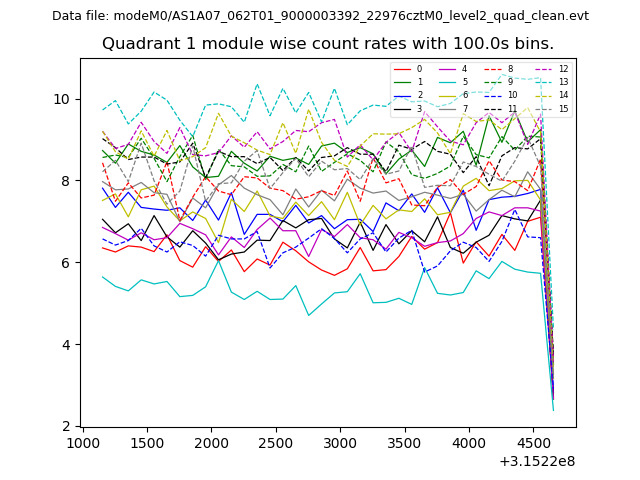
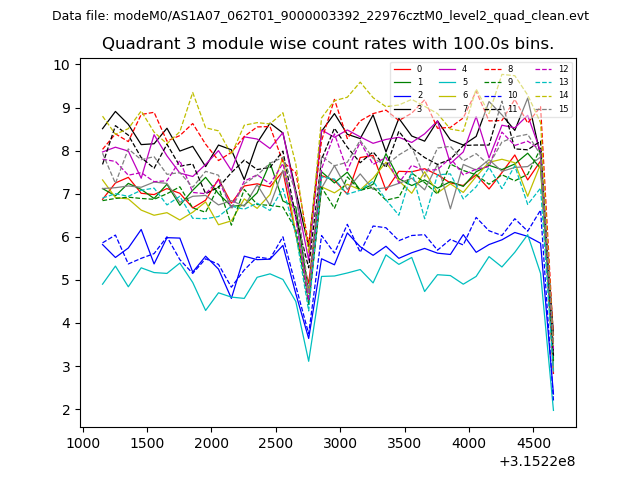
| Module-wise count rates for Quadrant A Data is divided into 100 sec bins |
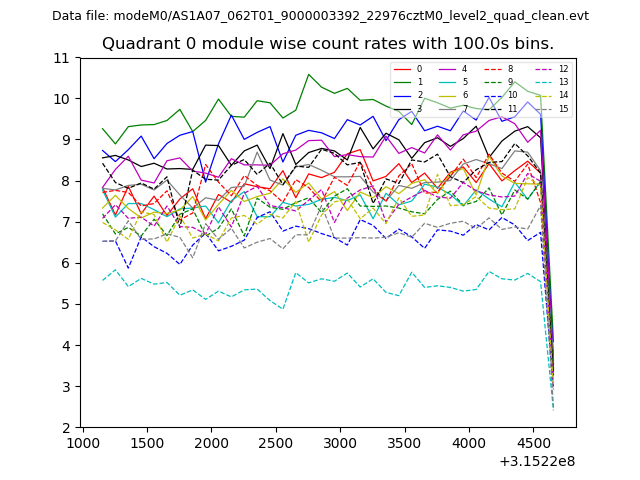 |
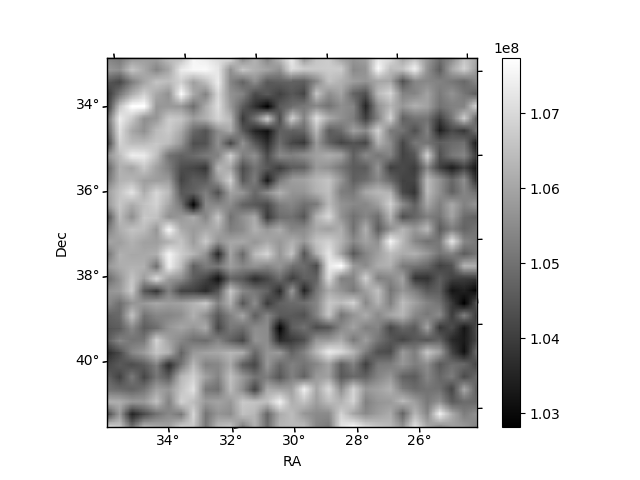 |
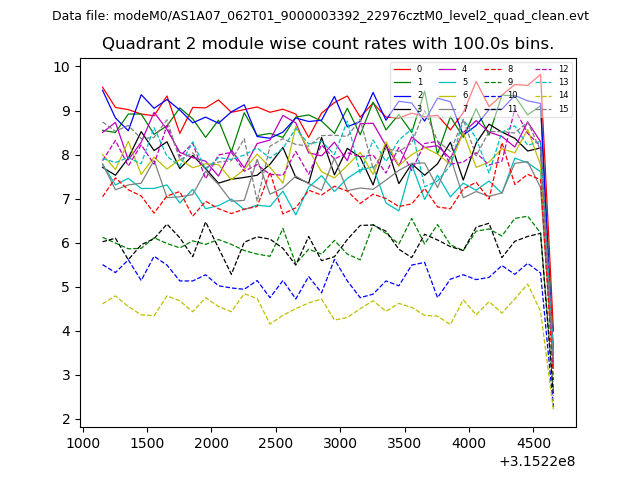
| Module-wise count rates for Quadrant B Data is divided into 100 sec bins |
 |
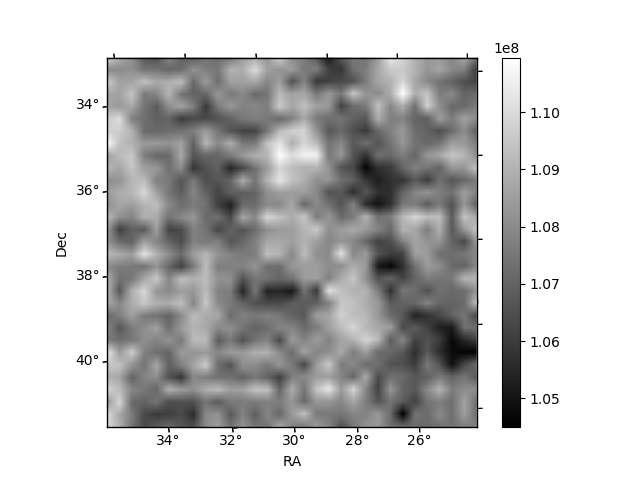 |
| Module-wise count rates for Quadrant C Data is divided into 100 sec bins |
 |
 |
| Module-wise count rates for Quadrant D Data is divided into 100 sec bins |
 |
 |
| Parameter | Plot |
|---|---|
| CZT HV Monitor | 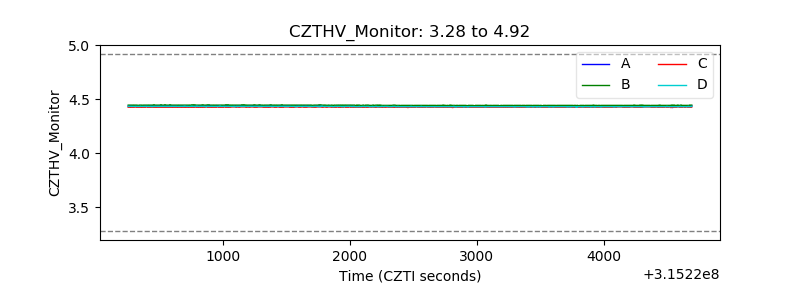 |
| D_VDD | 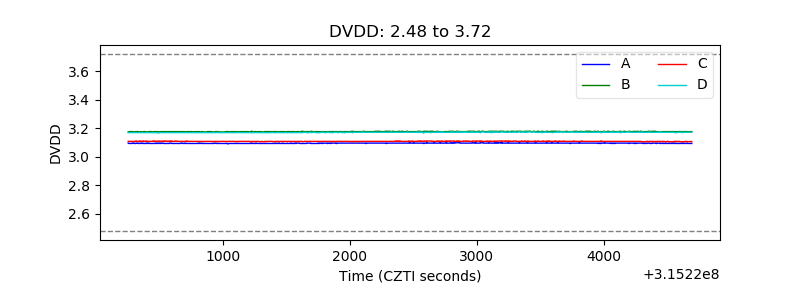 |
| Temperature 1 | 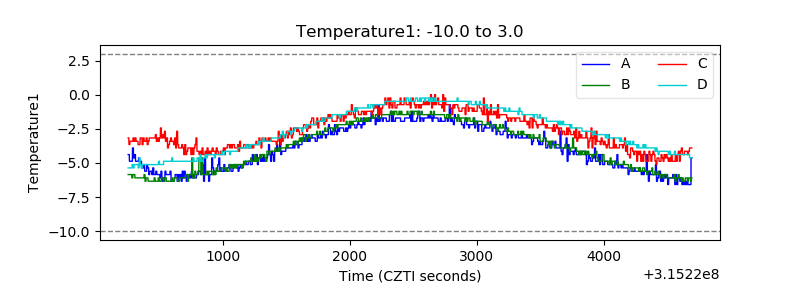 |
| Veto HV Monitor | 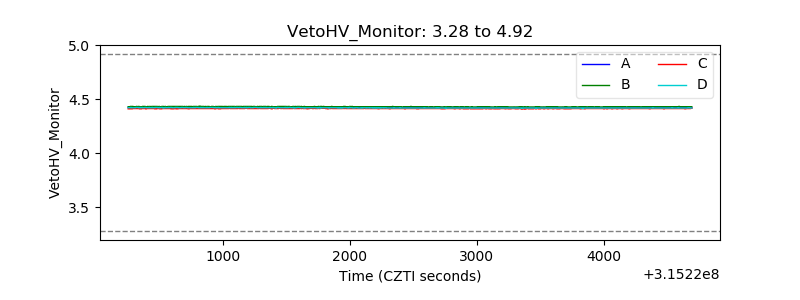 |
| Veto LLD | 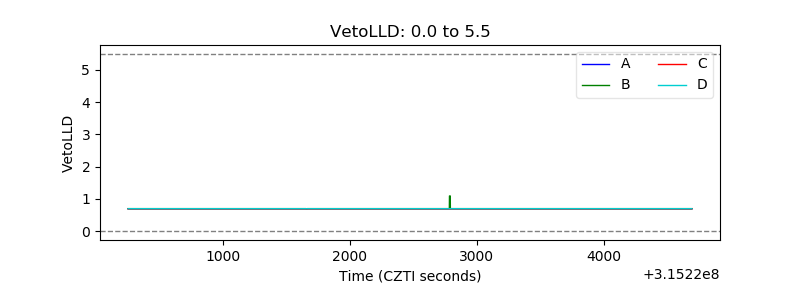 |
| Alpha Counter | 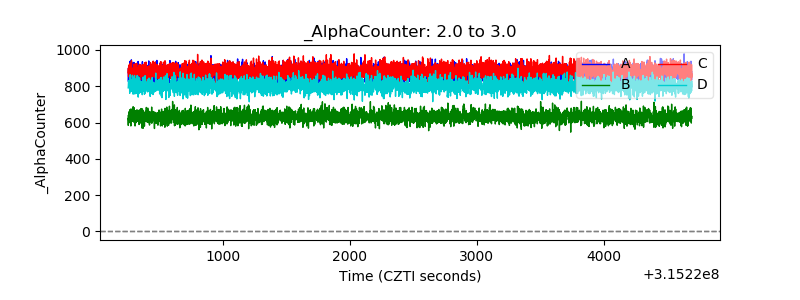 |
| _CPM_Rate | 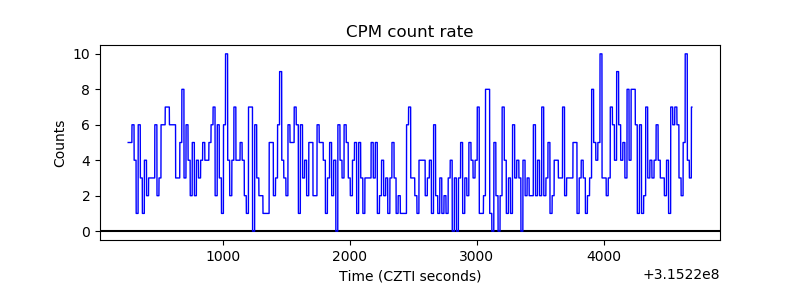 |
| CZT Counter | 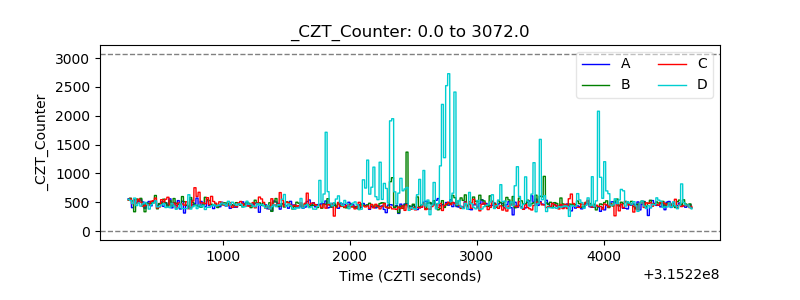 |
| +2.5 Volts monitor |  |
| +5 Volts monitor |  |
| _ROLL_ROT | 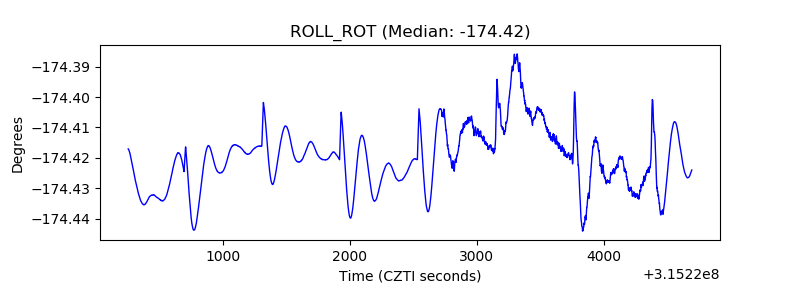 |
| _Roll_DEC | 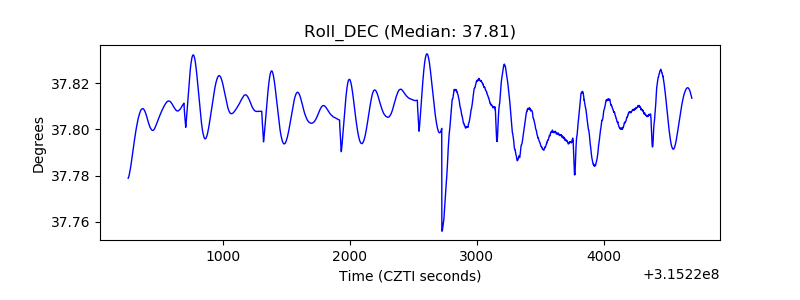 |
| _Roll_RA | 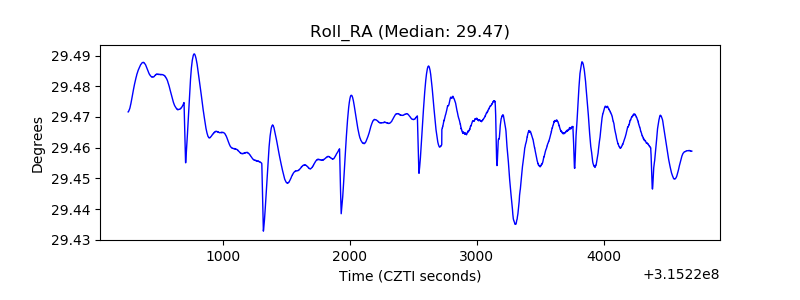 |
| Veto Counter | 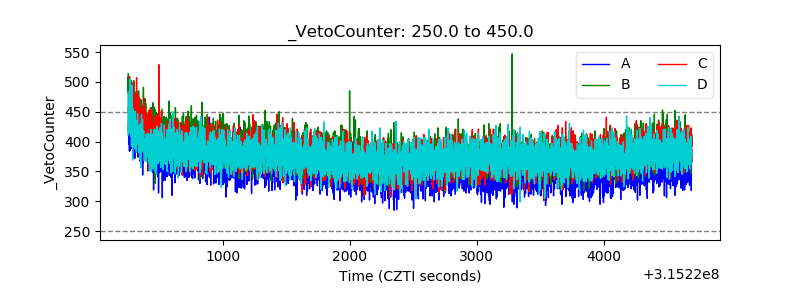 |