| Param | Original file | Final file |
|---|---|---|
| Filename | modeM0/AS1A07_047T09_9000003396cztM0_level2.fits | modeM0/AS1A07_047T09_9000003396cztM0_level2_quad_clean.evt |
| Size (bytes) | 282,009,600 | 207,457,920 |
| Size | 268.9 MB | 197.8 MB |
| Events in quadrant A | 1,769,986 | 1,157,332 |
| Events in quadrant B | 1,702,506 | 1,177,533 |
| Events in quadrant C | 1,760,262 | 1,131,248 |
| Events in quadrant D | 1,490,654 | 997,176 |
| Mode SS | |||
|---|---|---|---|
| Quadrant | BADHDUFLAG | Total packets | Discarded packets |
| A | 0 | 538 | 0 |
| B | 0 | 538 | 0 |
| C | 0 | 538 | 0 |
| D | 0 | 538 | 0 |
| Mode M0 | |||
|---|---|---|---|
| Quadrant | BADHDUFLAG | Total packets | Discarded packets |
| A | 0 | 54865 | 0 |
| B | 0 | 57152 | 0 |
| C | 0 | 55568 | 0 |
| D | 0 | 71357 | 0 |
| Mode M9 | |||
|---|---|---|---|
| Quadrant | BADHDUFLAG | Total packets | Discarded packets |
| A | 0 | 63 | 0 |
| B | 0 | 63 | 0 |
| C | 0 | 63 | 0 |
| D | 0 | 63 | 0 |
| Quadrant | Total seconds | Saturated seconds | Saturation percentage |
|---|---|---|---|
| A | 26433 | 175 | 0.662051% |
| B | 26433 | 297 | 1.123596% |
| C | 26433 | 373 | 1.411115% |
| D | 26433 | 1131 | 4.278742% |
Noise dominated data is calculated using 1-second bins in cleaned event files. If a bin has >2000 counts, and if more than 50% of those come from <1% of pixels, then it is considered to be noise-dominated and hence unusable.
| Quadrant | # 1 sec bins | Bins with >0 counts | Bins with >2000 counts | High rate bins dominated by noise | Noise dominated (total time) | Noise dominated (detector-on time) | Marked lightcurve |
|---|---|---|---|---|---|---|---|
| A | 32763 | 26433 | 0 | 0 | 0.00% | 0.00% |  |
| B | 32763 | 26434 | 0 | 0 | 0.00% | 0.00% |  |
| C | 32763 | 26433 | 0 | 0 | 0.00% | 0.00% |  |
| D | 32763 | 26413 | 0 | 0 | 0.00% | 0.00% |  |
Top three noisy pixels from each quadrant. If the there are fewer than three noisy pixels in the level2.evt file, extra rows are filled as -1
| Pixel properties | Quadrant properties | ||||||
|---|---|---|---|---|---|---|---|
| Quadrant | DetID | PixID | Counts | Sigma | Mean | Median | Sigma |
| A | 0 | 29 | 1616 | 10.45 | 461 | 438 | 112.7 |
| A | 7 | 110 | 1423 | 8.74 | 461 | 438 | 112.7 |
| A | 9 | 19 | 1293 | 7.59 | 461 | 438 | 112.7 |
| B | 2 | 9 | 1317 | 9.88 | 452 | 437 | 89.0 |
| B | 2 | 8 | 1144 | 7.94 | 452 | 437 | 89.0 |
| B | 3 | 80 | 1121 | 7.68 | 452 | 437 | 89.0 |
| C | 1 | 80 | 1311 | 7.41 | 464 | 441 | 117.5 |
| C | 1 | 81 | 1311 | 7.41 | 464 | 441 | 117.5 |
| C | 12 | 241 | 1213 | 6.57 | 464 | 441 | 117.5 |
| D | 10 | 189 | 1089 | 6.12 | 427 | 393 | 113.8 |
| D | 7 | 3 | 1059 | 5.85 | 427 | 393 | 113.8 |
| D | 10 | 113 | 1051 | 5.78 | 427 | 393 | 113.8 |
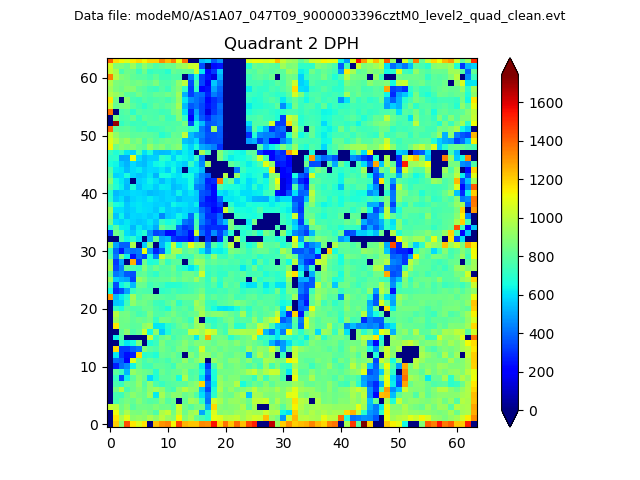
Histogram calculated using DETX and DETY for each event in the final _common_clean file
| Quadrant A |  |
 |
Quadrant B |
|---|---|---|---|
| Quadrant D |  |
 |
Quadrant C |
| Plot type | Count rate plots | Images |
|---|---|---|
| Comparison with Poisson distribution Blue bars denote a histogram of data divided into 1 sec bins. Red curve is a Poisson curve with rate = median count rate of data. |
 |
 |
| Quadrant-wise count rates Data is divided into 100 sec bins |
 |
|
| Module-wise count rates for Quadrant A Data is divided into 100 sec bins |
 |
 |
| Module-wise count rates for Quadrant B Data is divided into 100 sec bins |
 |
 |
| Module-wise count rates for Quadrant C Data is divided into 100 sec bins |
 |
 |
| Module-wise count rates for Quadrant D Data is divided into 100 sec bins |
 |
 |
| Parameter | Plot |
|---|---|
| CZT HV Monitor |  |
| D_VDD |  |
| Temperature 1 |  |
| Veto HV Monitor |  |
| Veto LLD |  |
| Alpha Counter | 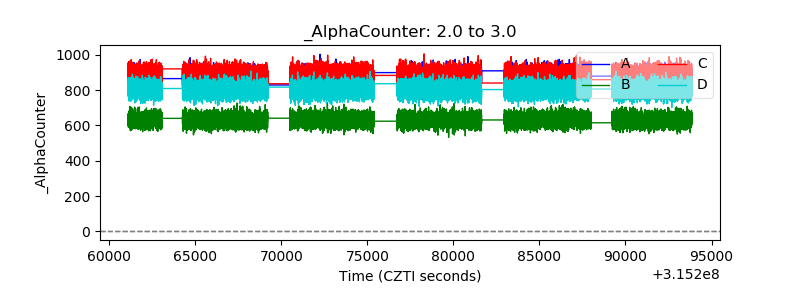 |
| _CPM_Rate |  |
| CZT Counter |  |
| +2.5 Volts monitor |  |
| +5 Volts monitor |  |
| _ROLL_ROT |  |
| _Roll_DEC |  |
| _Roll_RA |  |
| Veto Counter |  |