| Param | Original file | Final file |
|---|---|---|
| Filename | modeM0/AS1A07_047T09_9000003396_22983cztM0_level2.evt | modeM0/AS1A07_047T09_9000003396_22983cztM0_level2_quad_clean.evt |
| Size (bytes) | 246,934,080 | 58,988,160 |
| Size | 235.5 MB | 56.3 MB |
| Events in quadrant A | 1,594,241 | 395,676 |
| Events in quadrant B | 1,659,721 | 408,044 |
| Events in quadrant C | 1,624,630 | 390,732 |
| Events in quadrant D | 2,384,464 | 367,863 |
| Mode SS | |||
|---|---|---|---|
| Quadrant | BADHDUFLAG | Total packets | Discarded packets |
| A | 0 | 64 | 0 |
| B | 0 | 64 | 0 |
| C | 0 | 64 | 0 |
| D | 0 | 64 | 0 |
| Mode M0 | |||
|---|---|---|---|
| Quadrant | BADHDUFLAG | Total packets | Discarded packets |
| A | 0 | 6602 | 1 |
| B | 0 | 6784 | 2 |
| C | 0 | 6617 | 1 |
| D | 0 | 9118 | 1 |
| Mode M9 | |||
|---|---|---|---|
| Quadrant | BADHDUFLAG | Total packets | Discarded packets |
| A | 0 | 12 | 0 |
| B | 0 | 12 | 0 |
| C | 0 | 12 | 0 |
| D | 0 | 12 | 0 |
| Quadrant | Total seconds | Saturated seconds | Saturation percentage |
|---|---|---|---|
| A | 3150 | 21 | 0.666667% |
| B | 3149 | 32 | 1.016196% |
| C | 3149 | 36 | 1.143220% |
| D | 3149 | 243 | 7.716735% |
Noise dominated data is calculated using 1-second bins in cleaned event files. If a bin has >2000 counts, and if more than 50% of those come from <1% of pixels, then it is considered to be noise-dominated and hence unusable.
| Quadrant | # 1 sec bins | Bins with >0 counts | Bins with >2000 counts | High rate bins dominated by noise | Noise dominated (total time) | Noise dominated (detector-on time) | Marked lightcurve |
|---|---|---|---|---|---|---|---|
| A | 4335 | 3151 | 0 | 0 | 0.00% | 0.00% | 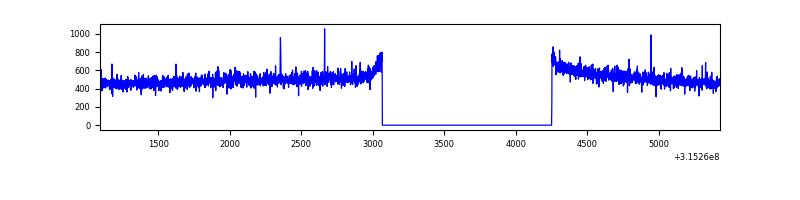 |
| B | 4334 | 3150 | 1 | 1 | 0.02% | 0.03% | 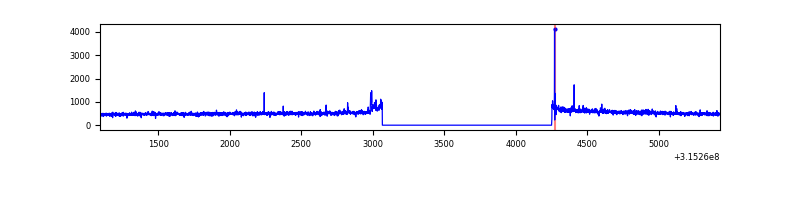 |
| C | 4334 | 3150 | 0 | 0 | 0.00% | 0.00% | 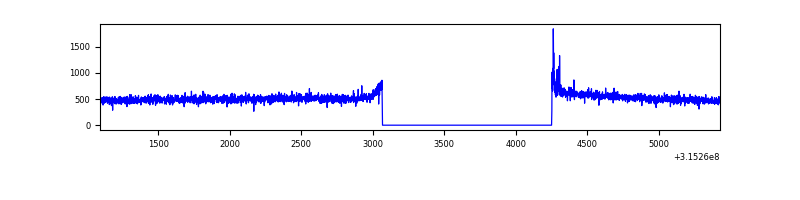 |
| D | 4334 | 3150 | 165 | 165 | 3.81% | 5.24% | 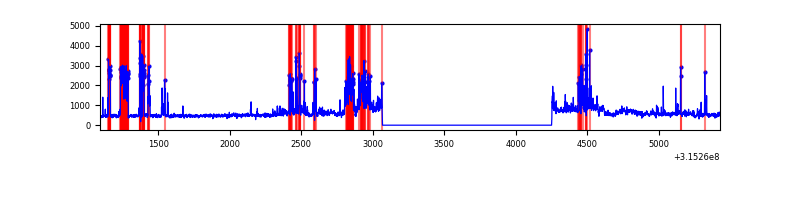 |
Top three noisy pixels from each quadrant. If the there are fewer than three noisy pixels in the level2.evt file, extra rows are filled as -1
| Pixel properties | Quadrant properties | ||||||
|---|---|---|---|---|---|---|---|
| Quadrant | DetID | PixID | Counts | Sigma | Mean | Median | Sigma |
| A | 13 | 254 | 5138 | 56.7 | 412 | 404 | 83.5 |
| A | 0 | 226 | 3598 | 38.25 | 412 | 404 | 83.5 |
| A | 3 | 137 | 3564 | 37.85 | 412 | 404 | 83.5 |
| B | 0 | 189 | 20243 | 250.38 | 412 | 403 | 79.2 |
| B | 0 | 190 | 17343 | 213.78 | 412 | 403 | 79.2 |
| B | 12 | 111 | 9029 | 108.86 | 412 | 403 | 79.2 |
| C | 14 | 238 | 63519 | 682.91 | 397 | 400 | 92.4 |
| C | 0 | 10 | 9911 | 102.9 | 397 | 400 | 92.4 |
| C | 7 | 247 | 3918 | 38.06 | 397 | 400 | 92.4 |
| D | 1 | 52 | 427075 | 4487.32 | 389 | 378 | 95.1 |
| D | 13 | 153 | 221961 | 2330.26 | 389 | 378 | 95.1 |
| D | 12 | 227 | 203515 | 2136.27 | 389 | 378 | 95.1 |
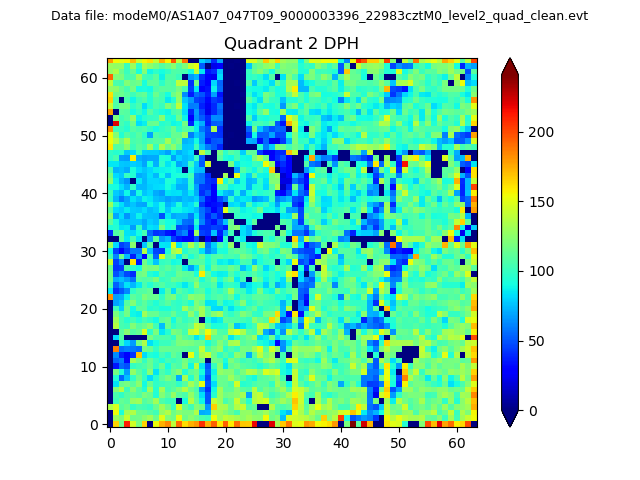
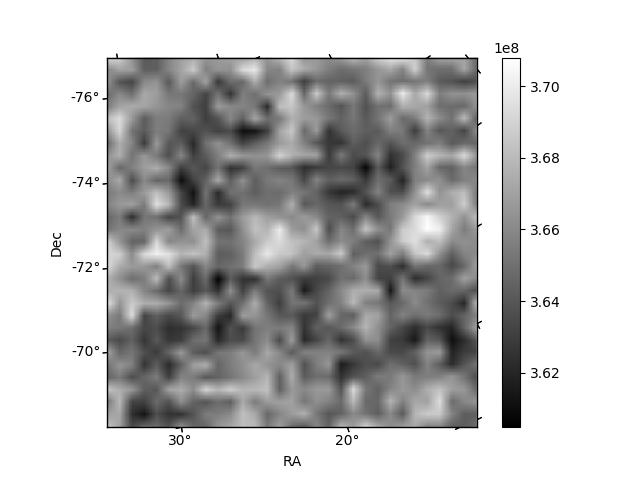
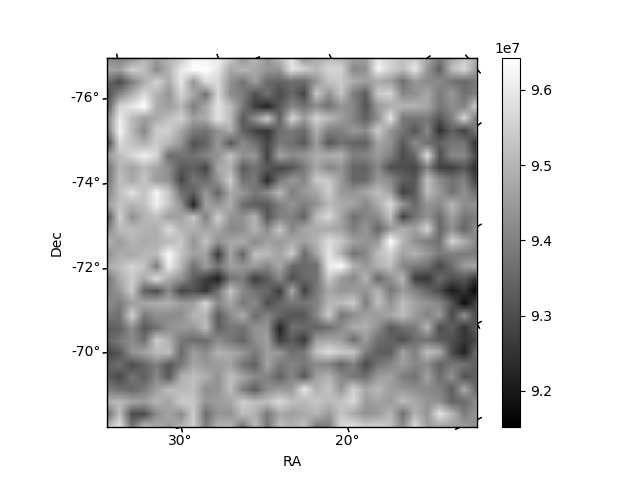
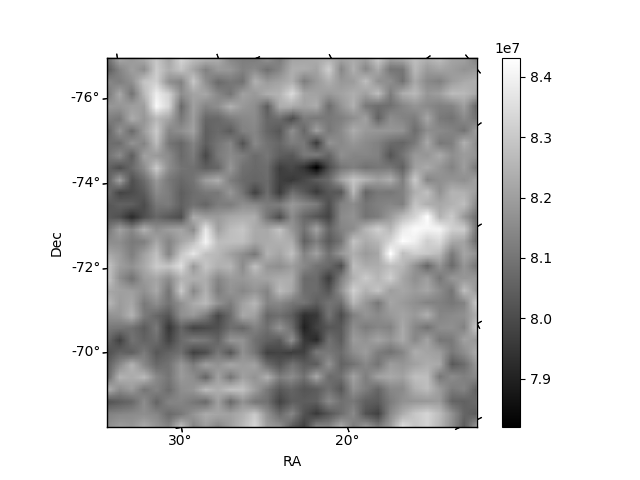
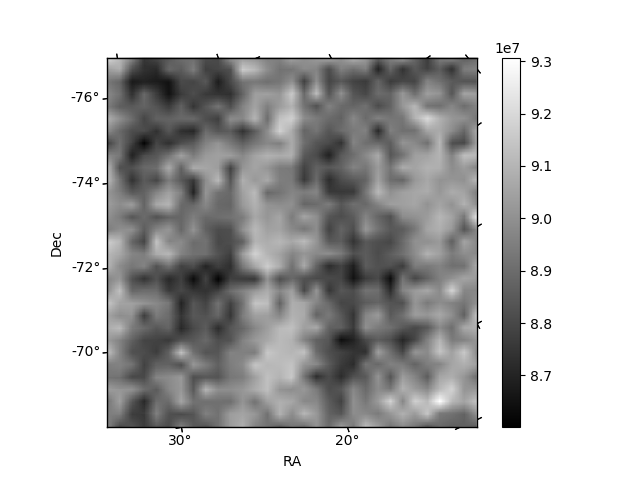
Histogram calculated using DETX and DETY for each event in the final _common_clean file
| Quadrant A | 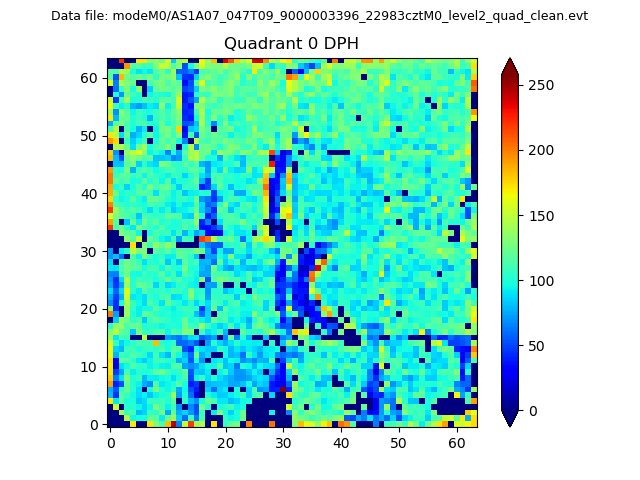 |
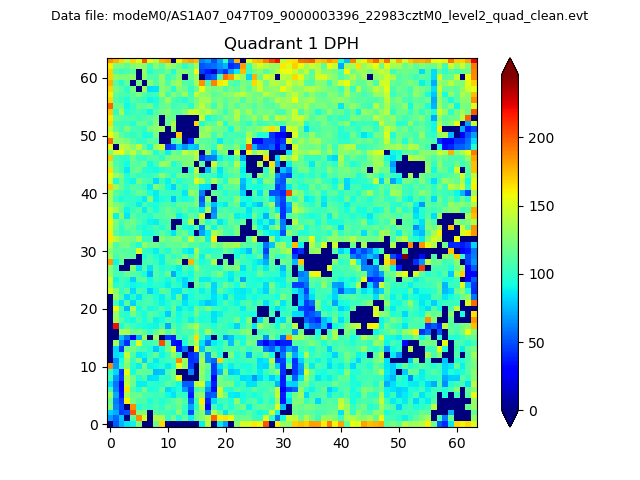 |
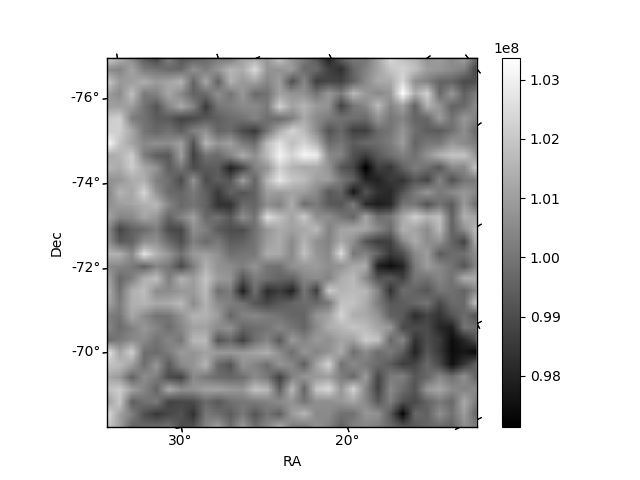
Quadrant B |
|---|---|---|---|
| Quadrant D | 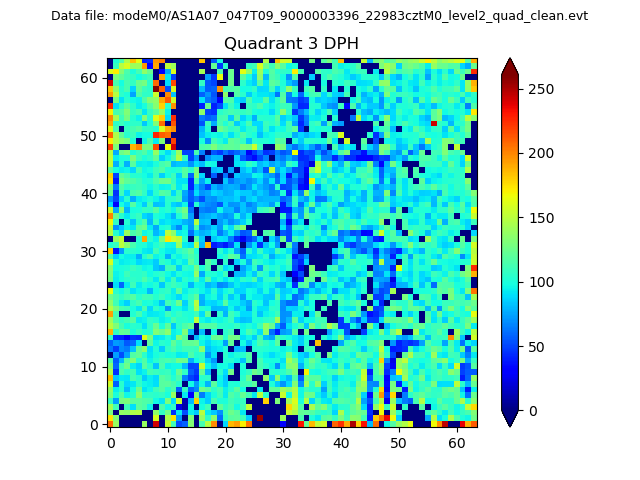 |
 |
Quadrant C |
| Plot type | Count rate plots | Images |
|---|---|---|
| Comparison with Poisson distribution Blue bars denote a histogram of data divided into 1 sec bins. Red curve is a Poisson curve with rate = median count rate of data. |
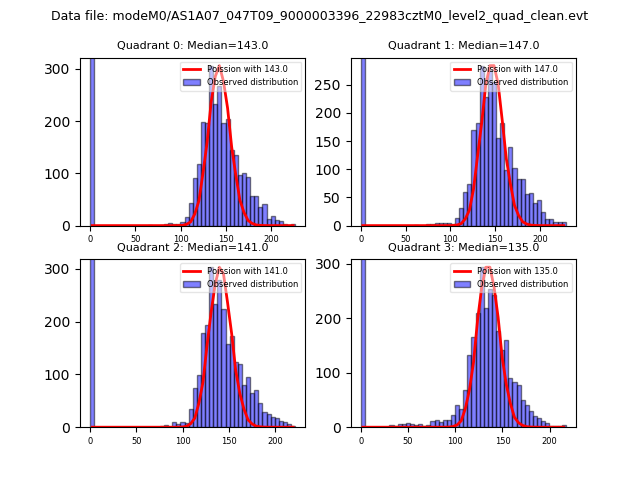 |
 |
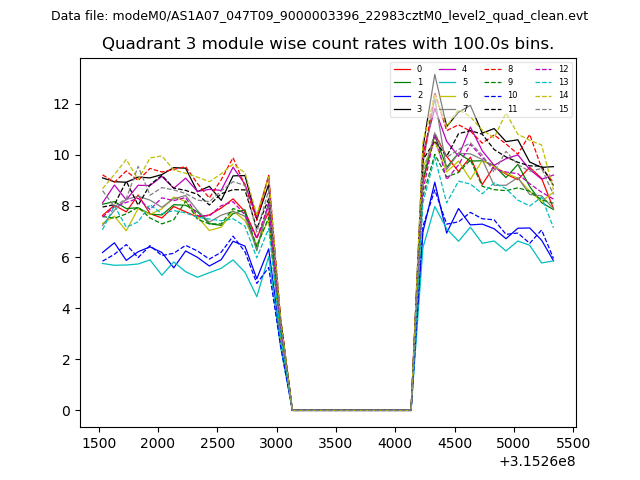
| Quadrant-wise count rates Data is divided into 100 sec bins |
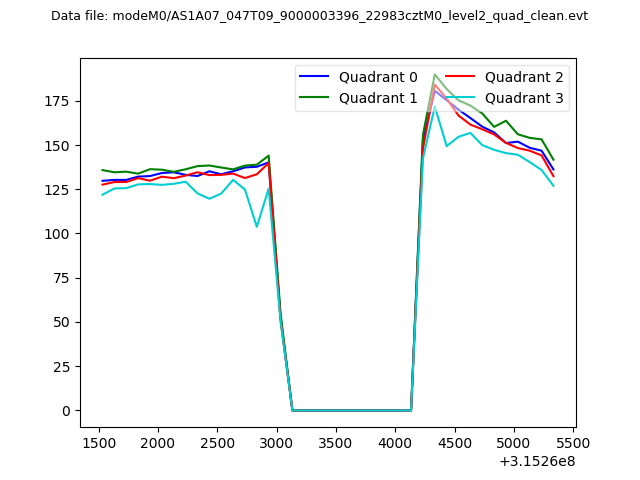 |
|
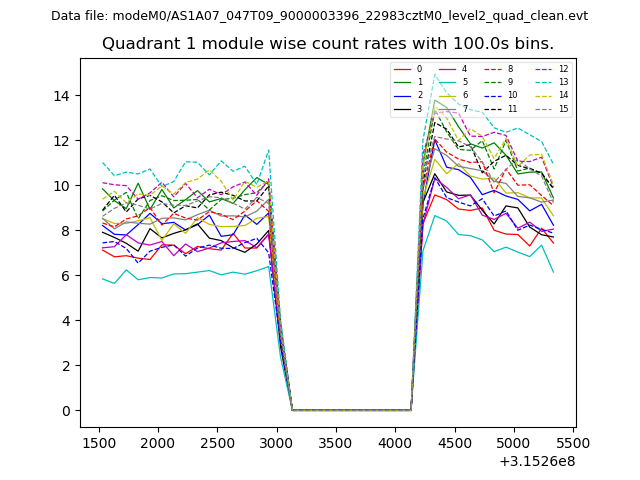
| Module-wise count rates for Quadrant A Data is divided into 100 sec bins |
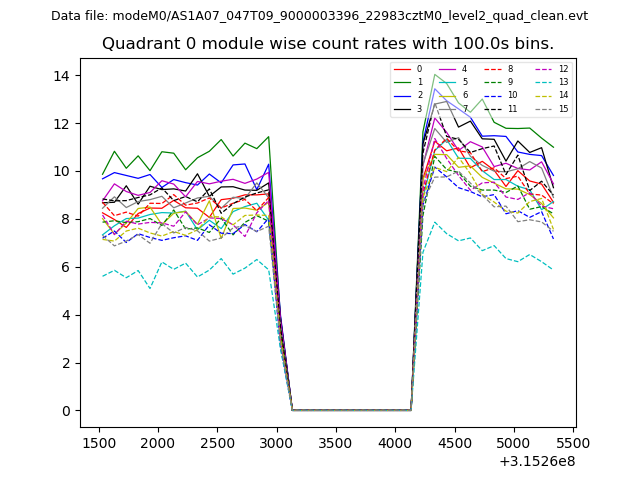 |
 |
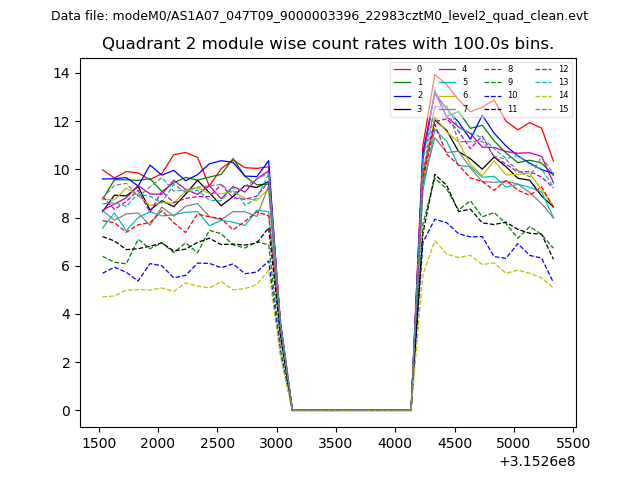
| Module-wise count rates for Quadrant B Data is divided into 100 sec bins |
 |
 |
| Module-wise count rates for Quadrant C Data is divided into 100 sec bins |
 |
 |
| Module-wise count rates for Quadrant D Data is divided into 100 sec bins |
 |
 |
| Parameter | Plot |
|---|---|
| CZT HV Monitor | 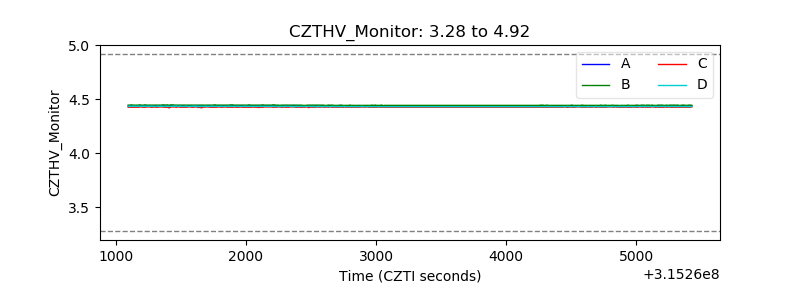 |
| D_VDD | 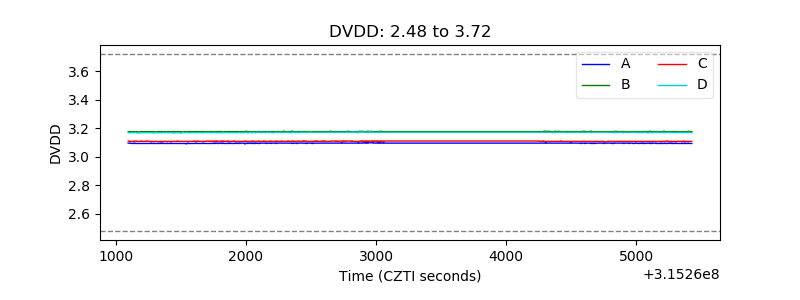 |
| Temperature 1 | 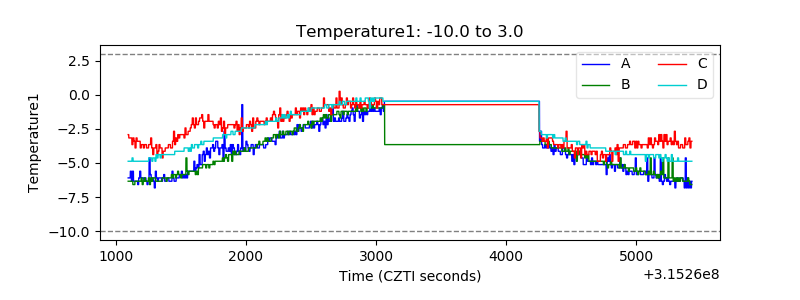 |
| Veto HV Monitor | 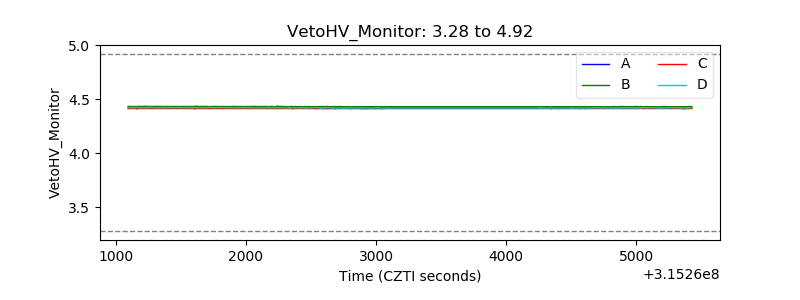 |
| Veto LLD | 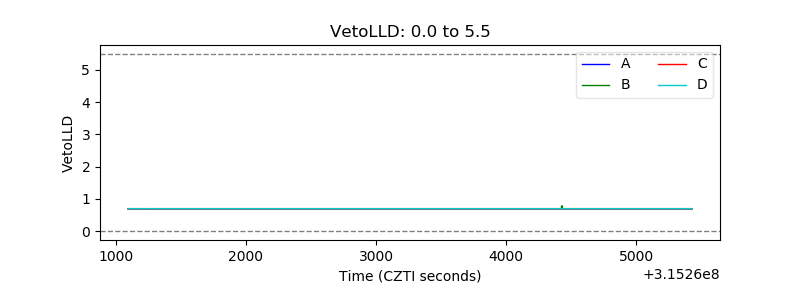 |
| Alpha Counter | 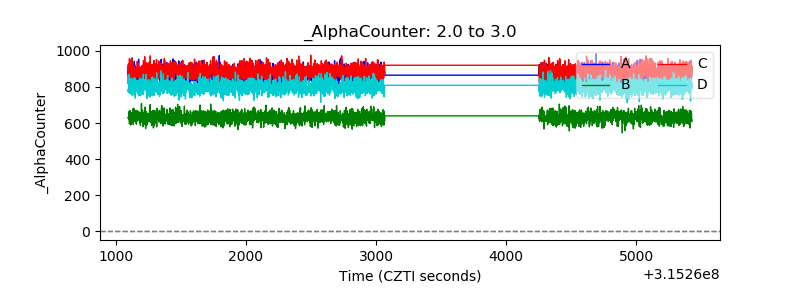 |
| _CPM_Rate |  |
| CZT Counter | 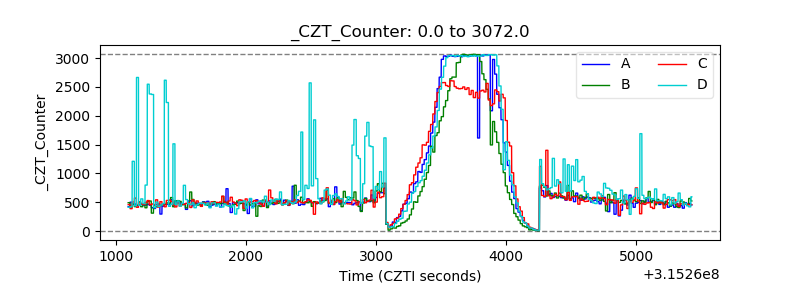 |
| +2.5 Volts monitor |  |
| +5 Volts monitor | 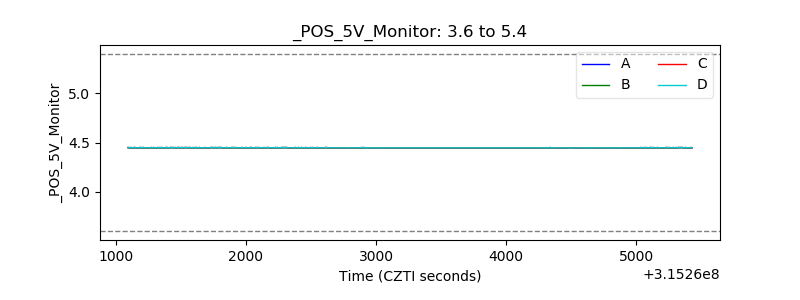 |
| _ROLL_ROT | 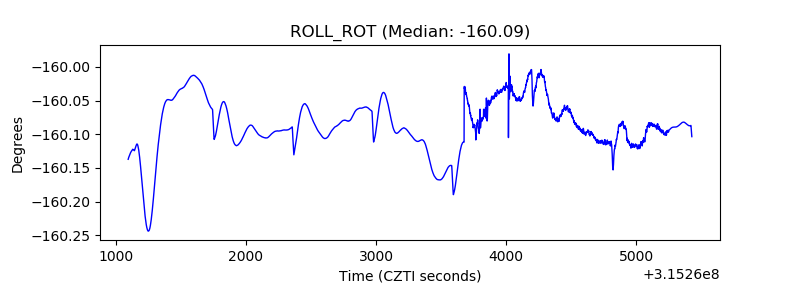 |
| _Roll_DEC | 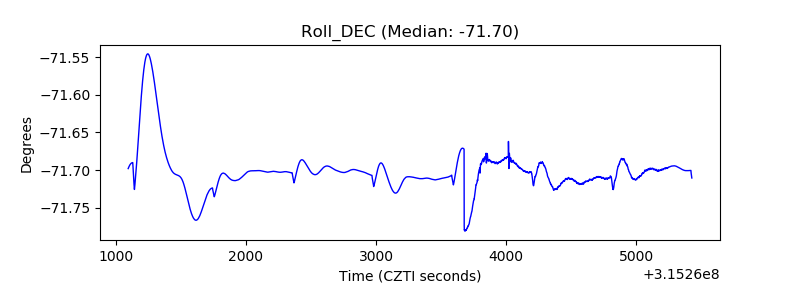 |
| _Roll_RA | 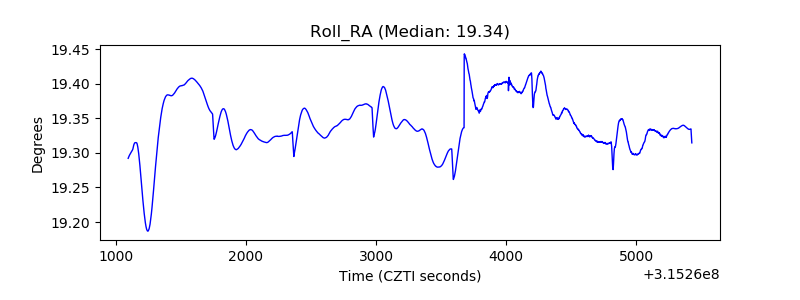 |
| Veto Counter | 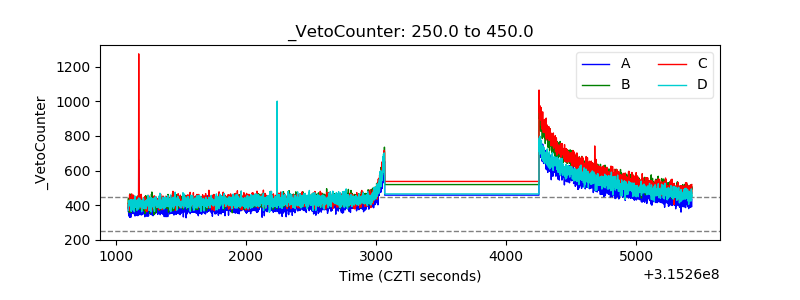 |