| Param | Original file | Final file |
|---|---|---|
| Filename | modeM0/AS1A07_047T09_9000003396_22985cztM0_level2.evt | modeM0/AS1A07_047T09_9000003396_22985cztM0_level2_quad_clean.evt |
| Size (bytes) | 477,780,480 | 117,573,120 |
| Size | 455.6 MB | 112.1 MB |
| Events in quadrant A | 3,240,924 | 786,069 |
| Events in quadrant B | 3,413,485 | 811,977 |
| Events in quadrant C | 3,400,656 | 775,755 |
| Events in quadrant D | 3,980,981 | 741,551 |
| Mode SS | |||
|---|---|---|---|
| Quadrant | BADHDUFLAG | Total packets | Discarded packets |
| A | 0 | 130 | 0 |
| B | 0 | 130 | 0 |
| C | 0 | 130 | 0 |
| D | 0 | 130 | 0 |
| Mode M0 | |||
|---|---|---|---|
| Quadrant | BADHDUFLAG | Total packets | Discarded packets |
| A | 0 | 13409 | 3 |
| B | 0 | 13952 | 3 |
| C | 0 | 13816 | 4 |
| D | 0 | 15967 | 3 |
| Mode M9 | |||
|---|---|---|---|
| Quadrant | BADHDUFLAG | Total packets | Discarded packets |
| A | 0 | 16 | 0 |
| B | 0 | 17 | 0 |
| C | 0 | 17 | 0 |
| D | 0 | 17 | 0 |
| Quadrant | Total seconds | Saturated seconds | Saturation percentage |
|---|---|---|---|
| A | 6388 | 19 | 0.297433% |
| B | 6388 | 48 | 0.751409% |
| C | 6387 | 67 | 1.049006% |
| D | 6387 | 79 | 1.236887% |
Noise dominated data is calculated using 1-second bins in cleaned event files. If a bin has >2000 counts, and if more than 50% of those come from <1% of pixels, then it is considered to be noise-dominated and hence unusable.
| Quadrant | # 1 sec bins | Bins with >0 counts | Bins with >2000 counts | High rate bins dominated by noise | Noise dominated (total time) | Noise dominated (detector-on time) | Marked lightcurve |
|---|---|---|---|---|---|---|---|
| A | 7738 | 6390 | 0 | 0 | 0.00% | 0.00% | 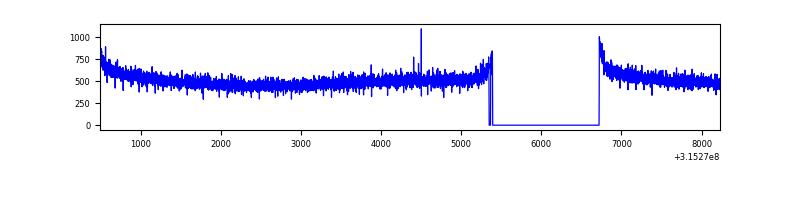 |
| B | 7738 | 6390 | 1 | 1 | 0.01% | 0.02% | 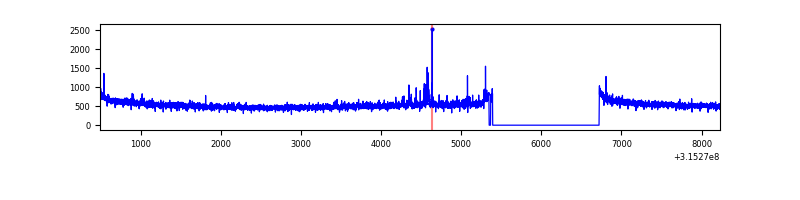 |
| C | 7737 | 6389 | 0 | 0 | 0.00% | 0.00% | 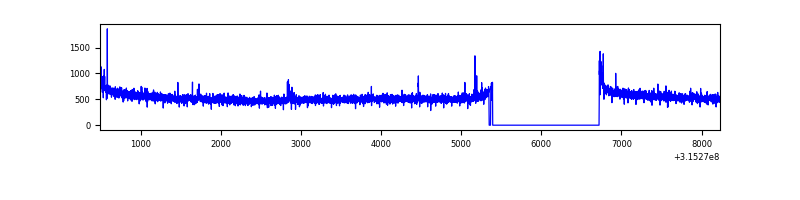 |
| D | 7737 | 6389 | 32 | 32 | 0.41% | 0.50% |  |
Top three noisy pixels from each quadrant. If the there are fewer than three noisy pixels in the level2.evt file, extra rows are filled as -1
| Pixel properties | Quadrant properties | ||||||
|---|---|---|---|---|---|---|---|
| Quadrant | DetID | PixID | Counts | Sigma | Mean | Median | Sigma |
| A | 13 | 254 | 10317 | 56.96 | 841 | 830 | 166.6 |
| A | 0 | 226 | 7266 | 38.64 | 841 | 830 | 166.6 |
| A | 3 | 137 | 6456 | 33.78 | 841 | 830 | 166.6 |
| B | 0 | 190 | 39316 | 246.41 | 853 | 834 | 156.2 |
| B | 0 | 189 | 29214 | 181.73 | 853 | 834 | 156.2 |
| B | 12 | 111 | 17561 | 107.11 | 853 | 834 | 156.2 |
| C | 14 | 238 | 135256 | 715.64 | 827 | 836 | 187.8 |
| C | 7 | 247 | 22962 | 117.8 | 827 | 836 | 187.8 |
| C | 0 | 10 | 16590 | 83.87 | 827 | 836 | 187.8 |
| D | 1 | 52 | 329354 | 1676.0 | 822 | 803 | 196.0 |
| D | 12 | 227 | 197764 | 1004.73 | 822 | 803 | 196.0 |
| D | 13 | 153 | 185901 | 944.22 | 822 | 803 | 196.0 |
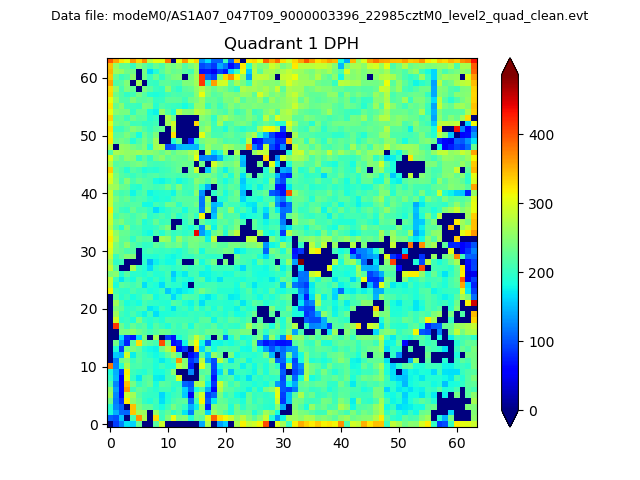
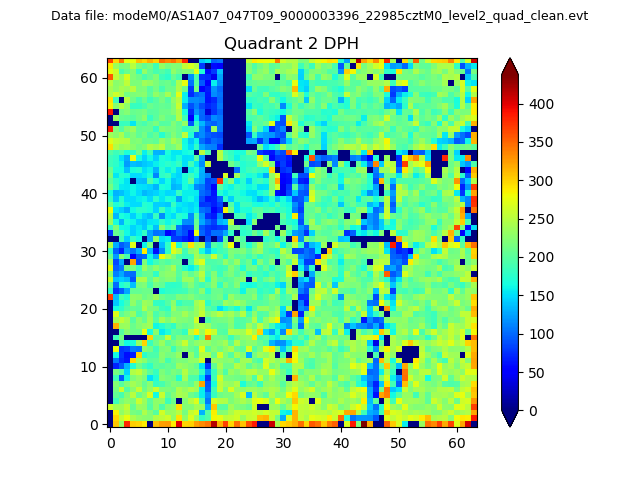
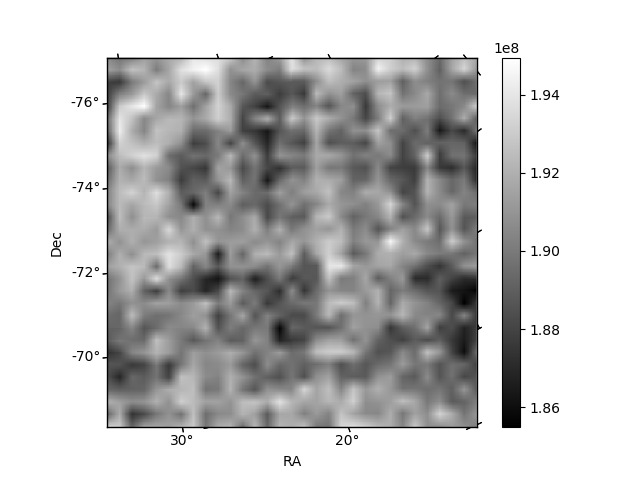
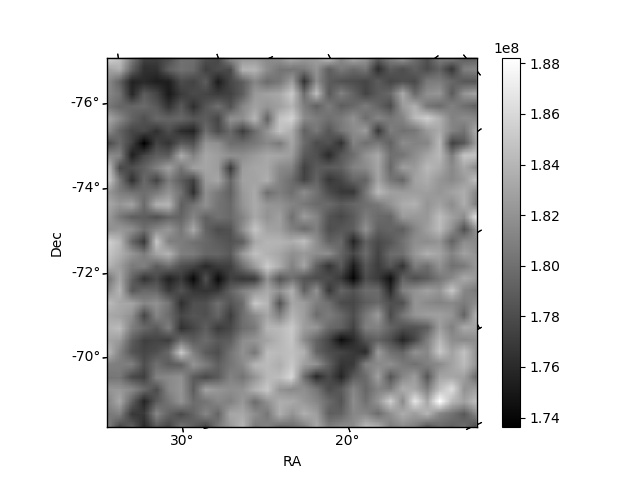
Histogram calculated using DETX and DETY for each event in the final _common_clean file
| Quadrant A | 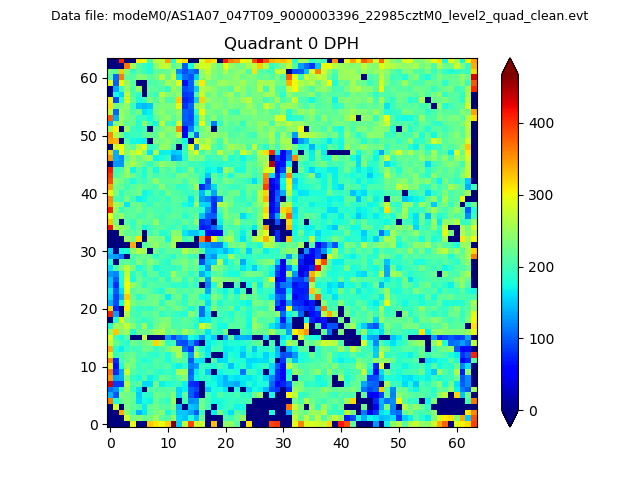 |
 |
Quadrant B |
|---|---|---|---|
| Quadrant D | 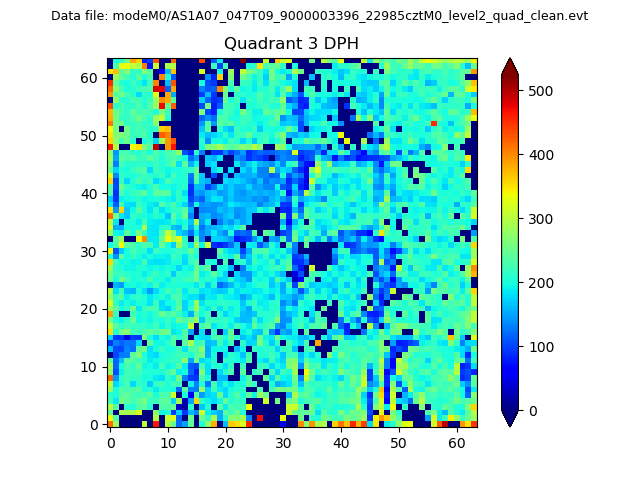 |
 |
Quadrant C |
| Plot type | Count rate plots | Images |
|---|---|---|
| Comparison with Poisson distribution Blue bars denote a histogram of data divided into 1 sec bins. Red curve is a Poisson curve with rate = median count rate of data. |
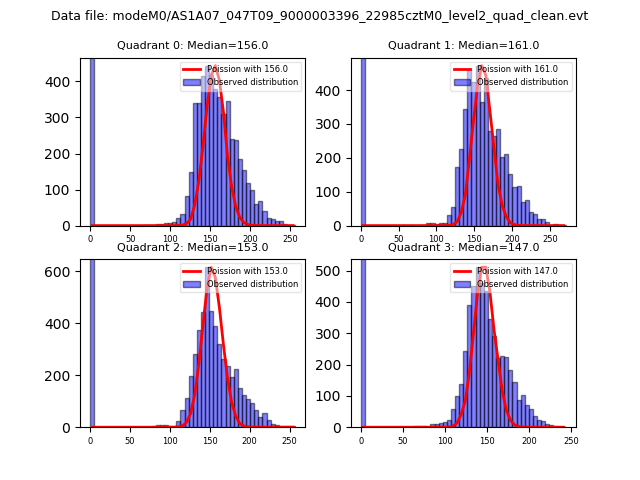 |
 |
| Quadrant-wise count rates Data is divided into 100 sec bins |
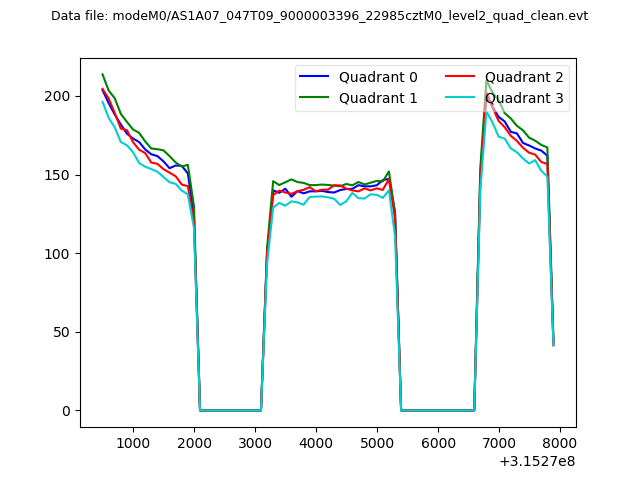 |
|
| Module-wise count rates for Quadrant A Data is divided into 100 sec bins |
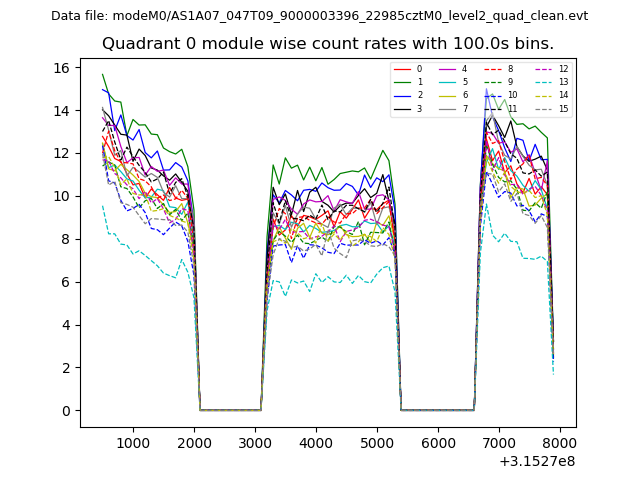 |
 |
| Module-wise count rates for Quadrant B Data is divided into 100 sec bins |
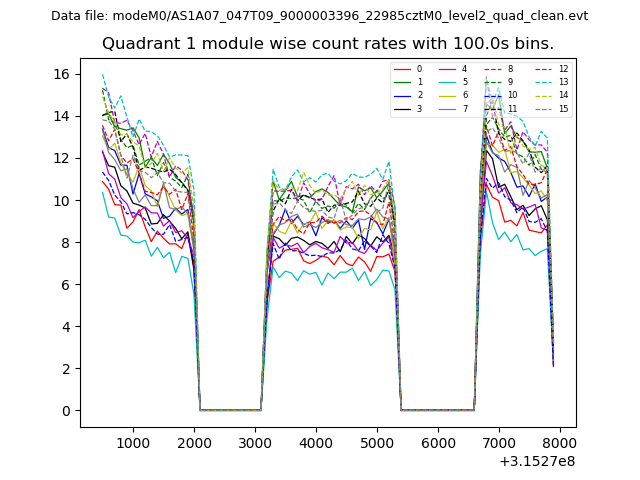 |
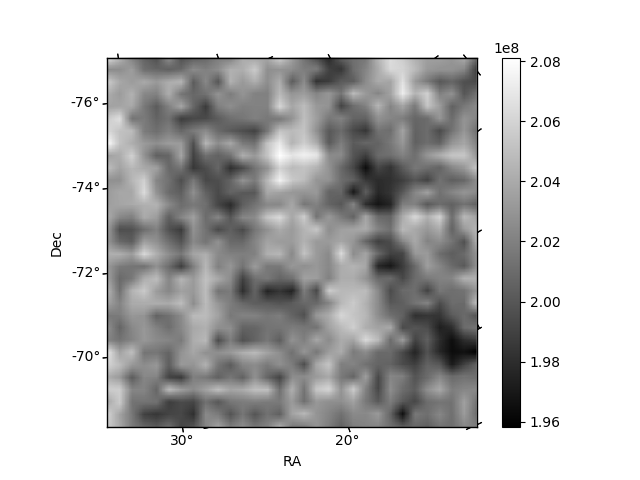 |
| Module-wise count rates for Quadrant C Data is divided into 100 sec bins |
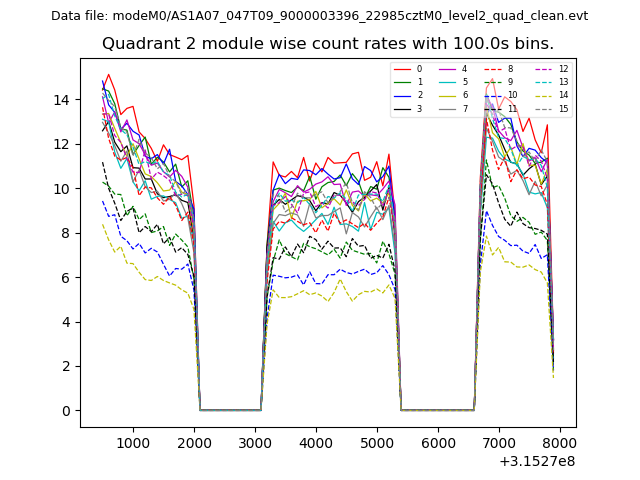 |
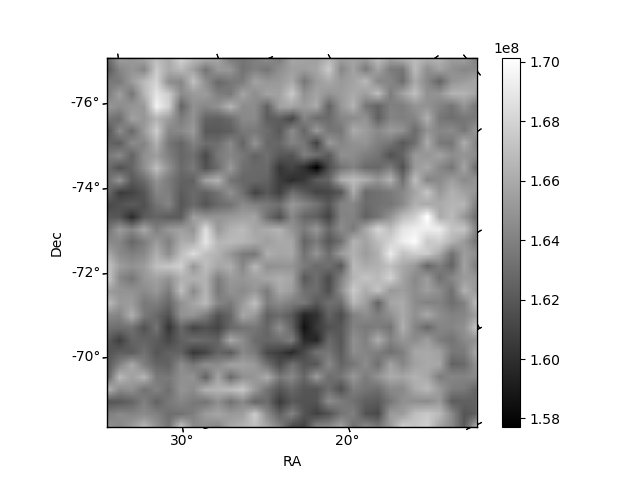 |
| Module-wise count rates for Quadrant D Data is divided into 100 sec bins |
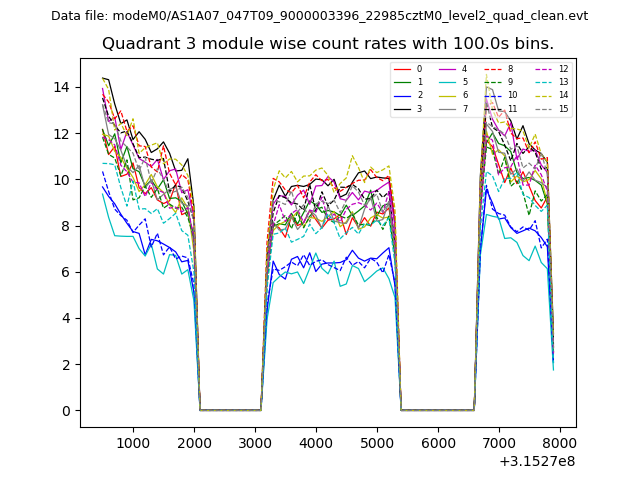 |
 |
| Parameter | Plot |
|---|---|
| CZT HV Monitor | 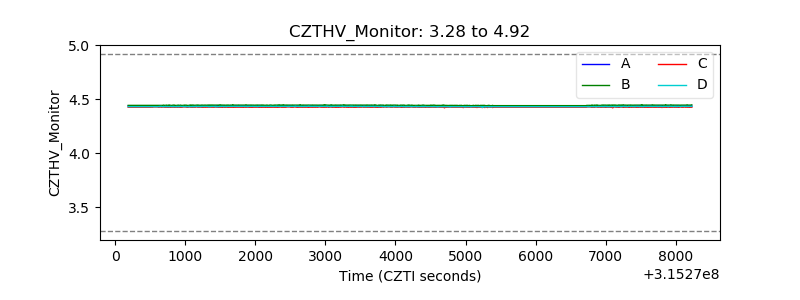 |
| D_VDD | 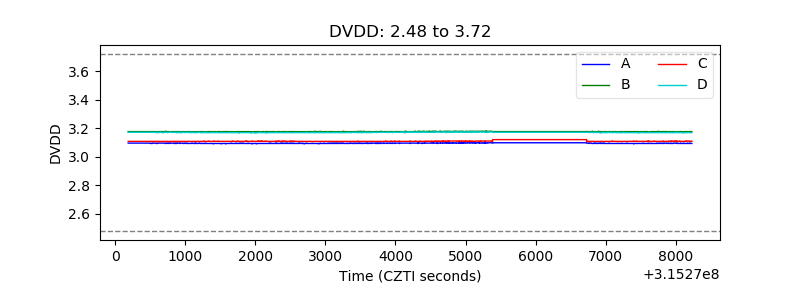 |
| Temperature 1 | 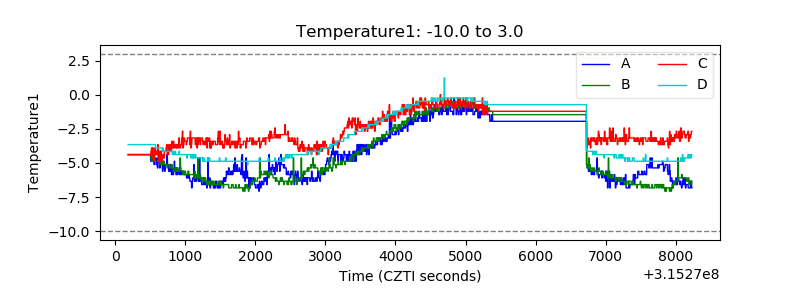 |
| Veto HV Monitor |  |
| Veto LLD | 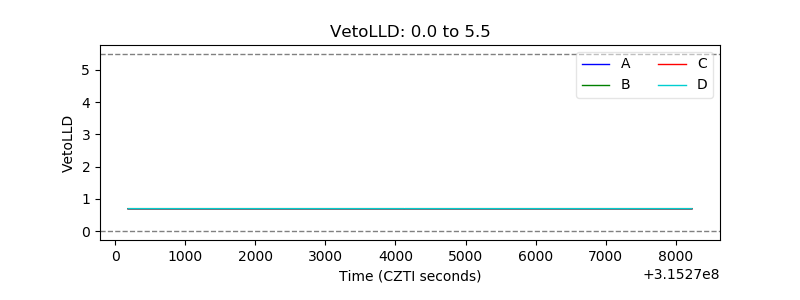 |
| Alpha Counter | 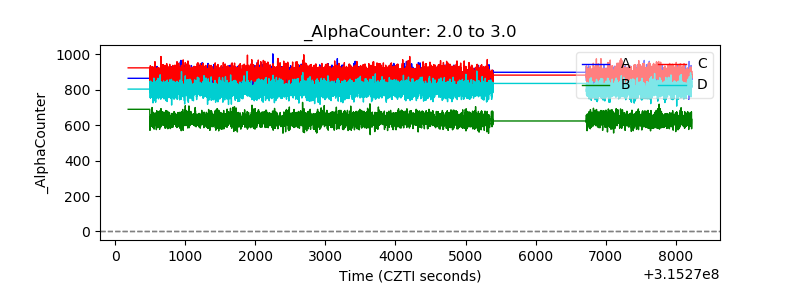 |
| _CPM_Rate | 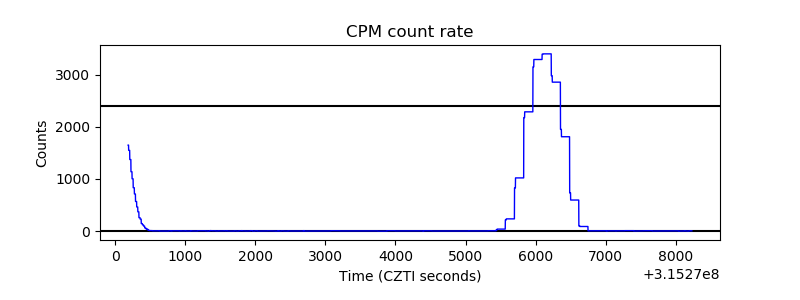 |
| CZT Counter | 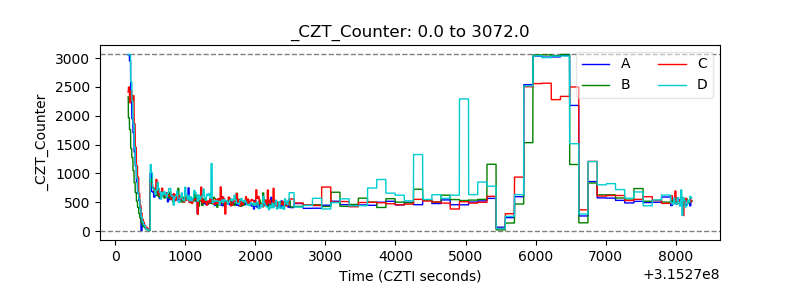 |
| +2.5 Volts monitor |  |
| +5 Volts monitor |  |
| _ROLL_ROT | 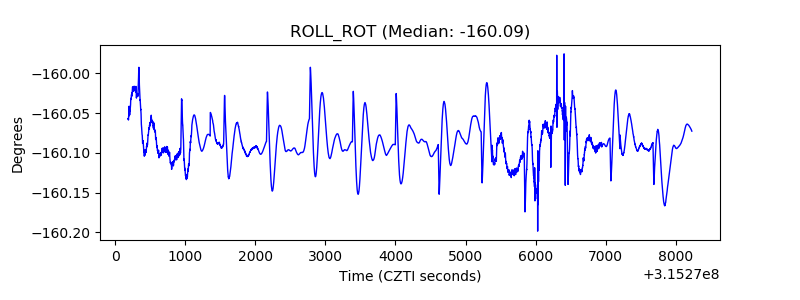 |
| _Roll_DEC | 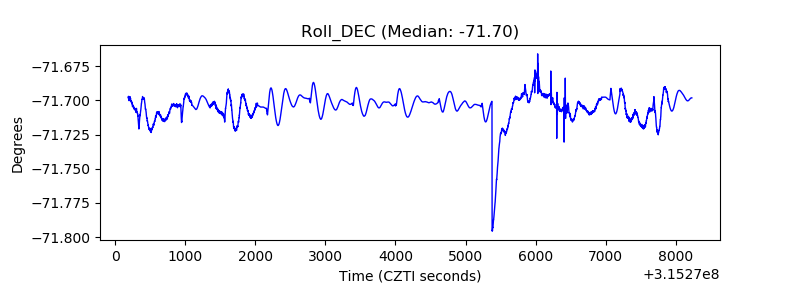 |
| _Roll_RA | 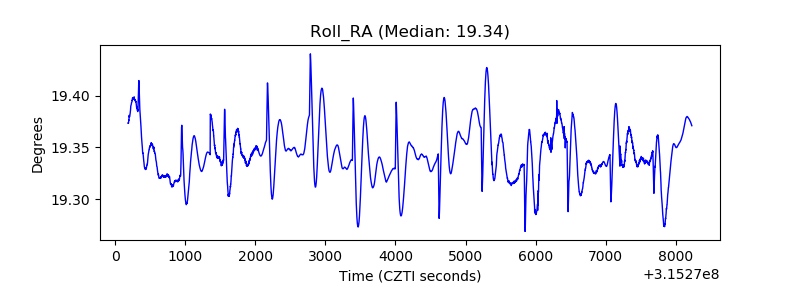 |
| Veto Counter | 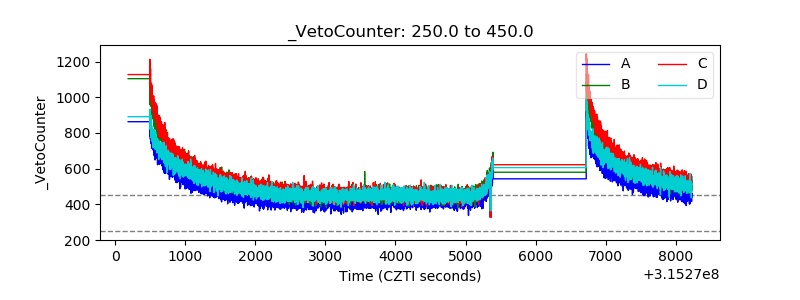 |