| Param | Original file | Final file |
|---|---|---|
| Filename | modeM0/AS1A07_047T09_9000003396_22987cztM0_level2.evt | modeM0/AS1A07_047T09_9000003396_22987cztM0_level2_quad_clean.evt |
| Size (bytes) | 506,473,920 | 98,919,360 |
| Size | 483.0 MB | 94.3 MB |
| Events in quadrant A | 3,283,222 | 645,320 |
| Events in quadrant B | 3,528,895 | 658,675 |
| Events in quadrant C | 3,405,368 | 632,370 |
| Events in quadrant D | 4,678,434 | 604,450 |
| Mode SS | |||
|---|---|---|---|
| Quadrant | BADHDUFLAG | Total packets | Discarded packets |
| A | 0 | 132 | 0 |
| B | 0 | 132 | 0 |
| C | 0 | 132 | 0 |
| D | 0 | 132 | 0 |
| Mode M0 | |||
|---|---|---|---|
| Quadrant | BADHDUFLAG | Total packets | Discarded packets |
| A | 0 | 13550 | 2 |
| B | 0 | 14348 | 2 |
| C | 0 | 13832 | 2 |
| D | 0 | 18066 | 2 |
| Mode M9 | |||
|---|---|---|---|
| Quadrant | BADHDUFLAG | Total packets | Discarded packets |
| A | 0 | 18 | 0 |
| B | 0 | 19 | 0 |
| C | 0 | 19 | 0 |
| D | 0 | 19 | 0 |
| Quadrant | Total seconds | Saturated seconds | Saturation percentage |
|---|---|---|---|
| A | 6522 | 96 | 1.471941% |
| B | 6522 | 151 | 2.315241% |
| C | 6522 | 179 | 2.744557% |
| D | 6522 | 417 | 6.393744% |
Noise dominated data is calculated using 1-second bins in cleaned event files. If a bin has >2000 counts, and if more than 50% of those come from <1% of pixels, then it is considered to be noise-dominated and hence unusable.
| Quadrant | # 1 sec bins | Bins with >0 counts | Bins with >2000 counts | High rate bins dominated by noise | Noise dominated (total time) | Noise dominated (detector-on time) | Marked lightcurve |
|---|---|---|---|---|---|---|---|
| A | 7707 | 6523 | 0 | 0 | 0.00% | 0.00% | 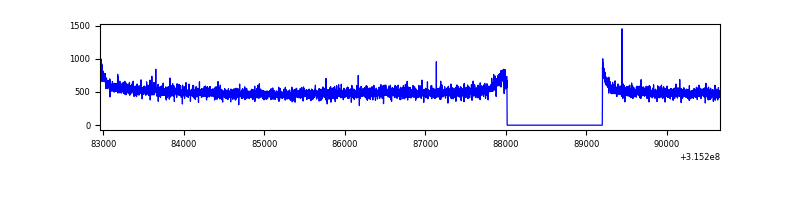 |
| B | 7707 | 6523 | 3 | 3 | 0.04% | 0.05% | 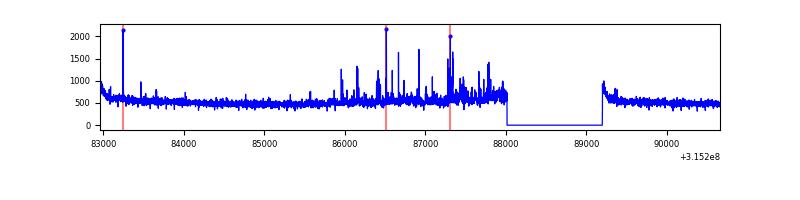 |
| C | 7707 | 6523 | 1 | 1 | 0.01% | 0.02% | 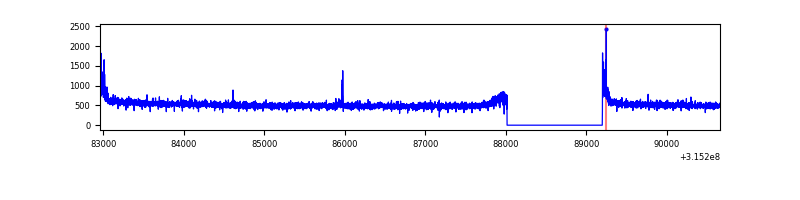 |
| D | 7707 | 6523 | 245 | 245 | 3.18% | 3.76% | 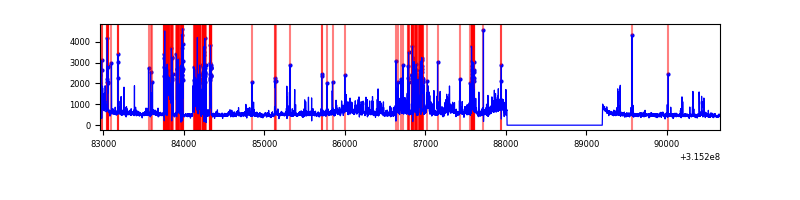 |
Top three noisy pixels from each quadrant. If the there are fewer than three noisy pixels in the level2.evt file, extra rows are filled as -1
| Pixel properties | Quadrant properties | ||||||
|---|---|---|---|---|---|---|---|
| Quadrant | DetID | PixID | Counts | Sigma | Mean | Median | Sigma |
| A | 13 | 254 | 9999 | 54.91 | 850 | 834 | 166.9 |
| A | 0 | 226 | 7211 | 38.21 | 850 | 834 | 166.9 |
| A | 3 | 137 | 6564 | 34.33 | 850 | 834 | 166.9 |
| B | 0 | 190 | 92698 | 586.47 | 851 | 831 | 156.6 |
| B | 0 | 189 | 77429 | 489.0 | 851 | 831 | 156.6 |
| B | 0 | 228 | 20050 | 122.69 | 851 | 831 | 156.6 |
| C | 14 | 238 | 134474 | 708.35 | 826 | 831 | 188.7 |
| C | 0 | 10 | 33095 | 171.01 | 826 | 831 | 188.7 |
| C | 7 | 247 | 13742 | 68.43 | 826 | 831 | 188.7 |
| D | 1 | 52 | 782708 | 4010.64 | 815 | 793 | 195.0 |
| D | 12 | 227 | 190997 | 975.61 | 815 | 793 | 195.0 |
| D | 13 | 249 | 162918 | 831.58 | 815 | 793 | 195.0 |
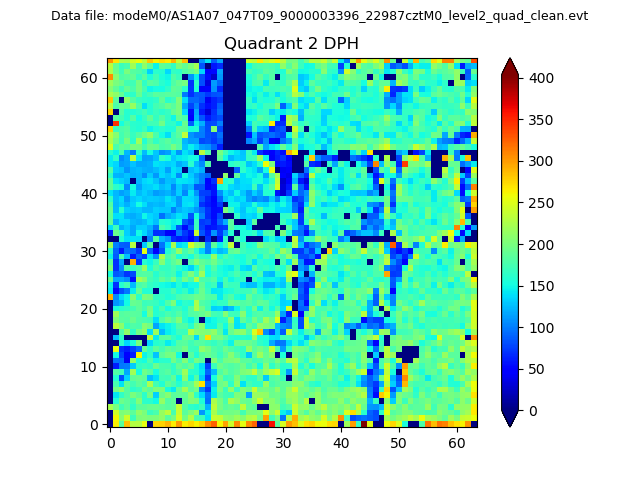
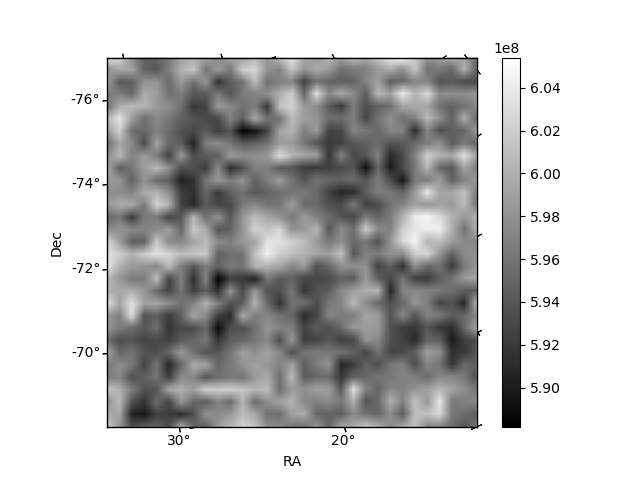
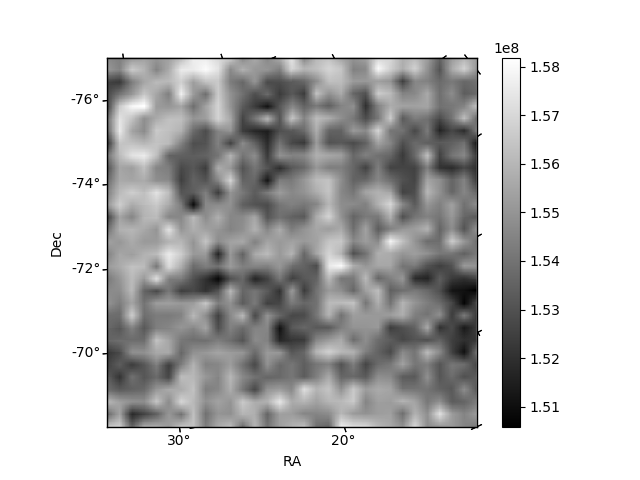
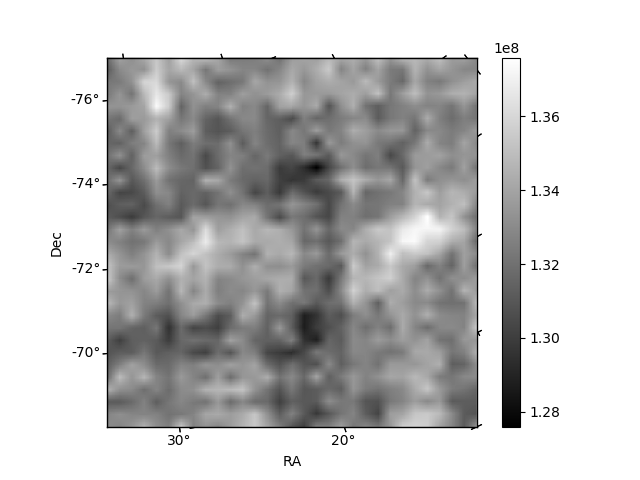
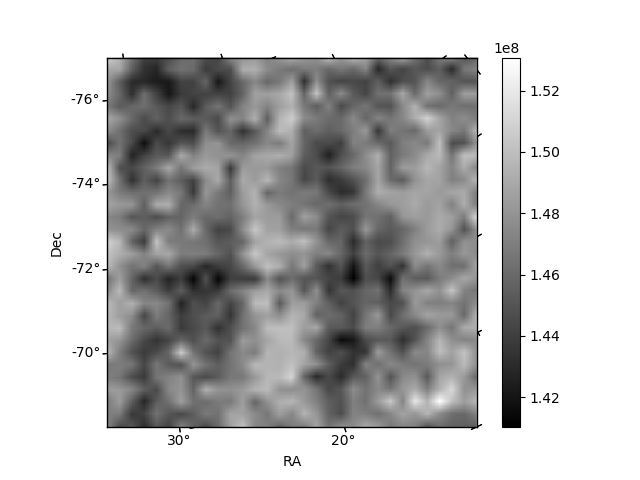
Histogram calculated using DETX and DETY for each event in the final _common_clean file
| Quadrant A | 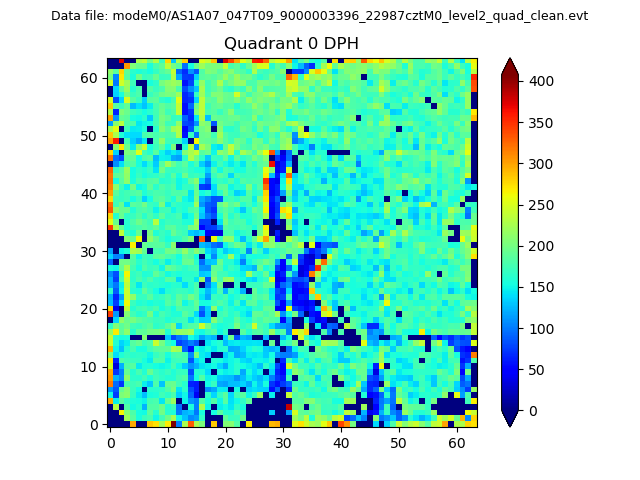 |
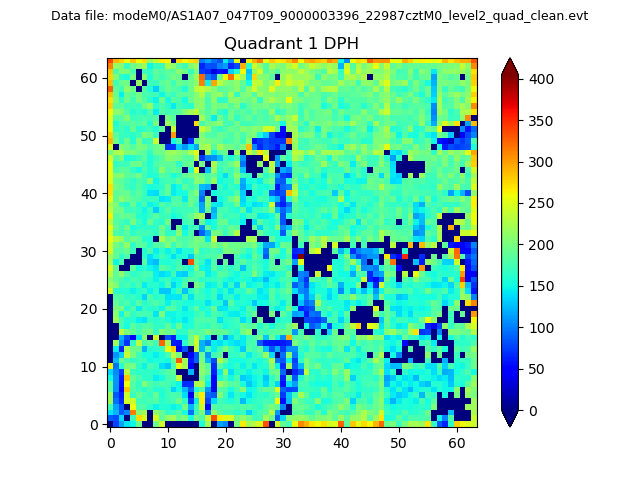 |
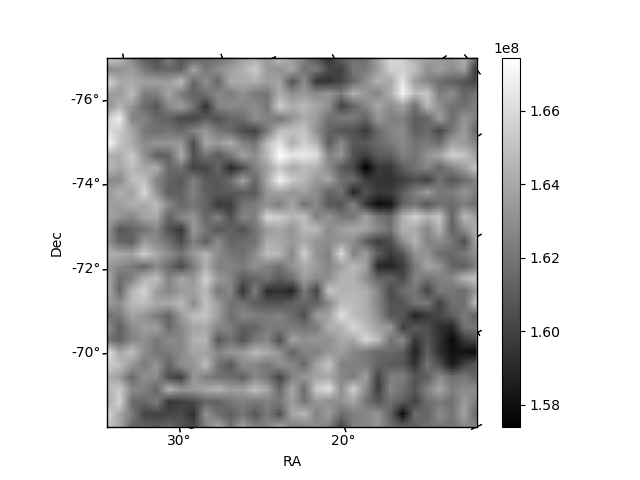
Quadrant B |
|---|---|---|---|
| Quadrant D | 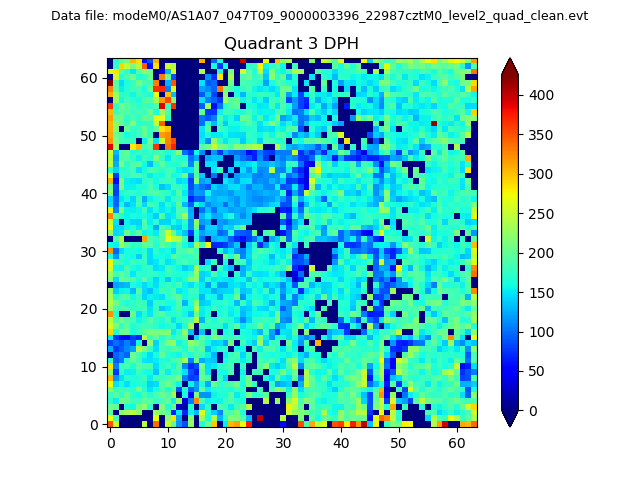 |
 |
Quadrant C |
| Plot type | Count rate plots | Images |
|---|---|---|
| Comparison with Poisson distribution Blue bars denote a histogram of data divided into 1 sec bins. Red curve is a Poisson curve with rate = median count rate of data. |
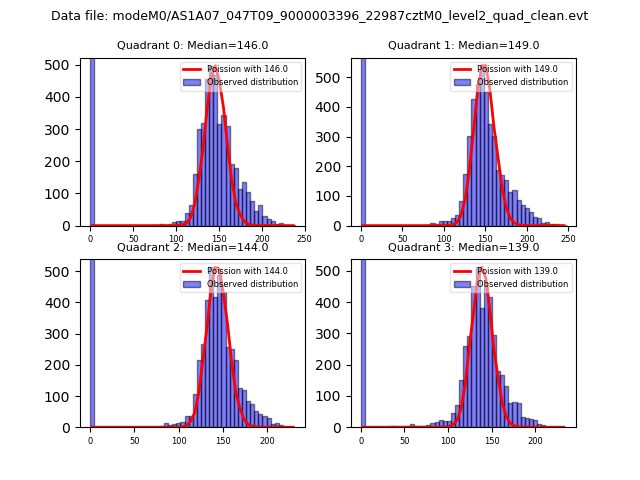 |
 |
| Quadrant-wise count rates Data is divided into 100 sec bins |
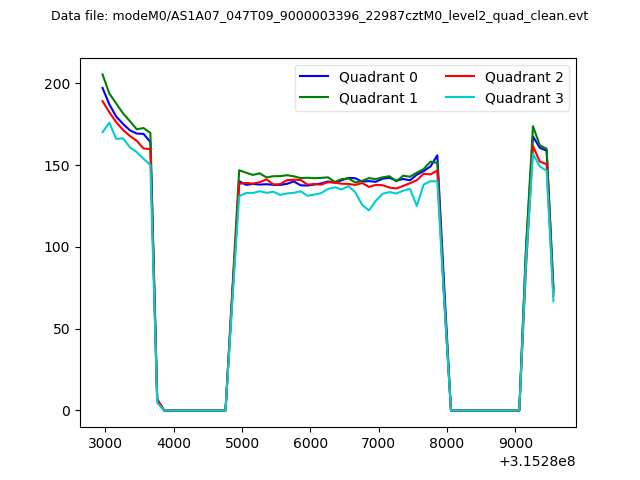 |
|
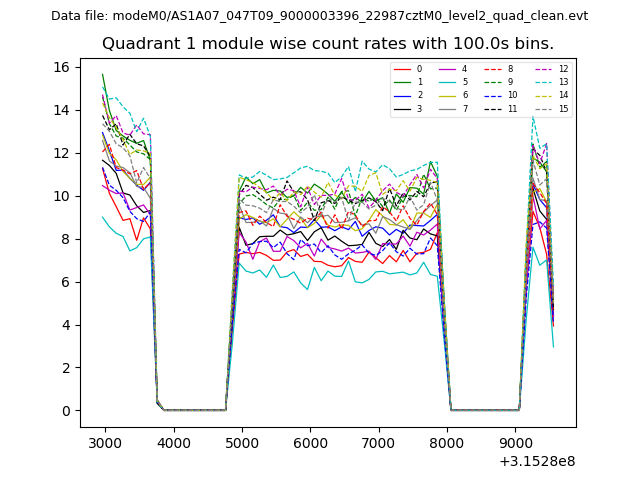
| Module-wise count rates for Quadrant A Data is divided into 100 sec bins |
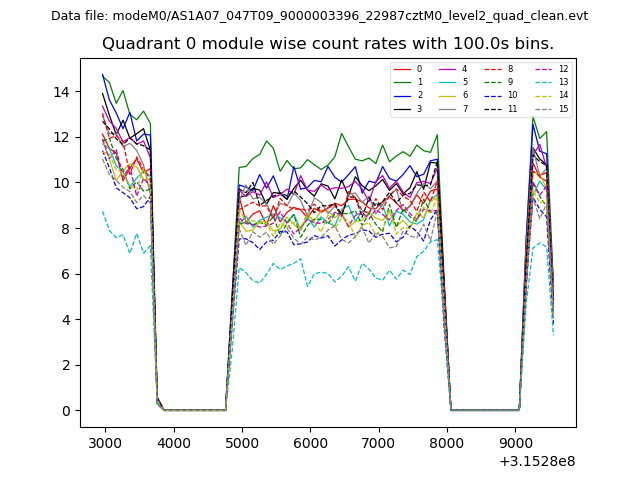 |
 |
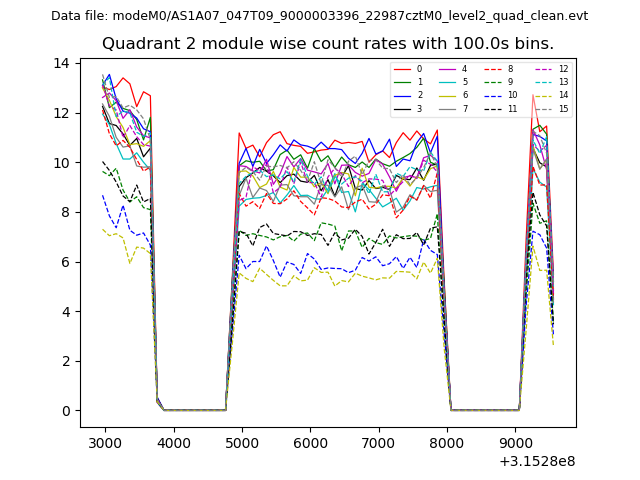
| Module-wise count rates for Quadrant B Data is divided into 100 sec bins |
 |
 |
| Module-wise count rates for Quadrant C Data is divided into 100 sec bins |
 |
 |
| Module-wise count rates for Quadrant D Data is divided into 100 sec bins |
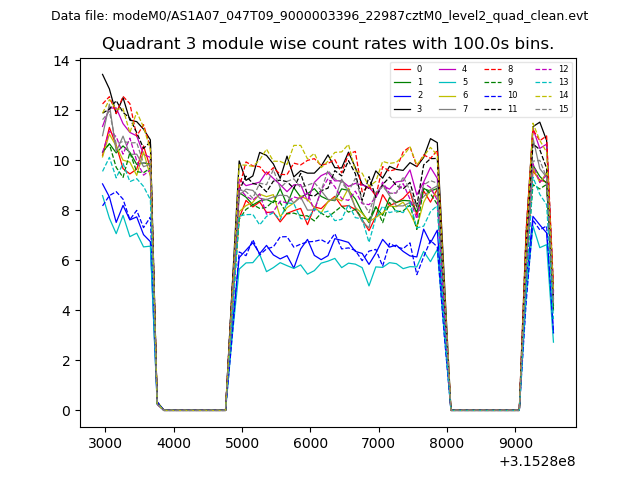 |
 |
| Parameter | Plot |
|---|---|
| CZT HV Monitor | 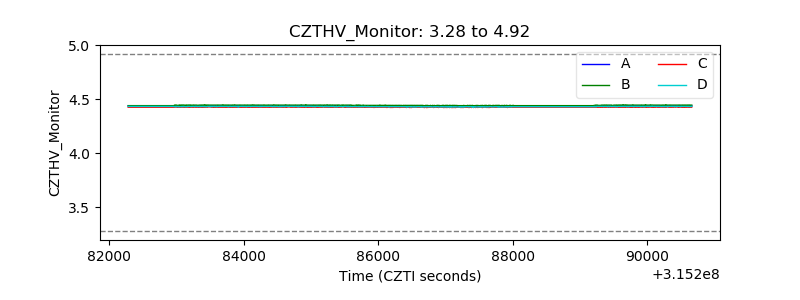 |
| D_VDD | 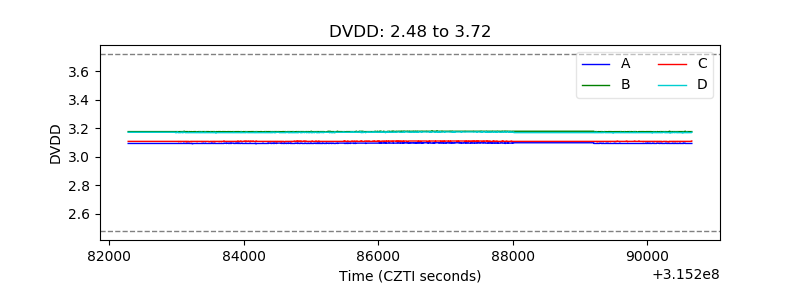 |
| Temperature 1 | 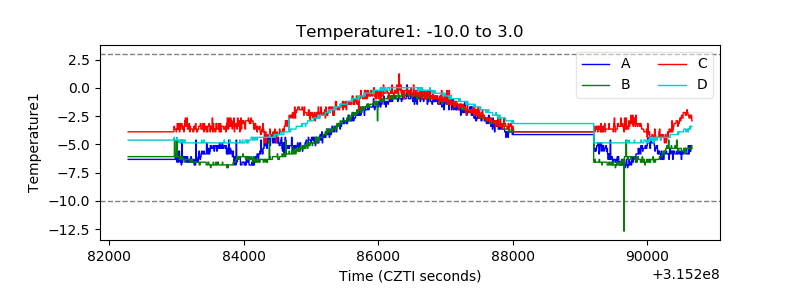 |
| Veto HV Monitor | 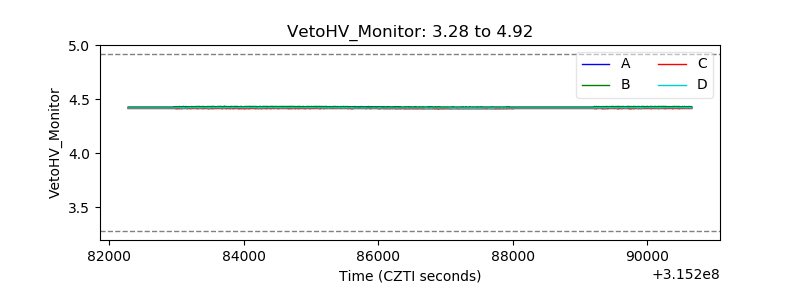 |
| Veto LLD | 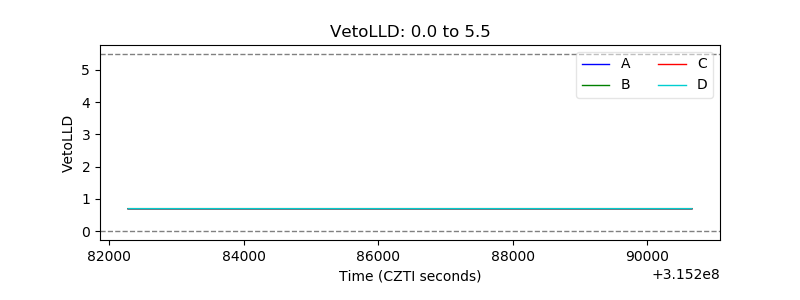 |
| Alpha Counter | 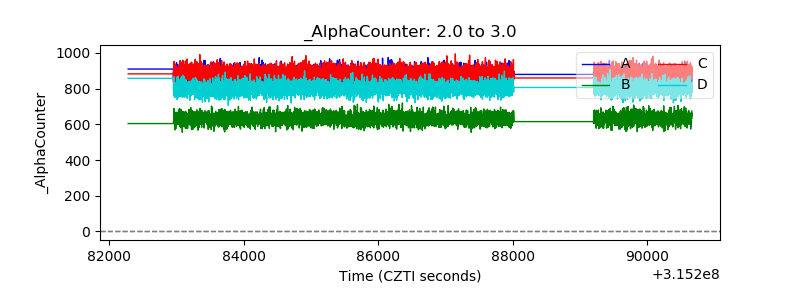 |
| _CPM_Rate | 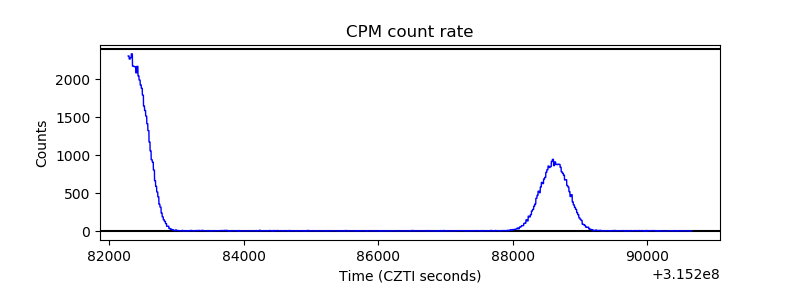 |
| CZT Counter | 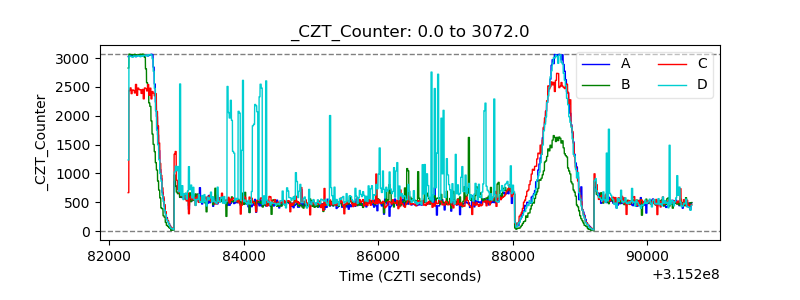 |
| +2.5 Volts monitor |  |
| +5 Volts monitor |  |
| _ROLL_ROT | 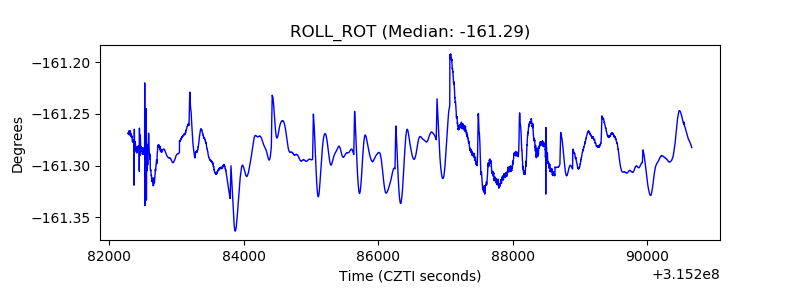 |
| _Roll_DEC |  |
| _Roll_RA | 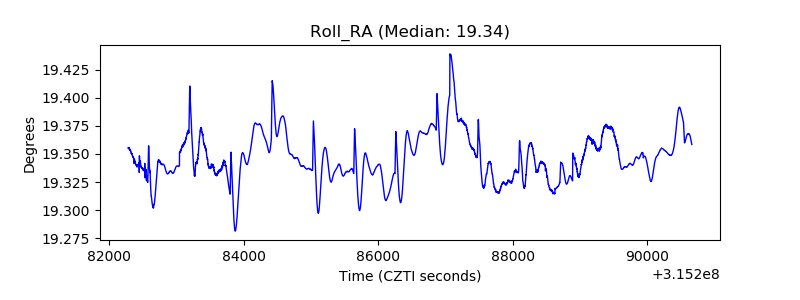 |
| Veto Counter | 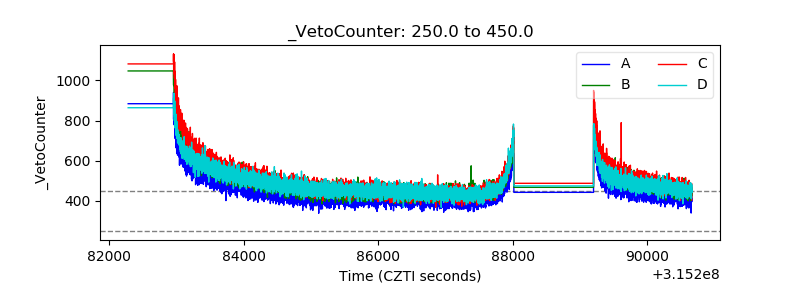 |