| Param | Original file | Final file |
|---|---|---|
| Filename | modeM0/AS1A07_047T09_9000003396_22988cztM0_level2.evt | modeM0/AS1A07_047T09_9000003396_22988cztM0_level2_quad_clean.evt |
| Size (bytes) | 338,437,440 | 73,330,560 |
| Size | 322.8 MB | 69.9 MB |
| Events in quadrant A | 2,297,220 | 479,350 |
| Events in quadrant B | 2,401,094 | 489,418 |
| Events in quadrant C | 2,262,800 | 472,171 |
| Events in quadrant D | 2,971,562 | 452,906 |
| Mode SS | |||
|---|---|---|---|
| Quadrant | BADHDUFLAG | Total packets | Discarded packets |
| A | 0 | 94 | 0 |
| B | 0 | 94 | 0 |
| C | 0 | 94 | 0 |
| D | 0 | 94 | 0 |
| Mode M0 | |||
|---|---|---|---|
| Quadrant | BADHDUFLAG | Total packets | Discarded packets |
| A | 0 | 9719 | 1 |
| B | 0 | 9864 | 1 |
| C | 0 | 9523 | 1 |
| D | 0 | 11835 | 1 |
| Mode M9 | |||
|---|---|---|---|
| Quadrant | BADHDUFLAG | Total packets | Discarded packets |
| A | 0 | 11 | 0 |
| B | 0 | 12 | 0 |
| C | 0 | 12 | 0 |
| D | 0 | 12 | 0 |
| Quadrant | Total seconds | Saturated seconds | Saturation percentage |
|---|---|---|---|
| A | 4654 | 16 | 0.343790% |
| B | 4654 | 27 | 0.580146% |
| C | 4654 | 47 | 1.009884% |
| D | 4654 | 95 | 2.041255% |
Noise dominated data is calculated using 1-second bins in cleaned event files. If a bin has >2000 counts, and if more than 50% of those come from <1% of pixels, then it is considered to be noise-dominated and hence unusable.
| Quadrant | # 1 sec bins | Bins with >0 counts | Bins with >2000 counts | High rate bins dominated by noise | Noise dominated (total time) | Noise dominated (detector-on time) | Marked lightcurve |
|---|---|---|---|---|---|---|---|
| A | 4654 | 4654 | 5 | 5 | 0.11% | 0.11% |  |
| B | 4654 | 4654 | 2 | 2 | 0.04% | 0.04% |  |
| C | 4654 | 4654 | 1 | 1 | 0.02% | 0.02% |  |
| D | 4654 | 4654 | 66 | 66 | 1.42% | 1.42% |  |
Top three noisy pixels from each quadrant. If the there are fewer than three noisy pixels in the level2.evt file, extra rows are filled as -1
| Pixel properties | Quadrant properties | ||||||
|---|---|---|---|---|---|---|---|
| Quadrant | DetID | PixID | Counts | Sigma | Mean | Median | Sigma |
| A | 14 | 237 | 56981 | 498.66 | 569 | 559 | 113.1 |
| A | 4 | 2 | 43231 | 377.14 | 569 | 559 | 113.1 |
| A | 13 | 254 | 7976 | 65.55 | 569 | 559 | 113.1 |
| B | 0 | 190 | 74942 | 701.57 | 570 | 559 | 106.0 |
| B | 0 | 189 | 35466 | 329.24 | 570 | 559 | 106.0 |
| B | 3 | 209 | 31752 | 294.21 | 570 | 559 | 106.0 |
| C | 14 | 238 | 89561 | 697.02 | 550 | 554 | 127.7 |
| C | 0 | 10 | 18747 | 142.47 | 550 | 554 | 127.7 |
| C | 13 | 61 | 3824 | 25.61 | 550 | 554 | 127.7 |
| D | 1 | 52 | 379619 | 2844.1 | 553 | 539 | 133.3 |
| D | 13 | 153 | 144398 | 1079.32 | 553 | 539 | 133.3 |
| D | 13 | 249 | 69162 | 514.85 | 553 | 539 | 133.3 |
Histogram calculated using DETX and DETY for each event in the final _common_clean file
| Quadrant A |  |
 |
Quadrant B |
|---|---|---|---|
| Quadrant D |  |
 |
Quadrant C |
| Plot type | Count rate plots | Images |
|---|---|---|
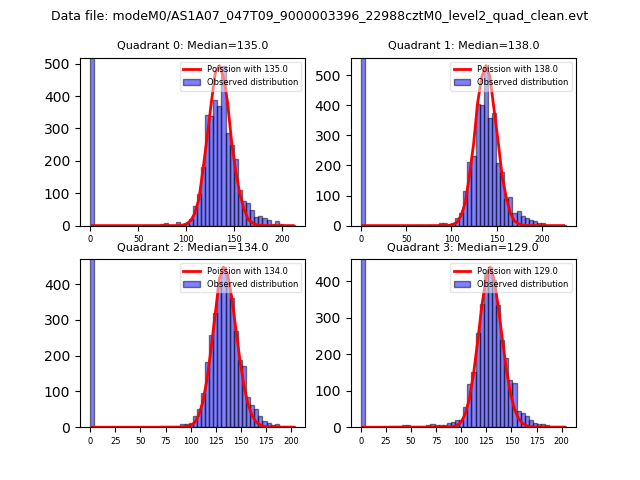
| Comparison with Poisson distribution Blue bars denote a histogram of data divided into 1 sec bins. Red curve is a Poisson curve with rate = median count rate of data. |
 |
 |
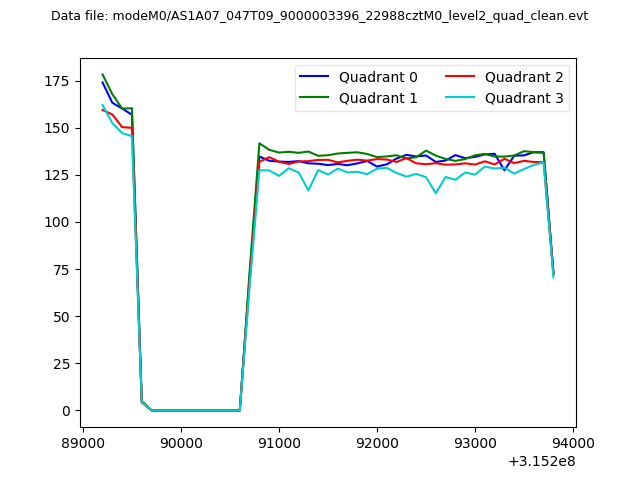
| Quadrant-wise count rates Data is divided into 100 sec bins |
 |
|
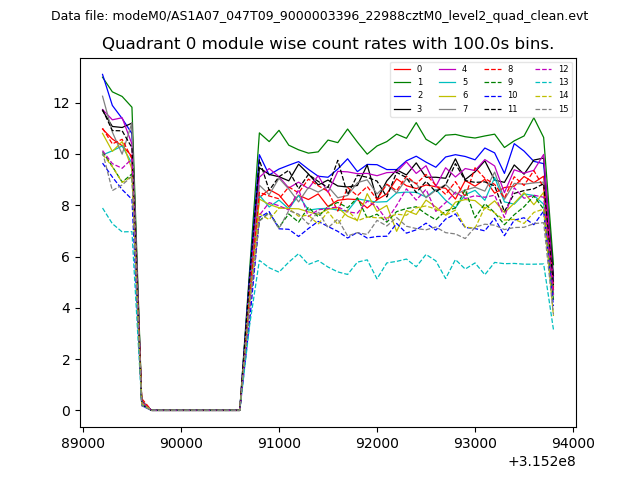
| Module-wise count rates for Quadrant A Data is divided into 100 sec bins |
 |
 |
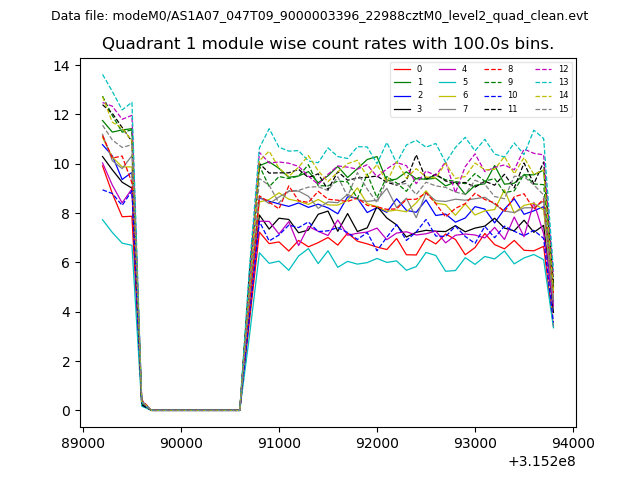
| Module-wise count rates for Quadrant B Data is divided into 100 sec bins |
 |
 |
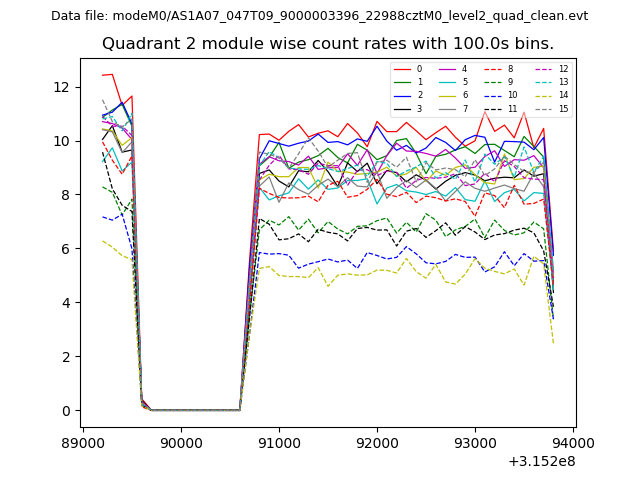
| Module-wise count rates for Quadrant C Data is divided into 100 sec bins |
 |
 |
| Module-wise count rates for Quadrant D Data is divided into 100 sec bins |
 |
 |
| Parameter | Plot |
|---|---|
| CZT HV Monitor | 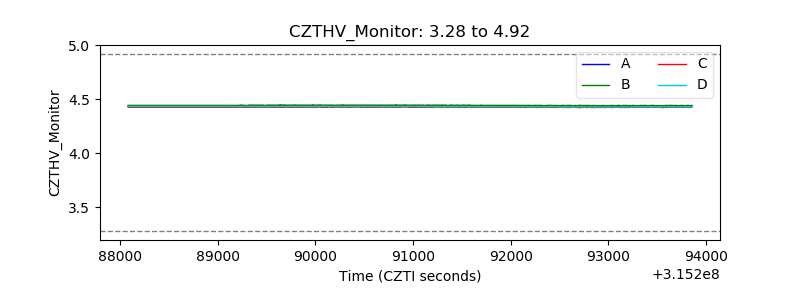 |
| D_VDD |  |
| Temperature 1 |  |
| Veto HV Monitor |  |
| Veto LLD |  |
| Alpha Counter | 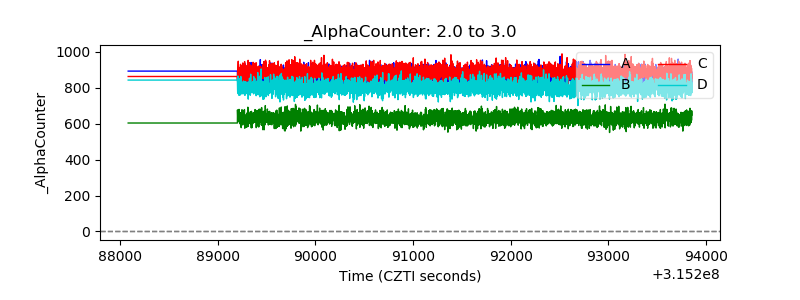 |
| _CPM_Rate | 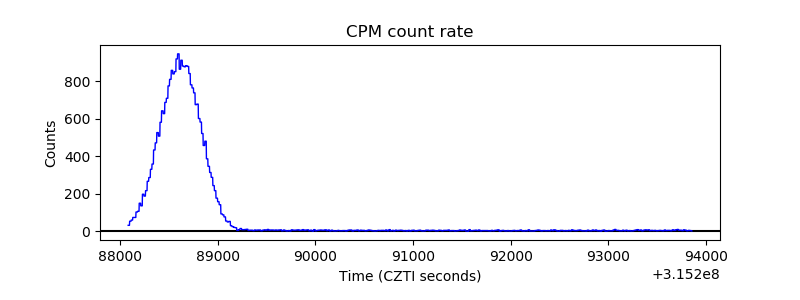 |
| CZT Counter |  |
| +2.5 Volts monitor |  |
| +5 Volts monitor |  |
| _ROLL_ROT |  |
| _Roll_DEC |  |
| _Roll_RA |  |
| Veto Counter | 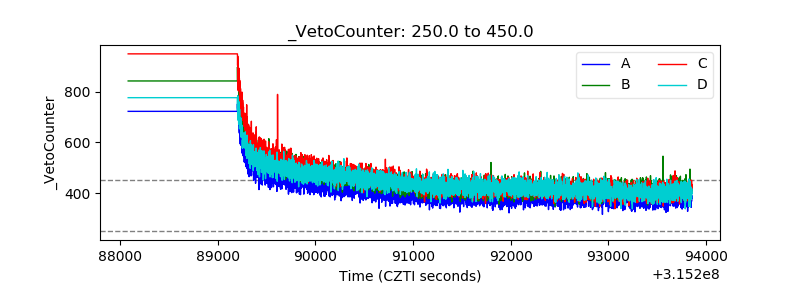 |