| Param | Original file | Final file |
|---|---|---|
| Filename | modeM0/AS1A07_091T04_9000003394cztM0_level2.fits | modeM0/AS1A07_091T04_9000003394cztM0_level2_quad_clean.evt |
| Size (bytes) | 279,766,080 | 257,679,360 |
| Size | 266.8 MB | 245.7 MB |
| Events in quadrant A | 1,723,912 | 1,547,383 |
| Events in quadrant B | 1,560,120 | 1,353,071 |
| Events in quadrant C | 1,676,636 | 1,488,241 |
| Events in quadrant D | 1,452,122 | 1,356,302 |
| Mode SS | |||
|---|---|---|---|
| Quadrant | BADHDUFLAG | Total packets | Discarded packets |
| A | 0 | 614 | 0 |
| B | 0 | 614 | 0 |
| C | 0 | 614 | 0 |
| D | 0 | 614 | 0 |
| Mode M0 | |||
|---|---|---|---|
| Quadrant | BADHDUFLAG | Total packets | Discarded packets |
| A | 0 | 61451 | 0 |
| B | 0 | 82448 | 0 |
| C | 0 | 62079 | 0 |
| D | 0 | 75424 | 0 |
| Mode M9 | |||
|---|---|---|---|
| Quadrant | BADHDUFLAG | Total packets | Discarded packets |
| A | 0 | 39 | 0 |
| B | 0 | 39 | 0 |
| C | 0 | 39 | 0 |
| D | 0 | 39 | 0 |
| Quadrant | Total seconds | Saturated seconds | Saturation percentage |
|---|---|---|---|
| A | 29941 | 324 | 1.082128% |
| B | 29941 | 3205 | 10.704385% |
| C | 29941 | 499 | 1.666611% |
| D | 29941 | 1112 | 3.713971% |
Noise dominated data is calculated using 1-second bins in cleaned event files. If a bin has >2000 counts, and if more than 50% of those come from <1% of pixels, then it is considered to be noise-dominated and hence unusable.
| Quadrant | # 1 sec bins | Bins with >0 counts | Bins with >2000 counts | High rate bins dominated by noise | Noise dominated (total time) | Noise dominated (detector-on time) | Marked lightcurve |
|---|---|---|---|---|---|---|---|
| A | 33881 | 29942 | 0 | 0 | 0.00% | 0.00% |  |
| B | 33881 | 29930 | 0 | 0 | 0.00% | 0.00% | 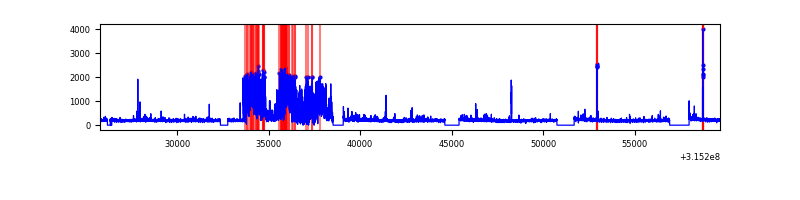 |
| C | 33881 | 29943 | 0 | 0 | 0.00% | 0.00% |  |
| D | 33881 | 29923 | 0 | 0 | 0.00% | 0.00% |  |
Top three noisy pixels from each quadrant. If the there are fewer than three noisy pixels in the level2.evt file, extra rows are filled as -1
| Pixel properties | Quadrant properties | ||||||
|---|---|---|---|---|---|---|---|
| Quadrant | DetID | PixID | Counts | Sigma | Mean | Median | Sigma |
| A | 0 | 29 | 1630 | 10.55 | 448 | 417 | 115.0 |
| A | 7 | 110 | 1344 | 8.06 | 448 | 417 | 115.0 |
| A | 9 | 19 | 1308 | 7.75 | 448 | 417 | 115.0 |
| B | 2 | 9 | 1249 | 10.4 | 412 | 392 | 82.4 |
| B | 2 | 8 | 1069 | 8.21 | 412 | 392 | 82.4 |
| B | 5 | 128 | 1040 | 7.86 | 412 | 392 | 82.4 |
| C | 2 | 191 | 1140 | 6.41 | 443 | 413 | 113.4 |
| C | 3 | 158 | 1132 | 6.34 | 443 | 413 | 113.4 |
| C | 9 | 209 | 1126 | 6.29 | 443 | 413 | 113.4 |
| D | 3 | 14 | 1077 | 6.22 | 415 | 377 | 112.5 |
| D | 13 | 238 | 1070 | 6.16 | 415 | 377 | 112.5 |
| D | 7 | 3 | 1020 | 5.72 | 415 | 377 | 112.5 |
Histogram calculated using DETX and DETY for each event in the final _common_clean file
| Quadrant A |  |
 |
Quadrant B |
|---|---|---|---|
| Quadrant D |  |
 |
Quadrant C |
| Plot type | Count rate plots | Images |
|---|---|---|
| Comparison with Poisson distribution Blue bars denote a histogram of data divided into 1 sec bins. Red curve is a Poisson curve with rate = median count rate of data. |
 |
 |
| Quadrant-wise count rates Data is divided into 100 sec bins |
 |
|
| Module-wise count rates for Quadrant A Data is divided into 100 sec bins |
 |
 |
| Module-wise count rates for Quadrant B Data is divided into 100 sec bins |
 |
 |
| Module-wise count rates for Quadrant C Data is divided into 100 sec bins |
 |
 |
| Module-wise count rates for Quadrant D Data is divided into 100 sec bins |
 |
 |
| Parameter | Plot |
|---|---|
| CZT HV Monitor |  |
| D_VDD |  |
| Temperature 1 |  |
| Veto HV Monitor |  |
| Veto LLD |  |
| Alpha Counter |  |
| _CPM_Rate |  |
| CZT Counter |  |
| +2.5 Volts monitor |  |
| +5 Volts monitor |  |
| _ROLL_ROT |  |
| _Roll_DEC |  |
| _Roll_RA |  |
| Veto Counter |  |