| Param | Original file | Final file |
|---|---|---|
| Filename | modeM0/AS1A07_091T04_9000003394_22976cztM0_level2.evt | modeM0/AS1A07_091T04_9000003394_22976cztM0_level2_quad_clean.evt |
| Size (bytes) | 129,847,680 | 33,045,120 |
| Size | 123.8 MB | 31.5 MB |
| Events in quadrant A | 954,781 | 216,381 |
| Events in quadrant B | 958,570 | 223,960 |
| Events in quadrant C | 949,705 | 211,444 |
| Events in quadrant D | 936,058 | 208,628 |
| Mode SS | |||
|---|---|---|---|
| Quadrant | BADHDUFLAG | Total packets | Discarded packets |
| A | 0 | 44 | 0 |
| B | 0 | 44 | 0 |
| C | 0 | 44 | 0 |
| D | 0 | 44 | 0 |
| Mode M0 | |||
|---|---|---|---|
| Quadrant | BADHDUFLAG | Total packets | Discarded packets |
| A | 0 | 4090 | 1 |
| B | 0 | 4111 | 1 |
| C | 0 | 4102 | 1 |
| D | 0 | 4111 | 1 |
| Mode M9 | |||
|---|---|---|---|
| Quadrant | BADHDUFLAG | Total packets | Discarded packets |
| A | 0 | 2 | 0 |
| B | 0 | 2 | 0 |
| C | 0 | 2 | 0 |
| D | 0 | 2 | 0 |
| Quadrant | Total seconds | Saturated seconds | Saturation percentage |
|---|---|---|---|
| A | 1913 | 122 | 6.377418% |
| B | 1913 | 139 | 7.266074% |
| C | 1913 | 135 | 7.056979% |
| D | 1913 | 92 | 4.809200% |
Noise dominated data is calculated using 1-second bins in cleaned event files. If a bin has >2000 counts, and if more than 50% of those come from <1% of pixels, then it is considered to be noise-dominated and hence unusable.
| Quadrant | # 1 sec bins | Bins with >0 counts | Bins with >2000 counts | High rate bins dominated by noise | Noise dominated (total time) | Noise dominated (detector-on time) | Marked lightcurve |
|---|---|---|---|---|---|---|---|
| A | 2108 | 1916 | 0 | 0 | 0.00% | 0.00% | 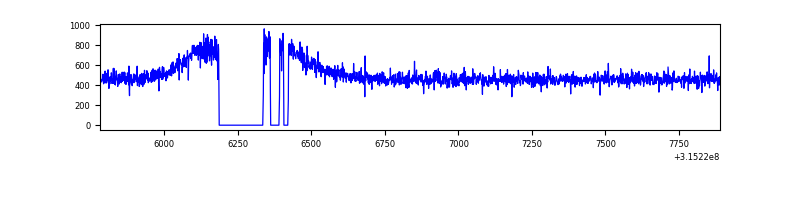 |
| B | 2108 | 1916 | 1 | 1 | 0.05% | 0.05% | 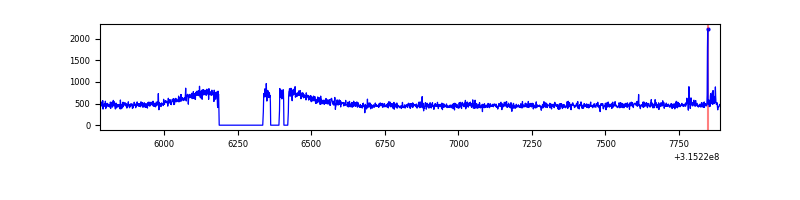 |
| C | 2108 | 1916 | 0 | 0 | 0.00% | 0.00% | 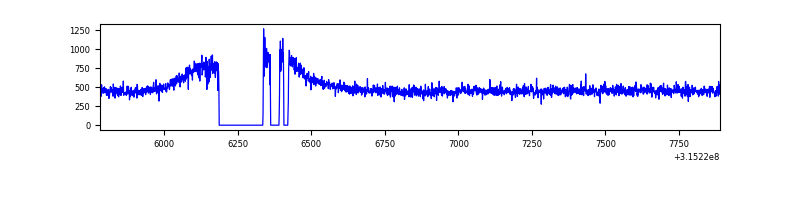 |
| D | 2108 | 1916 | 1 | 1 | 0.05% | 0.05% | 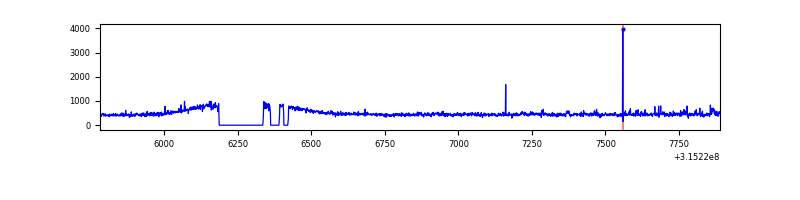 |
Top three noisy pixels from each quadrant. If the there are fewer than three noisy pixels in the level2.evt file, extra rows are filled as -1
| Pixel properties | Quadrant properties | ||||||
|---|---|---|---|---|---|---|---|
| Quadrant | DetID | PixID | Counts | Sigma | Mean | Median | Sigma |
| A | 13 | 170 | 3247 | 58.29 | 246 | 240 | 51.6 |
| A | 13 | 254 | 3226 | 57.88 | 246 | 240 | 51.6 |
| A | 3 | 137 | 2336 | 40.63 | 246 | 240 | 51.6 |
| B | 12 | 111 | 5917 | 116.09 | 240 | 233 | 49.0 |
| B | 11 | 111 | 5396 | 105.45 | 240 | 233 | 49.0 |
| B | 0 | 189 | 4916 | 95.65 | 240 | 233 | 49.0 |
| C | 14 | 238 | 35084 | 629.31 | 230 | 229 | 55.4 |
| C | 0 | 10 | 12268 | 217.36 | 230 | 229 | 55.4 |
| C | 0 | 239 | 4420 | 75.67 | 230 | 229 | 55.4 |
| D | 1 | 52 | 23780 | 398.19 | 237 | 229 | 59.1 |
| D | 2 | 234 | 6879 | 112.43 | 237 | 229 | 59.1 |
| D | 13 | 153 | 5512 | 89.32 | 237 | 229 | 59.1 |
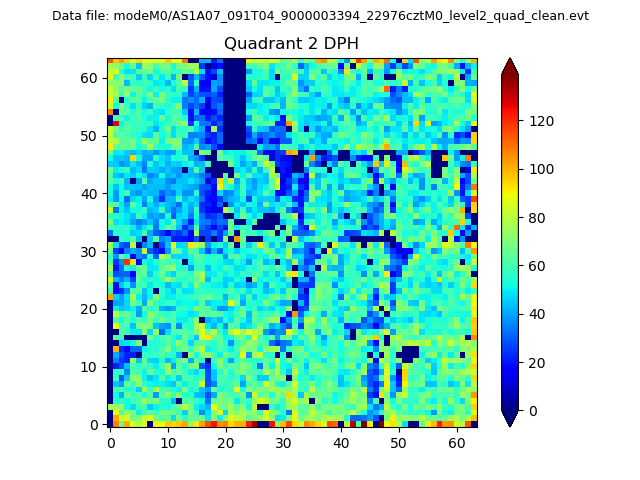
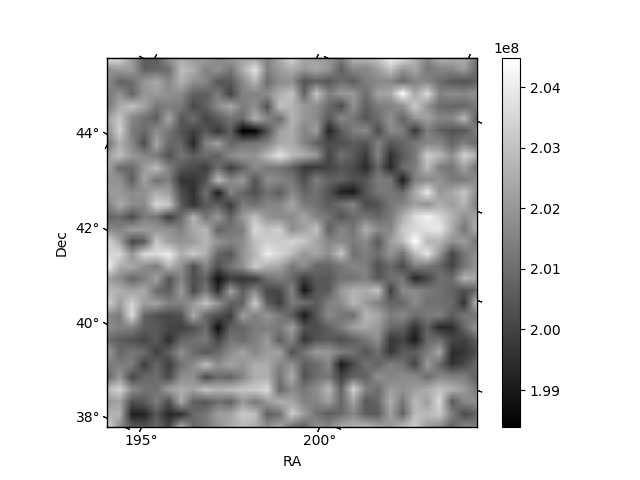
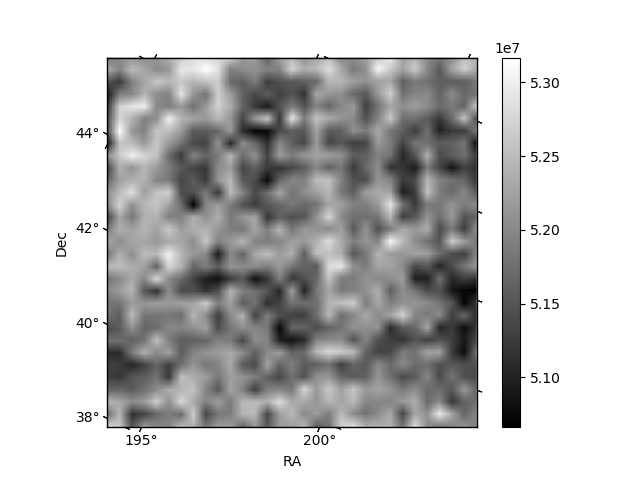
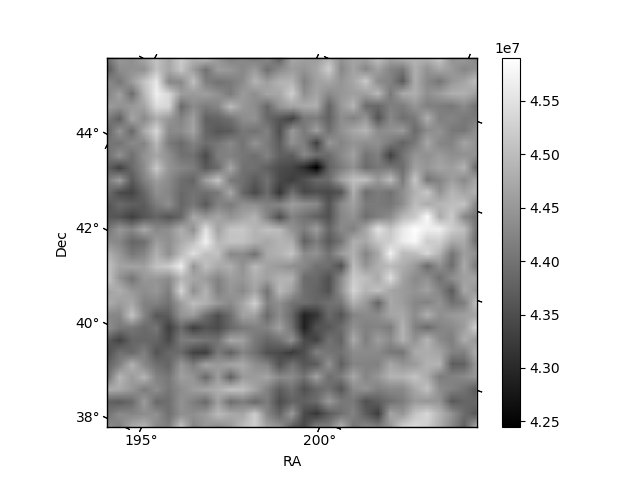
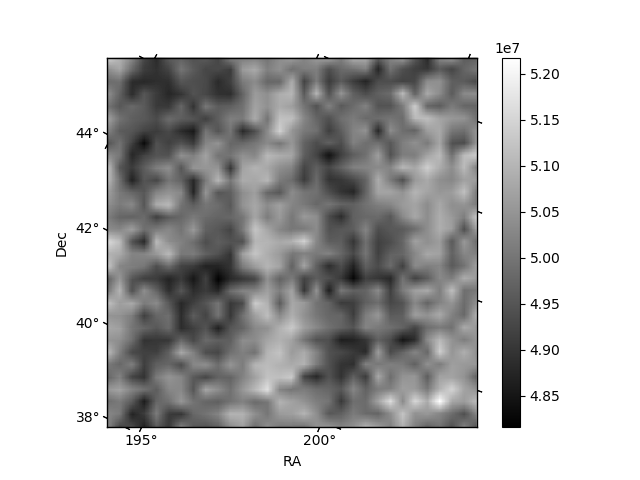
Histogram calculated using DETX and DETY for each event in the final _common_clean file
| Quadrant A | 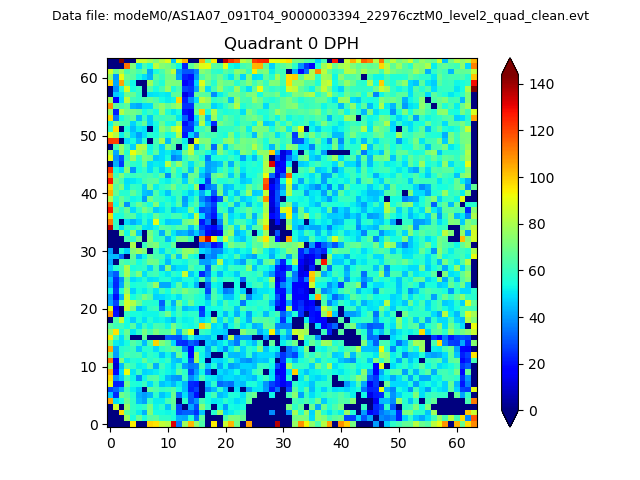 |
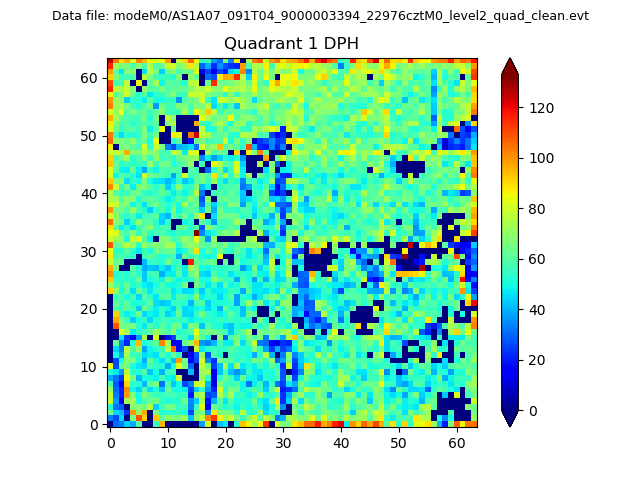 |
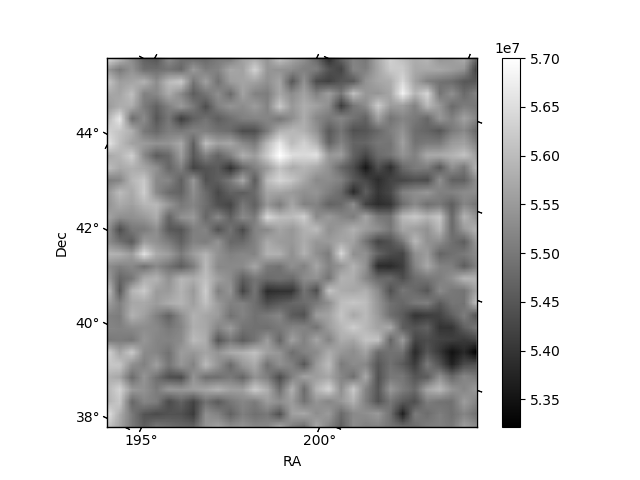
Quadrant B |
|---|---|---|---|
| Quadrant D | 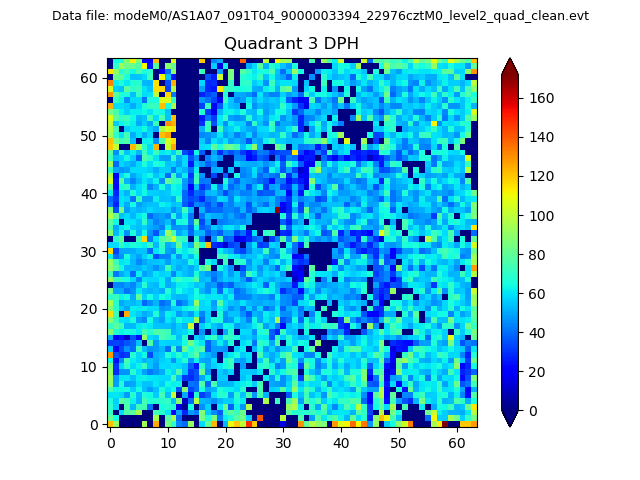 |
 |
Quadrant C |
| Plot type | Count rate plots | Images |
|---|---|---|
| Comparison with Poisson distribution Blue bars denote a histogram of data divided into 1 sec bins. Red curve is a Poisson curve with rate = median count rate of data. |
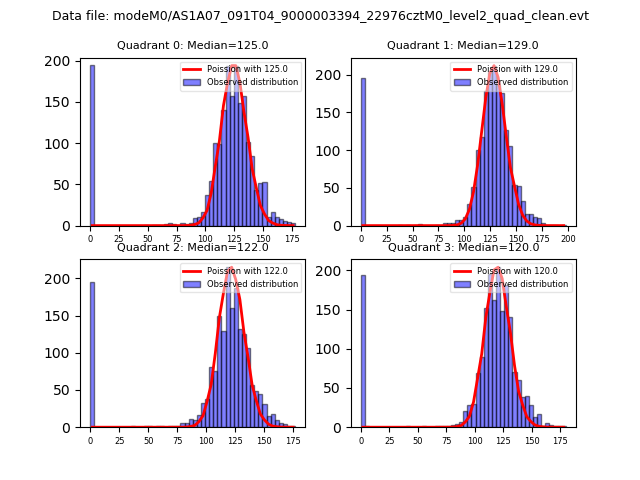 |
 |
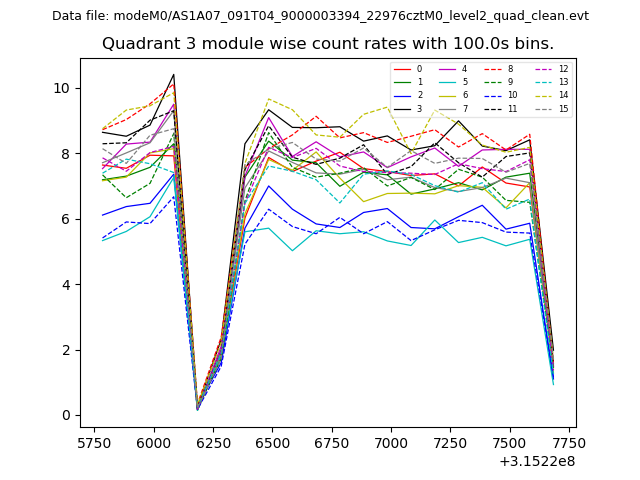
| Quadrant-wise count rates Data is divided into 100 sec bins |
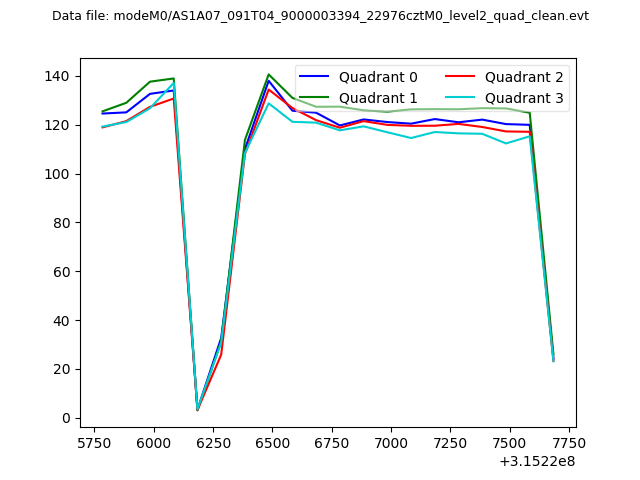 |
|
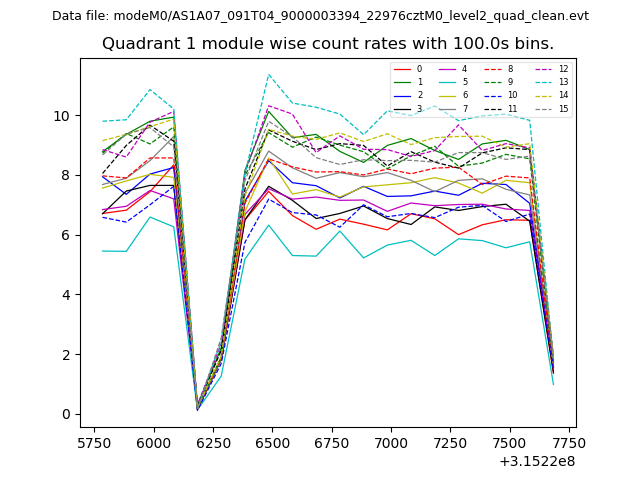
| Module-wise count rates for Quadrant A Data is divided into 100 sec bins |
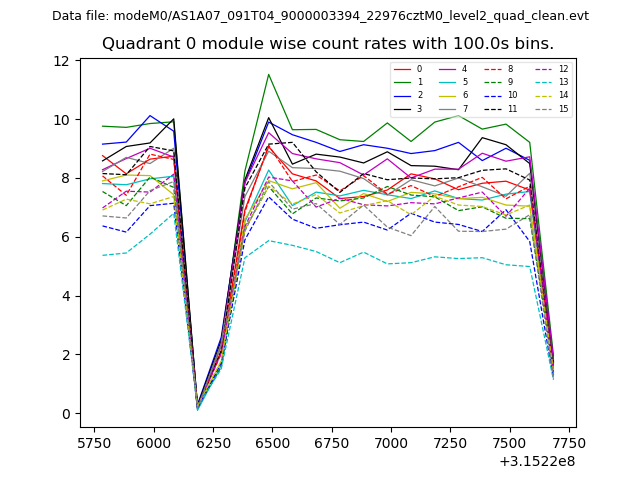 |
 |
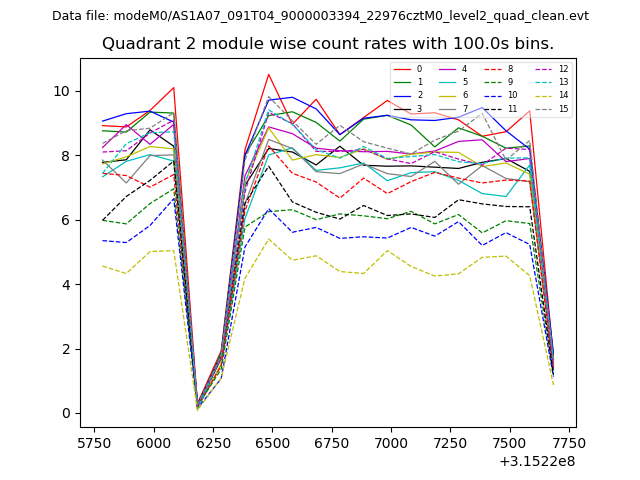
| Module-wise count rates for Quadrant B Data is divided into 100 sec bins |
 |
 |
| Module-wise count rates for Quadrant C Data is divided into 100 sec bins |
 |
 |
| Module-wise count rates for Quadrant D Data is divided into 100 sec bins |
 |
 |
| Parameter | Plot |
|---|---|
| CZT HV Monitor | 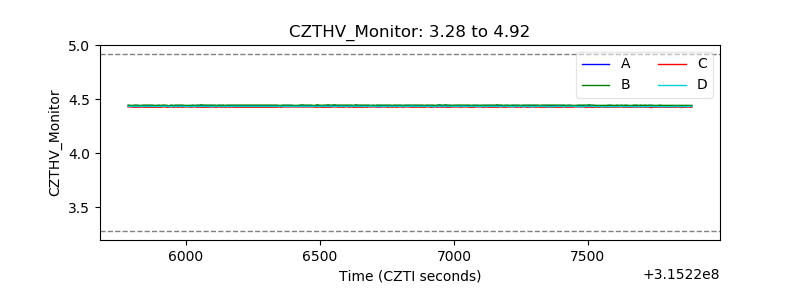 |
| D_VDD |  |
| Temperature 1 | 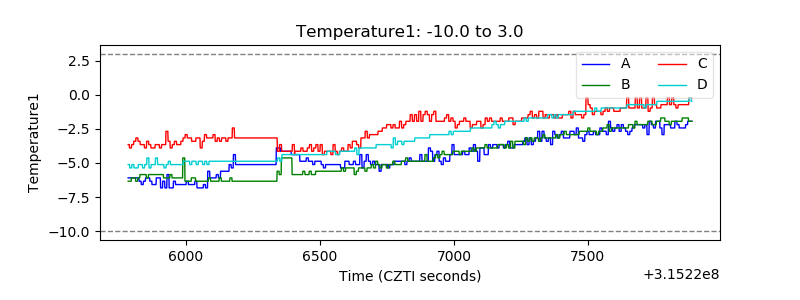 |
| Veto HV Monitor | 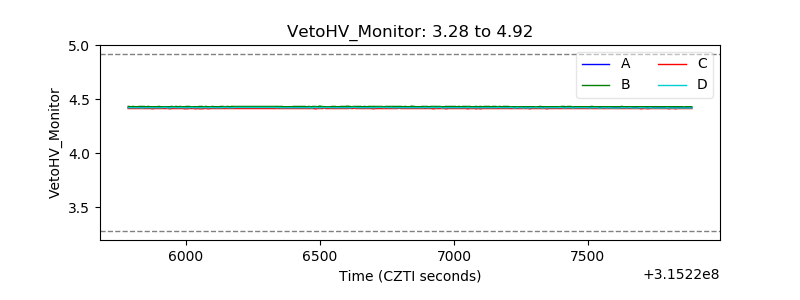 |
| Veto LLD | 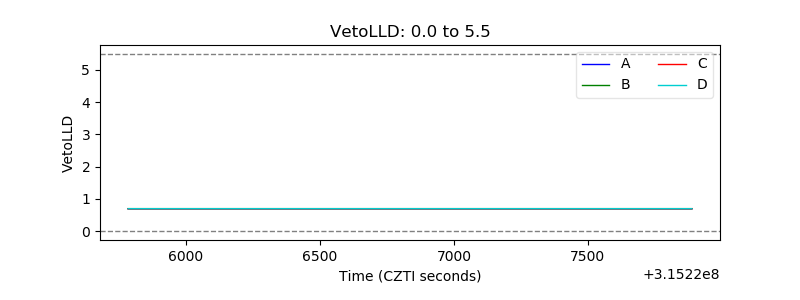 |
| Alpha Counter | 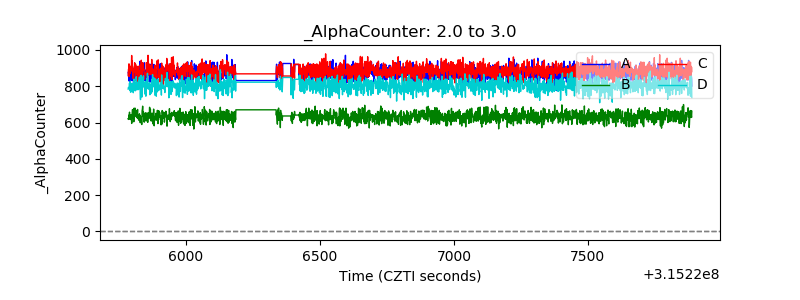 |
| _CPM_Rate | 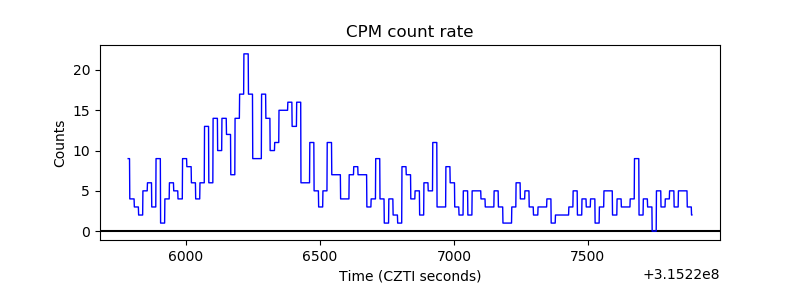 |
| CZT Counter | 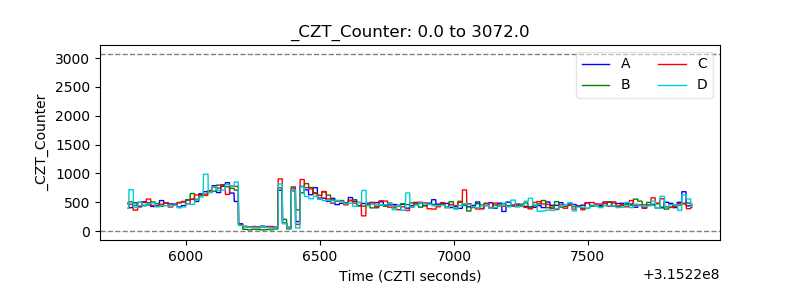 |
| +2.5 Volts monitor |  |
| +5 Volts monitor |  |
| _ROLL_ROT | 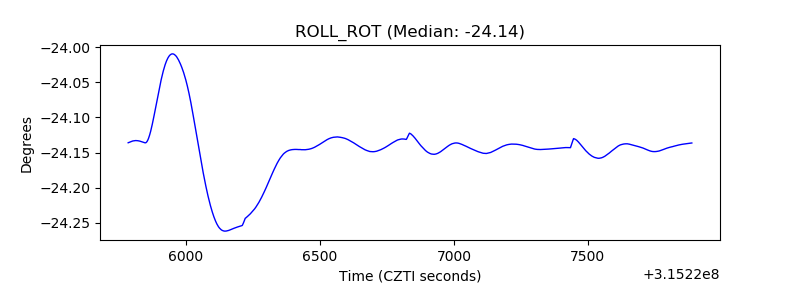 |
| _Roll_DEC | 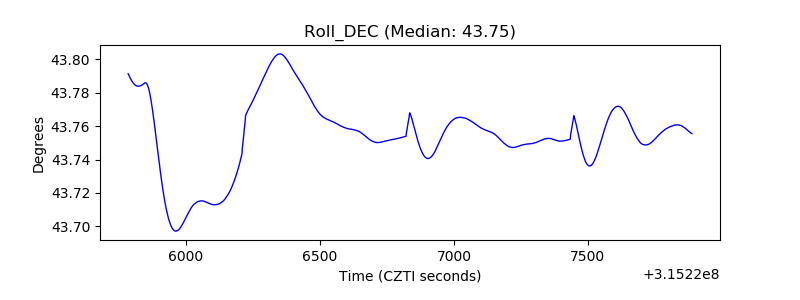 |
| _Roll_RA |  |
| Veto Counter | 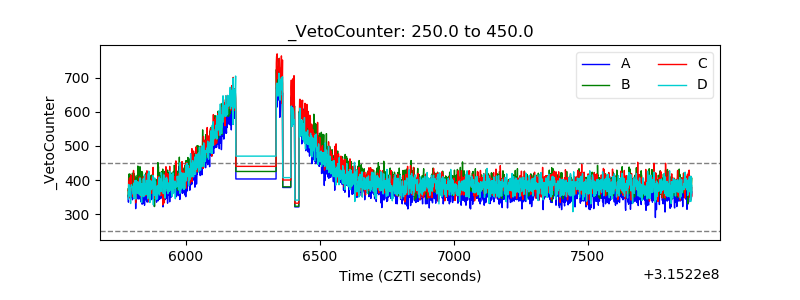 |