| Param | Original file | Final file |
|---|---|---|
| Filename | modeM0/AS1A07_091T04_9000003394_22979cztM0_level2.evt | modeM0/AS1A07_091T04_9000003394_22979cztM0_level2_quad_clean.evt |
| Size (bytes) | 931,253,760 | 116,697,600 |
| Size | 888.1 MB | 111.3 MB |
| Events in quadrant A | 4,685,875 | 754,878 |
| Events in quadrant B | 11,571,383 | 608,110 |
| Events in quadrant C | 4,733,782 | 734,605 |
| Events in quadrant D | 6,515,094 | 721,833 |
| Mode SS | |||
|---|---|---|---|
| Quadrant | BADHDUFLAG | Total packets | Discarded packets |
| A | 0 | 208 | 0 |
| B | 0 | 208 | 0 |
| C | 0 | 208 | 0 |
| D | 0 | 208 | 0 |
| Mode M0 | |||
|---|---|---|---|
| Quadrant | BADHDUFLAG | Total packets | Discarded packets |
| A | 0 | 20828 | 1 |
| B | 0 | 41190 | 1 |
| C | 0 | 20891 | 1 |
| D | 0 | 26444 | 2 |
| Mode M9 | |||
|---|---|---|---|
| Quadrant | BADHDUFLAG | Total packets | Discarded packets |
| A | 0 | 5 | 0 |
| B | 0 | 5 | 0 |
| C | 0 | 5 | 0 |
| D | 0 | 5 | 0 |
| Quadrant | Total seconds | Saturated seconds | Saturation percentage |
|---|---|---|---|
| A | 10302 | 71 | 0.689187% |
| B | 10303 | 2871 | 27.865670% |
| C | 10303 | 120 | 1.164709% |
| D | 10302 | 349 | 3.387692% |
Noise dominated data is calculated using 1-second bins in cleaned event files. If a bin has >2000 counts, and if more than 50% of those come from <1% of pixels, then it is considered to be noise-dominated and hence unusable.
| Quadrant | # 1 sec bins | Bins with >0 counts | Bins with >2000 counts | High rate bins dominated by noise | Noise dominated (total time) | Noise dominated (detector-on time) | Marked lightcurve |
|---|---|---|---|---|---|---|---|
| A | 10857 | 10303 | 0 | 0 | 0.00% | 0.00% | 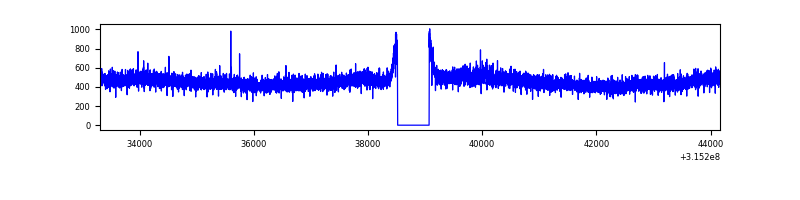 |
| B | 10858 | 10304 | 2359 | 2359 | 21.73% | 22.89% | 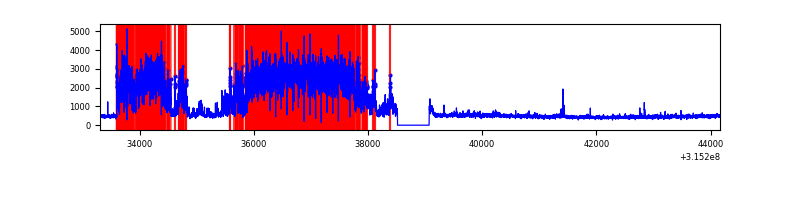 |
| C | 10858 | 10304 | 0 | 0 | 0.00% | 0.00% | 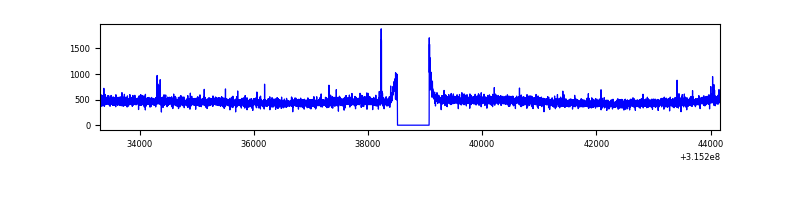 |
| D | 10857 | 10303 | 190 | 190 | 1.75% | 1.84% | 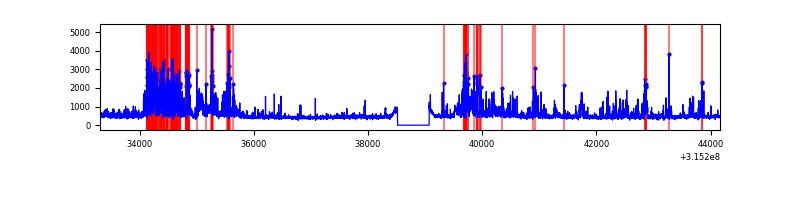 |
Top three noisy pixels from each quadrant. If the there are fewer than three noisy pixels in the level2.evt file, extra rows are filled as -1
| Pixel properties | Quadrant properties | ||||||
|---|---|---|---|---|---|---|---|
| Quadrant | DetID | PixID | Counts | Sigma | Mean | Median | Sigma |
| A | 13 | 170 | 40374 | 160.17 | 1205 | 1176 | 244.7 |
| A | 13 | 254 | 15733 | 59.48 | 1205 | 1176 | 244.7 |
| A | 3 | 137 | 11004 | 40.16 | 1205 | 1176 | 244.7 |
| B | 5 | 31 | 5408248 | 27004.67 | 1041 | 1014 | 200.2 |
| B | 5 | 15 | 1299604 | 6485.38 | 1041 | 1014 | 200.2 |
| B | 5 | 14 | 687075 | 3426.31 | 1041 | 1014 | 200.2 |
| C | 14 | 238 | 181397 | 667.97 | 1156 | 1163 | 269.8 |
| C | 7 | 247 | 27338 | 97.01 | 1156 | 1163 | 269.8 |
| C | 0 | 10 | 16085 | 55.3 | 1156 | 1163 | 269.8 |
| D | 1 | 52 | 914430 | 3234.49 | 1161 | 1124 | 282.4 |
| D | 12 | 233 | 761553 | 2693.07 | 1161 | 1124 | 282.4 |
| D | 13 | 153 | 198485 | 698.96 | 1161 | 1124 | 282.4 |
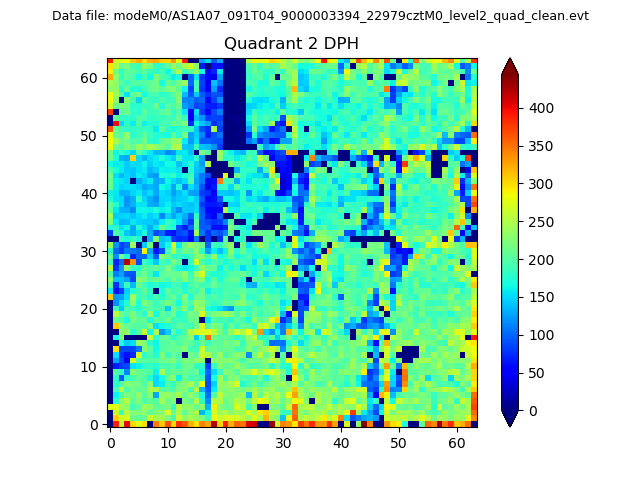
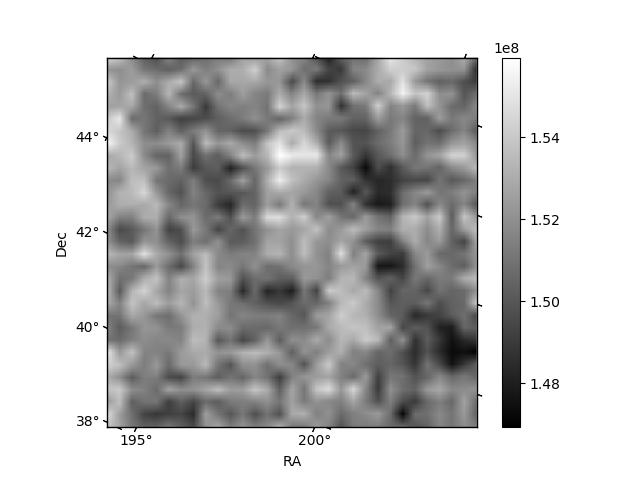
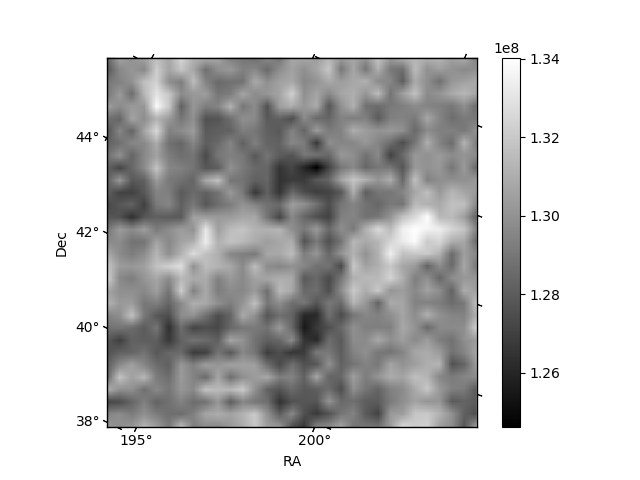
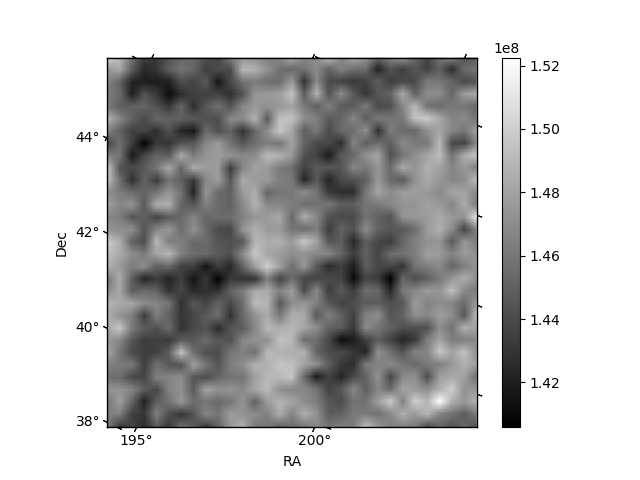
Histogram calculated using DETX and DETY for each event in the final _common_clean file
| Quadrant A | 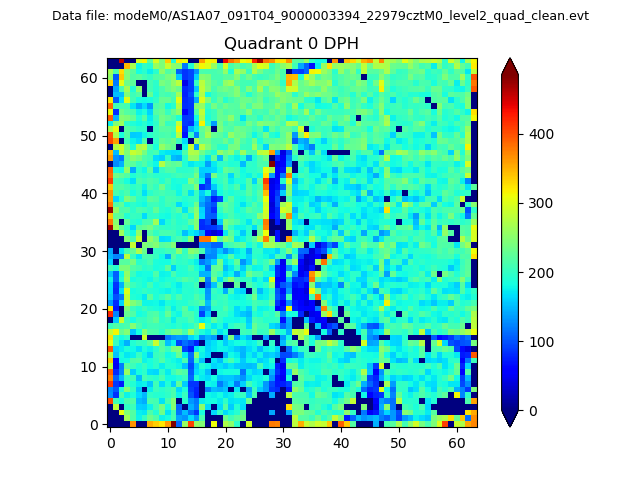 |
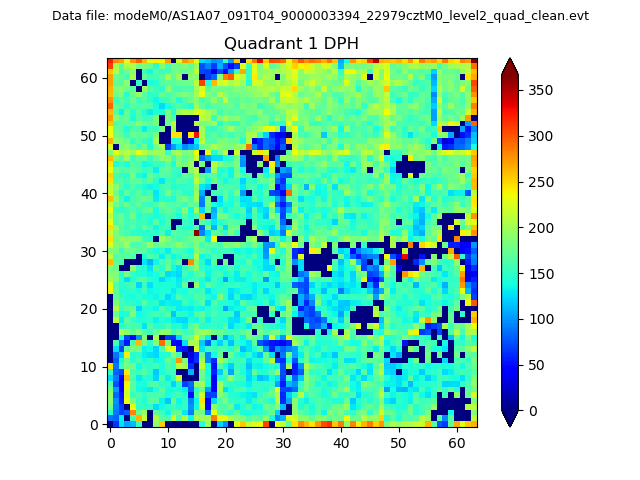 |
Quadrant B |
|---|---|---|---|
| Quadrant D | 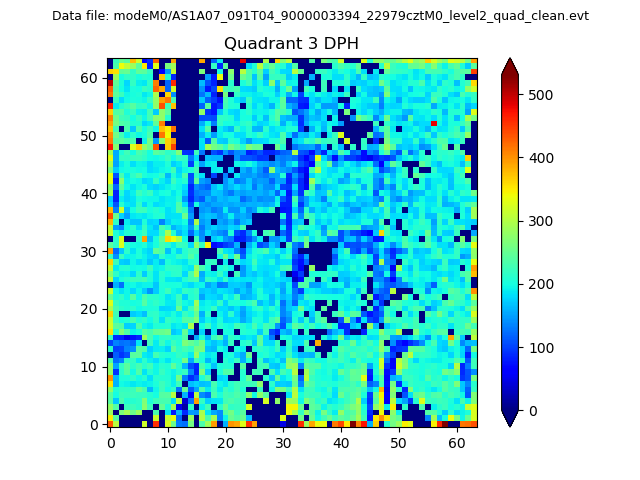 |
 |
Quadrant C |
| Plot type | Count rate plots | Images |
|---|---|---|
| Comparison with Poisson distribution Blue bars denote a histogram of data divided into 1 sec bins. Red curve is a Poisson curve with rate = median count rate of data. |
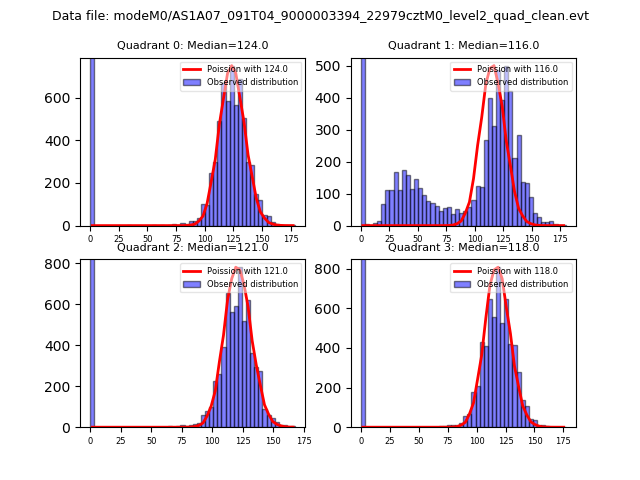 |
 |
| Quadrant-wise count rates Data is divided into 100 sec bins |
 |
|
| Module-wise count rates for Quadrant A Data is divided into 100 sec bins |
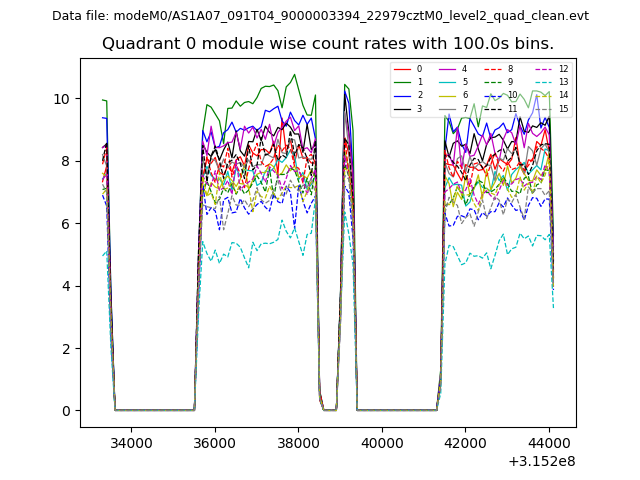 |
 |
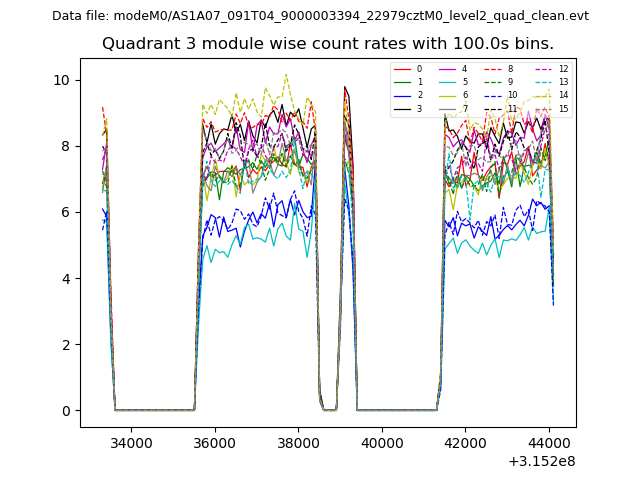
| Module-wise count rates for Quadrant B Data is divided into 100 sec bins |
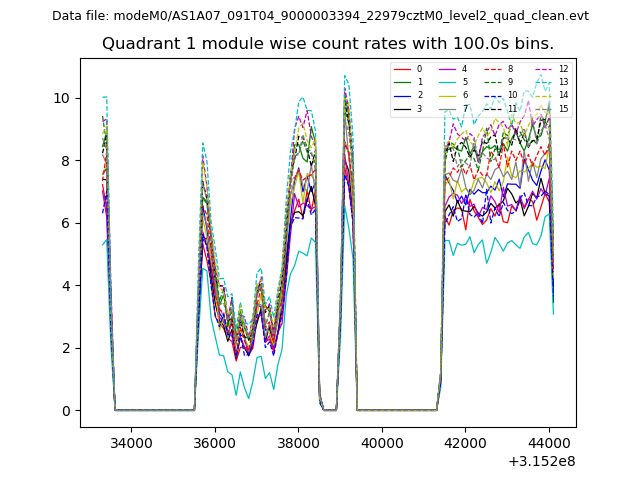 |
 |
| Module-wise count rates for Quadrant C Data is divided into 100 sec bins |
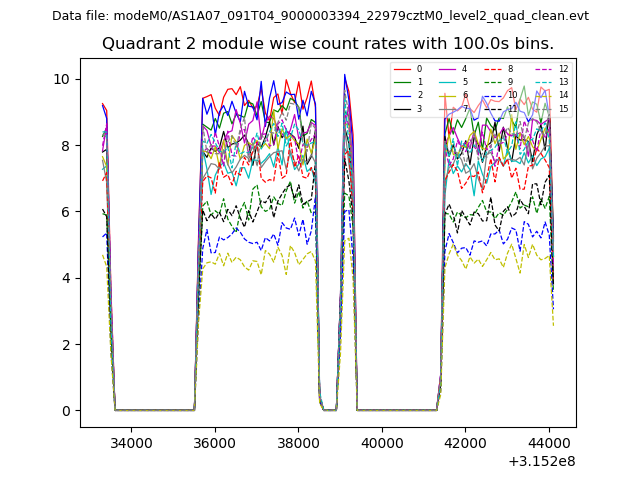 |
 |
| Module-wise count rates for Quadrant D Data is divided into 100 sec bins |
 |
 |
| Parameter | Plot |
|---|---|
| CZT HV Monitor | 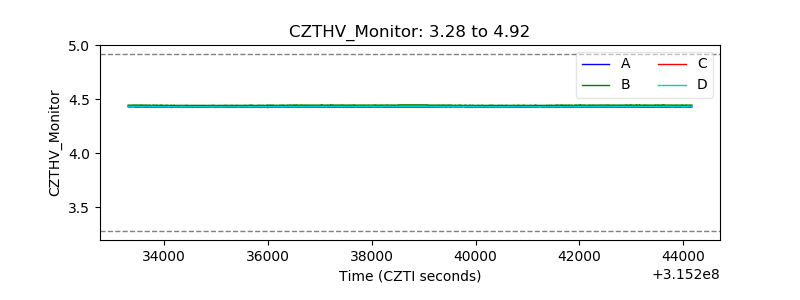 |
| D_VDD | 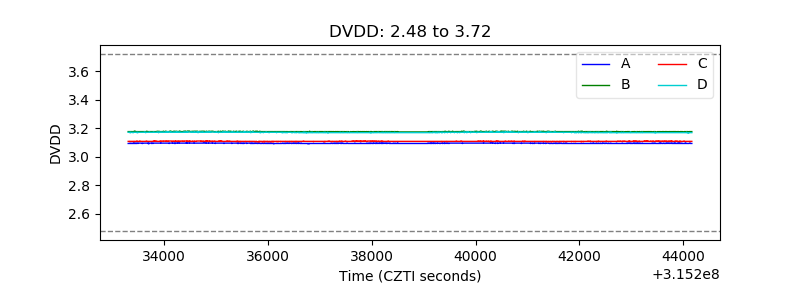 |
| Temperature 1 | 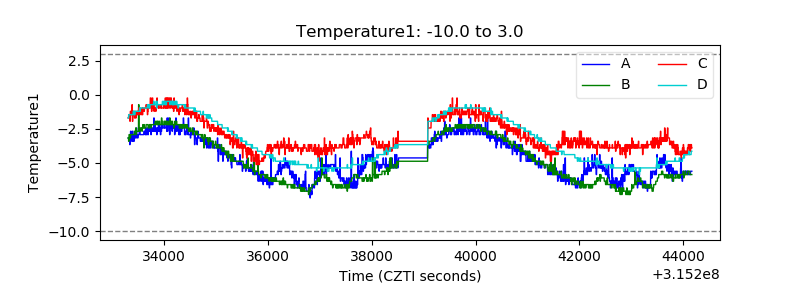 |
| Veto HV Monitor | 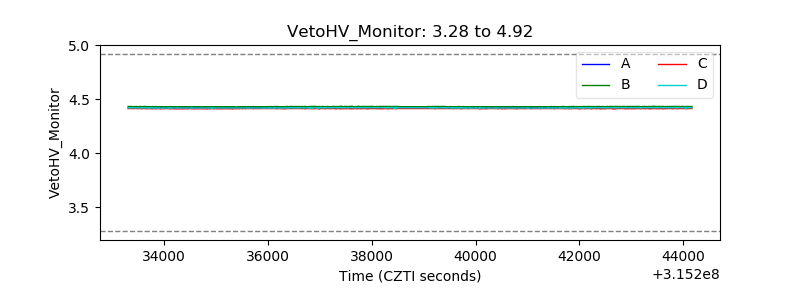 |
| Veto LLD | 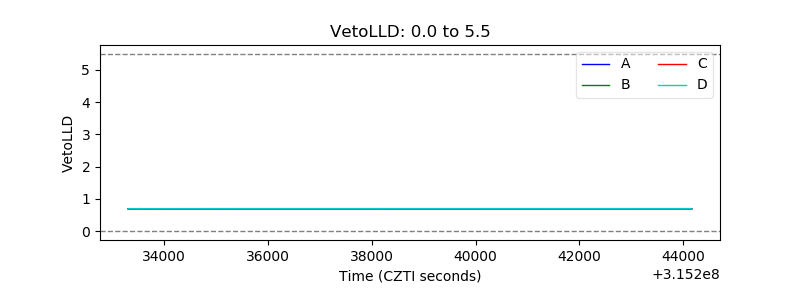 |
| Alpha Counter |  |
| _CPM_Rate | 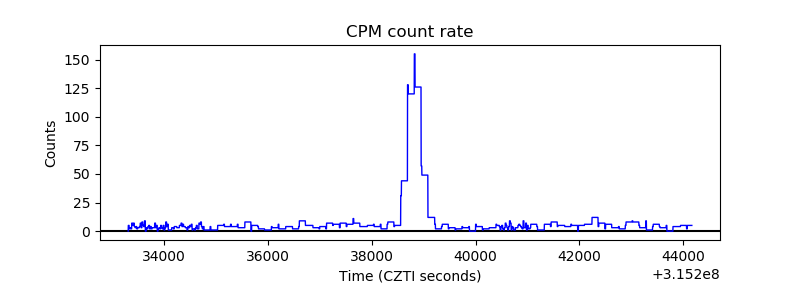 |
| CZT Counter | 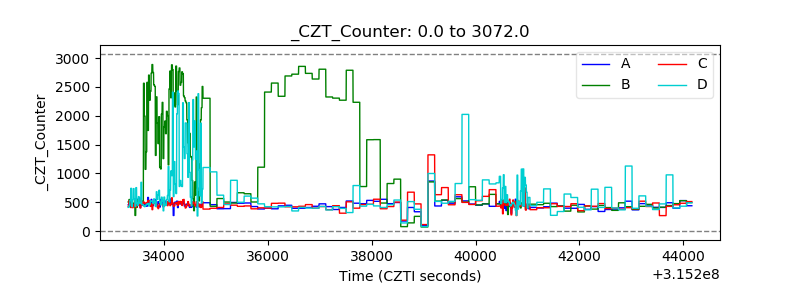 |
| +2.5 Volts monitor |  |
| +5 Volts monitor |  |
| _ROLL_ROT | 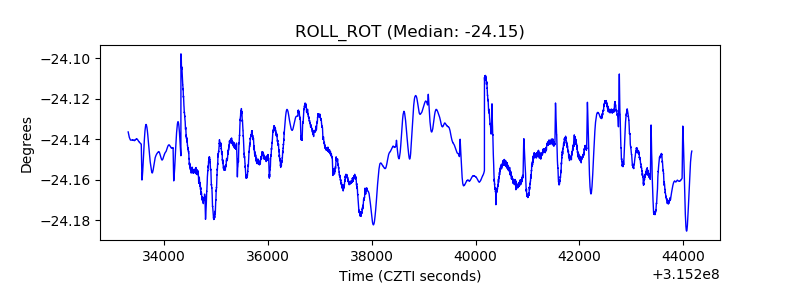 |
| _Roll_DEC | 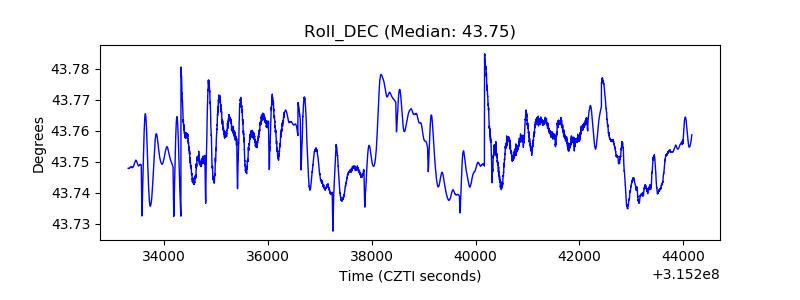 |
| _Roll_RA |  |
| Veto Counter | 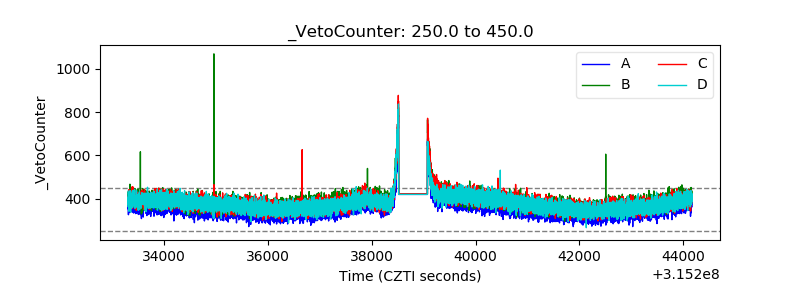 |