| Param | Original file | Final file |
|---|---|---|
| Filename | modeM0/AS1A08_004T03_9000003400cztM0_level2.fits | modeM0/AS1A08_004T03_9000003400cztM0_level2_quad_clean.evt |
| Size (bytes) | 999,855,360 | 876,395,520 |
| Size | 953.5 MB | 835.8 MB |
| Events in quadrant A | 6,168,948 | 5,135,999 |
| Events in quadrant B | 5,955,187 | 5,151,488 |
| Events in quadrant C | 5,988,780 | 4,854,130 |
| Events in quadrant D | 5,169,314 | 4,401,963 |
| Mode M0 | |||
|---|---|---|---|
| Quadrant | BADHDUFLAG | Total packets | Discarded packets |
| A | 0 | 211425 | 0 |
| B | 0 | 217011 | 0 |
| C | 0 | 218893 | 0 |
| D | 0 | 266705 | 0 |
| Mode SS | |||
|---|---|---|---|
| Quadrant | BADHDUFLAG | Total packets | Discarded packets |
| A | 0 | 2096 | 0 |
| B | 0 | 2094 | 0 |
| C | 0 | 2088 | 0 |
| D | 0 | 2092 | 0 |
| Mode M9 | |||
|---|---|---|---|
| Quadrant | BADHDUFLAG | Total packets | Discarded packets |
| A | 0 | 165 | 0 |
| B | 0 | 166 | 0 |
| C | 0 | 166 | 0 |
| D | 0 | 166 | 0 |
| Quadrant | Total seconds | Saturated seconds | Saturation percentage |
|---|---|---|---|
| A | 102046 | 1174 | 1.150462% |
| B | 102081 | 1725 | 1.689835% |
| C | 102056 | 2302 | 2.255624% |
| D | 102017 | 3458 | 3.389631% |
Noise dominated data is calculated using 1-second bins in cleaned event files. If a bin has >2000 counts, and if more than 50% of those come from <1% of pixels, then it is considered to be noise-dominated and hence unusable.
| Quadrant | # 1 sec bins | Bins with >0 counts | Bins with >2000 counts | High rate bins dominated by noise | Noise dominated (total time) | Noise dominated (detector-on time) | Marked lightcurve |
|---|---|---|---|---|---|---|---|
| A | 127549 | 102171 | 0 | 0 | 0.00% | 0.00% |  |
| B | 127549 | 102200 | 0 | 0 | 0.00% | 0.00% | 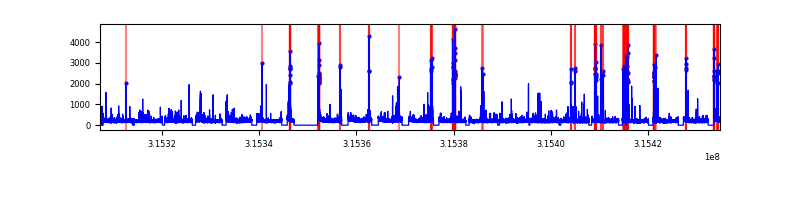 |
| C | 127549 | 102172 | 0 | 0 | 0.00% | 0.00% |  |
| D | 127549 | 102129 | 0 | 0 | 0.00% | 0.00% |  |
Top three noisy pixels from each quadrant. If the there are fewer than three noisy pixels in the level2.evt file, extra rows are filled as -1
| Pixel properties | Quadrant properties | ||||||
|---|---|---|---|---|---|---|---|
| Quadrant | DetID | PixID | Counts | Sigma | Mean | Median | Sigma |
| A | 0 | 29 | 5749 | 10.77 | 1604 | 1500 | 394.7 |
| A | 7 | 110 | 4919 | 8.66 | 1604 | 1500 | 394.7 |
| A | 9 | 19 | 4663 | 8.01 | 1604 | 1500 | 394.7 |
| B | 2 | 9 | 4764 | 10.59 | 1571 | 1497 | 308.5 |
| B | 3 | 80 | 4031 | 8.21 | 1571 | 1497 | 308.5 |
| B | 2 | 8 | 3971 | 8.02 | 1571 | 1497 | 308.5 |
| C | 1 | 80 | 4488 | 7.41 | 1581 | 1478 | 406.1 |
| C | 1 | 81 | 4444 | 7.3 | 1581 | 1478 | 406.1 |
| C | 12 | 241 | 4297 | 6.94 | 1581 | 1478 | 406.1 |
| D | 3 | 14 | 3834 | 6.27 | 1481 | 1348 | 396.6 |
| D | 7 | 3 | 3611 | 5.71 | 1481 | 1348 | 396.6 |
| D | 13 | 238 | 3595 | 5.67 | 1481 | 1348 | 396.6 |
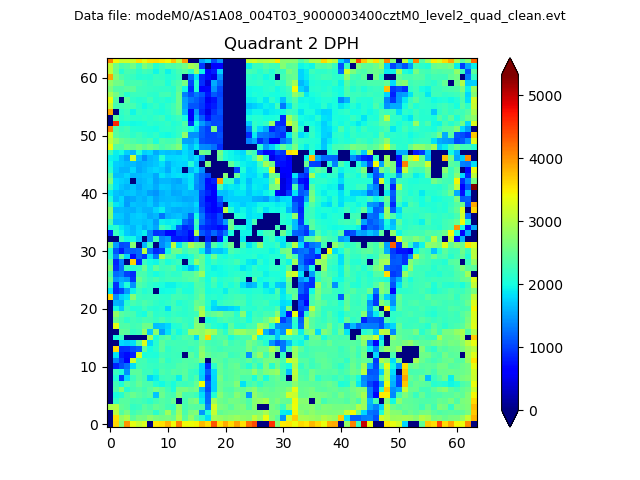
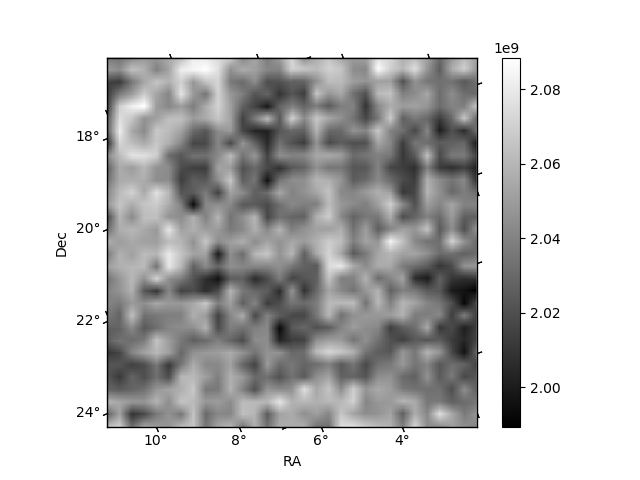
Histogram calculated using DETX and DETY for each event in the final _common_clean file
| Quadrant A | 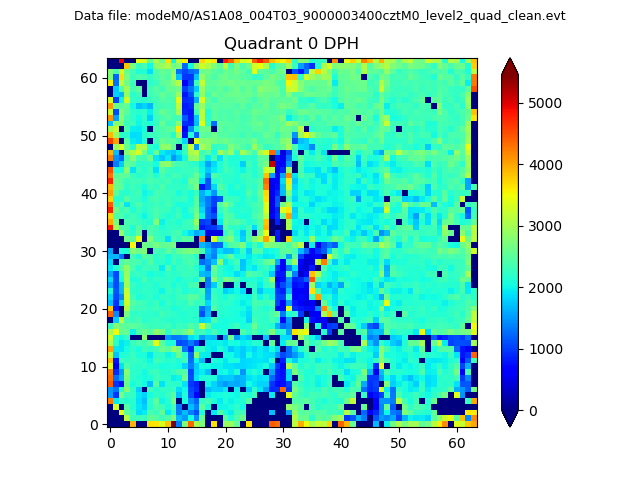 |
 |
Quadrant B |
|---|---|---|---|
| Quadrant D |  |
 |
Quadrant C |
| Plot type | Count rate plots | Images |
|---|---|---|
| Comparison with Poisson distribution Blue bars denote a histogram of data divided into 1 sec bins. Red curve is a Poisson curve with rate = median count rate of data. |
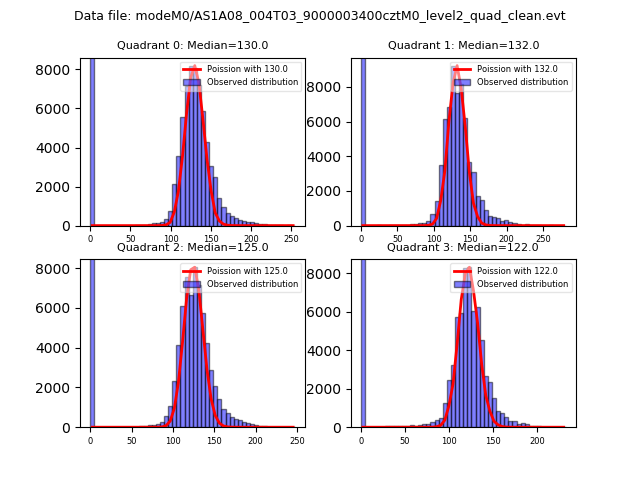 |
 |
| Quadrant-wise count rates Data is divided into 100 sec bins |
 |
|
| Module-wise count rates for Quadrant A Data is divided into 100 sec bins |
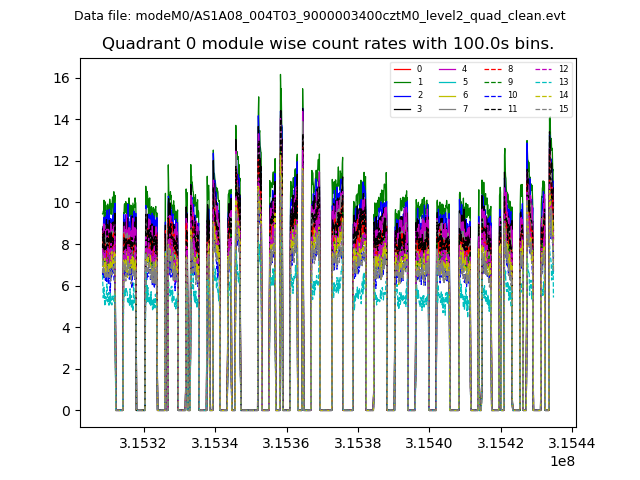 |
 |
| Module-wise count rates for Quadrant B Data is divided into 100 sec bins |
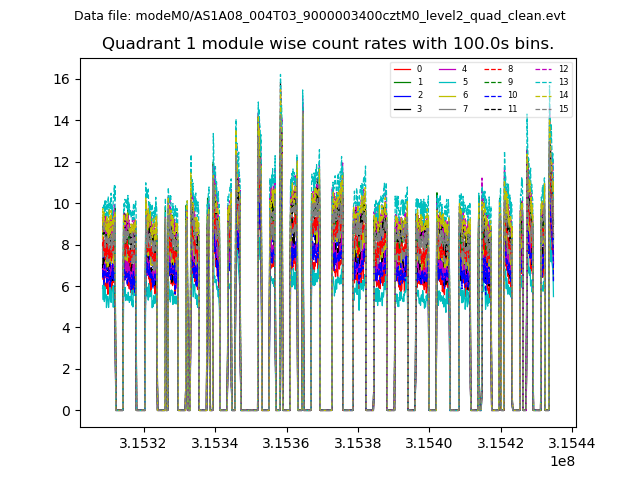 |
 |
| Module-wise count rates for Quadrant C Data is divided into 100 sec bins |
 |
 |
| Module-wise count rates for Quadrant D Data is divided into 100 sec bins |
 |
 |
| Parameter | Plot |
|---|---|
| CZT HV Monitor | 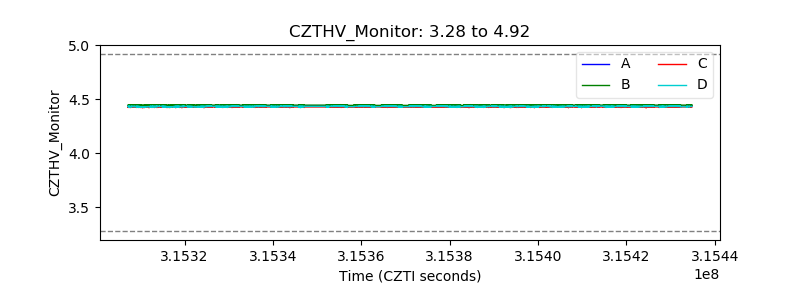 |
| D_VDD | 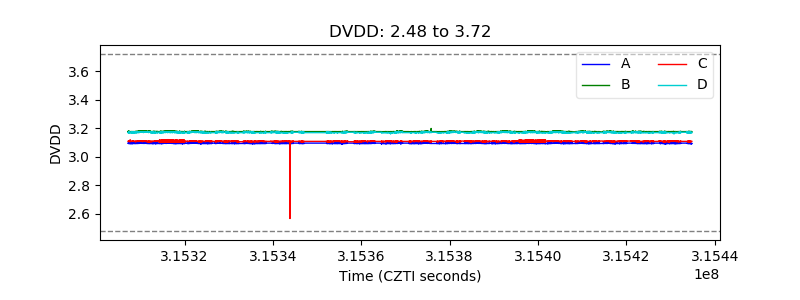 |
| Temperature 1 |  |
| Veto HV Monitor |  |
| Veto LLD | 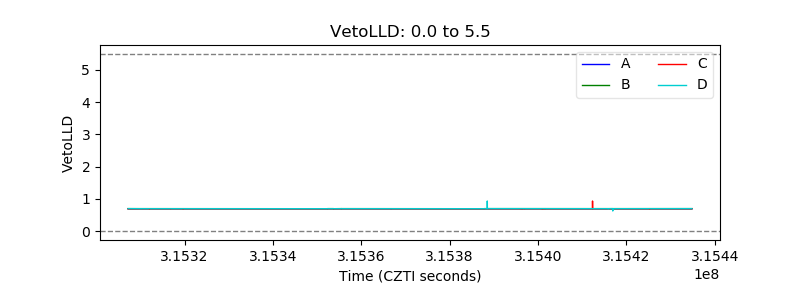 |
| Alpha Counter |  |
| _CPM_Rate | 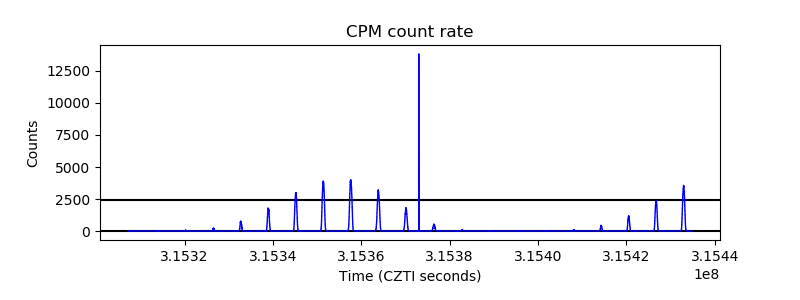 |
| CZT Counter |  |
| +2.5 Volts monitor | 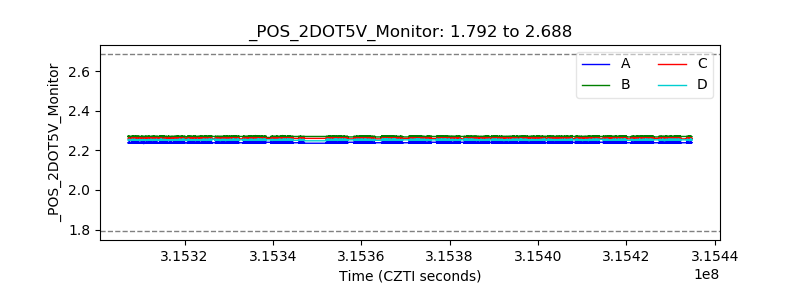 |
| +5 Volts monitor |  |
| _ROLL_ROT |  |
| _Roll_DEC | 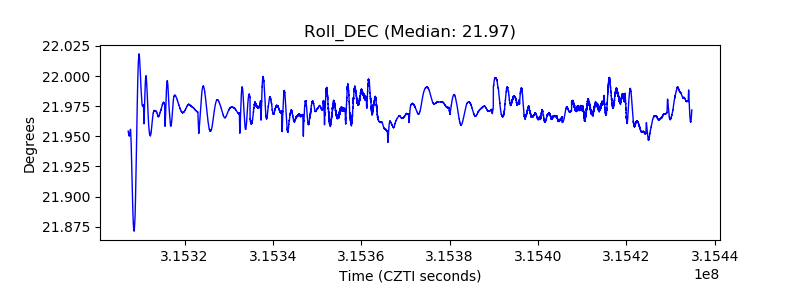 |
| _Roll_RA | 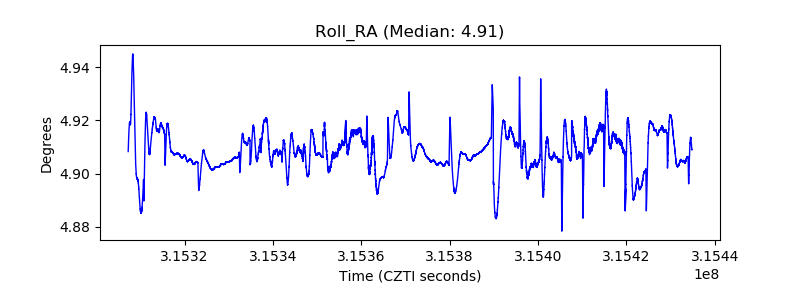 |
| Veto Counter |  |