| Param | Original file | Final file |
|---|---|---|
| Filename | modeM0/AS1A08_004T03_9000003400_22990cztM0_level2.evt | modeM0/AS1A08_004T03_9000003400_22990cztM0_level2_quad_clean.evt |
| Size (bytes) | 171,984,960 | 21,133,440 |
| Size | 164.0 MB | 20.2 MB |
| Events in quadrant A | 1,098,903 | 121,597 |
| Events in quadrant B | 1,114,827 | 125,930 |
| Events in quadrant C | 1,105,147 | 122,302 |
| Events in quadrant D | 1,744,546 | 117,451 |
| Mode M0 | |||
|---|---|---|---|
| Quadrant | BADHDUFLAG | Total packets | Discarded packets |
| A | 0 | 4563 | 2 |
| B | 0 | 4590 | 2 |
| C | 0 | 4569 | 2 |
| D | 0 | 6563 | 2 |
| Mode SS | |||
|---|---|---|---|
| Quadrant | BADHDUFLAG | Total packets | Discarded packets |
| A | 0 | 46 | 0 |
| B | 0 | 46 | 0 |
| C | 0 | 46 | 0 |
| D | 0 | 46 | 0 |
| Mode M9 | |||
|---|---|---|---|
| Quadrant | BADHDUFLAG | Total packets | Discarded packets |
| A | 0 | 1 | 0 |
| B | 0 | 1 | 0 |
| C | 0 | 1 | 0 |
| D | 0 | 1 | 0 |
| Quadrant | Total seconds | Saturated seconds | Saturation percentage |
|---|---|---|---|
| A | 2090 | 160 | 7.655502% |
| B | 2090 | 174 | 8.325359% |
| C | 2090 | 158 | 7.559809% |
| D | 2090 | 257 | 12.296651% |
Noise dominated data is calculated using 1-second bins in cleaned event files. If a bin has >2000 counts, and if more than 50% of those come from <1% of pixels, then it is considered to be noise-dominated and hence unusable.
| Quadrant | # 1 sec bins | Bins with >0 counts | Bins with >2000 counts | High rate bins dominated by noise | Noise dominated (total time) | Noise dominated (detector-on time) | Marked lightcurve |
|---|---|---|---|---|---|---|---|
| A | 2260 | 2093 | 0 | 0 | 0.00% | 0.00% | 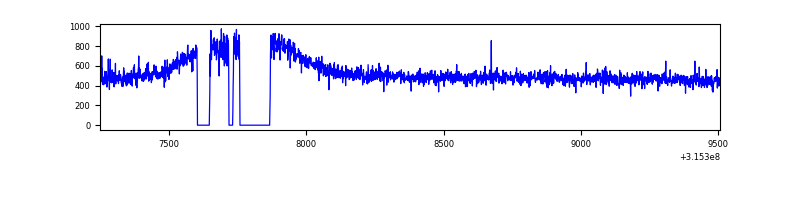 |
| B | 2260 | 2093 | 1 | 1 | 0.04% | 0.05% | 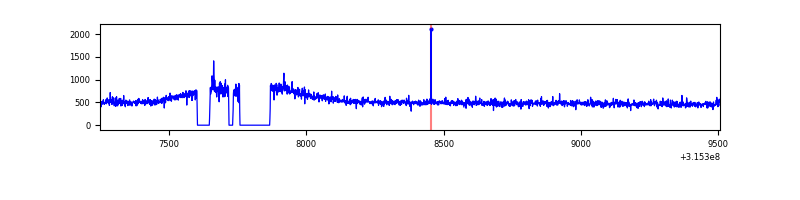 |
| C | 2260 | 2093 | 0 | 0 | 0.00% | 0.00% | 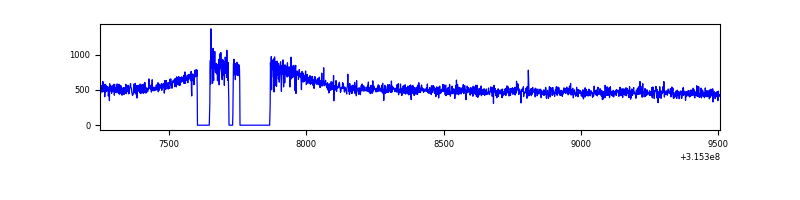 |
| D | 2260 | 2093 | 104 | 104 | 4.60% | 4.97% | 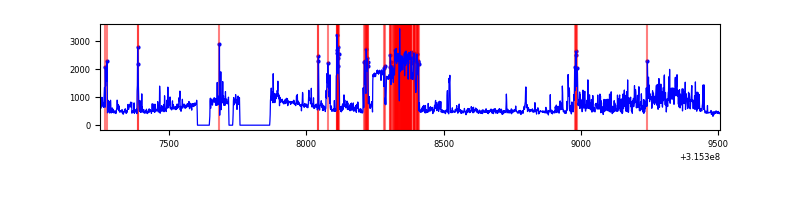 |
Top three noisy pixels from each quadrant. If the there are fewer than three noisy pixels in the level2.evt file, extra rows are filled as -1
| Pixel properties | Quadrant properties | ||||||
|---|---|---|---|---|---|---|---|
| Quadrant | DetID | PixID | Counts | Sigma | Mean | Median | Sigma |
| A | 13 | 254 | 3105 | 47.09 | 284 | 277 | 60.1 |
| A | 3 | 137 | 2762 | 41.37 | 284 | 277 | 60.1 |
| A | 0 | 226 | 2413 | 35.56 | 284 | 277 | 60.1 |
| B | 12 | 111 | 7227 | 119.01 | 281 | 272 | 58.4 |
| B | 11 | 111 | 6352 | 104.04 | 281 | 272 | 58.4 |
| B | 5 | 172 | 5885 | 96.05 | 281 | 272 | 58.4 |
| C | 14 | 238 | 41786 | 636.58 | 271 | 271 | 65.2 |
| C | 7 | 247 | 6021 | 88.17 | 271 | 271 | 65.2 |
| C | 13 | 61 | 1935 | 25.52 | 271 | 271 | 65.2 |
| D | 1 | 52 | 642565 | 9346.34 | 273 | 264 | 68.7 |
| D | 13 | 153 | 32748 | 472.69 | 273 | 264 | 68.7 |
| D | 13 | 104 | 21178 | 304.33 | 273 | 264 | 68.7 |
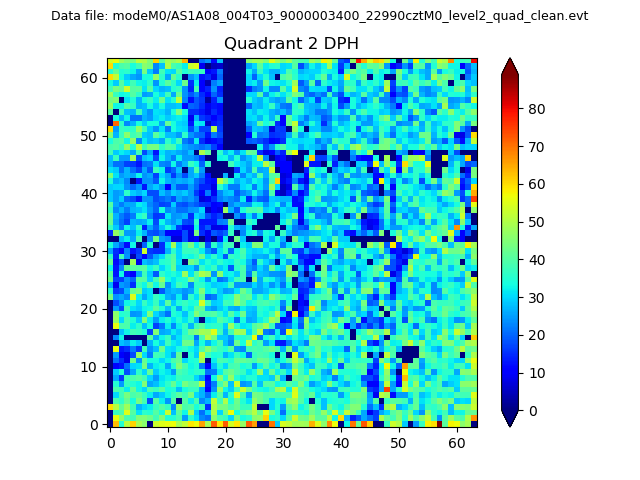
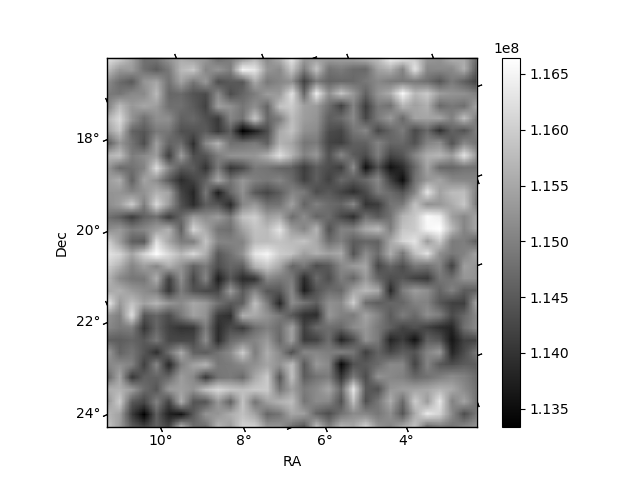
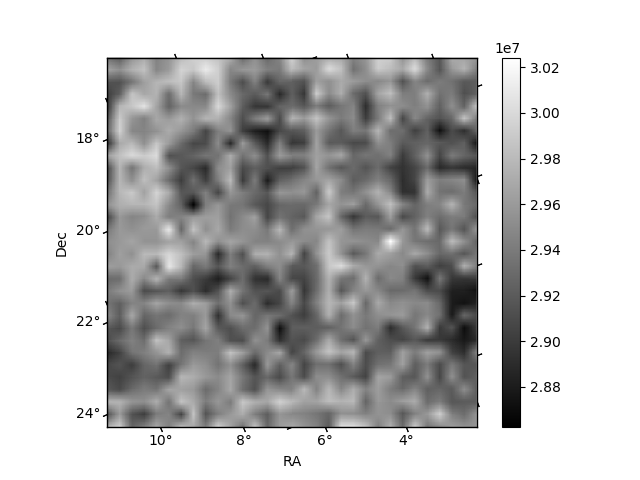
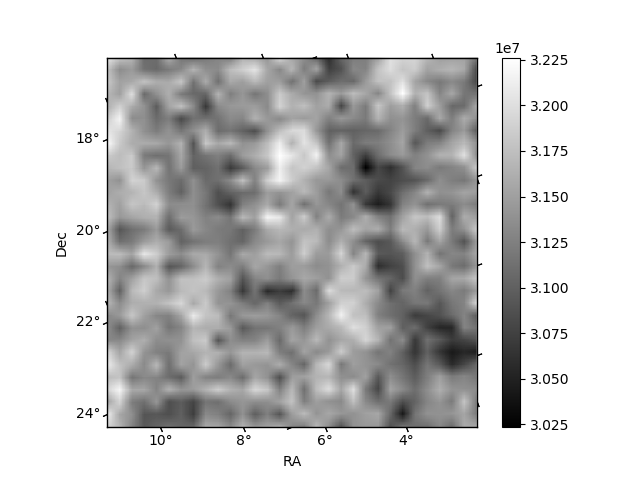
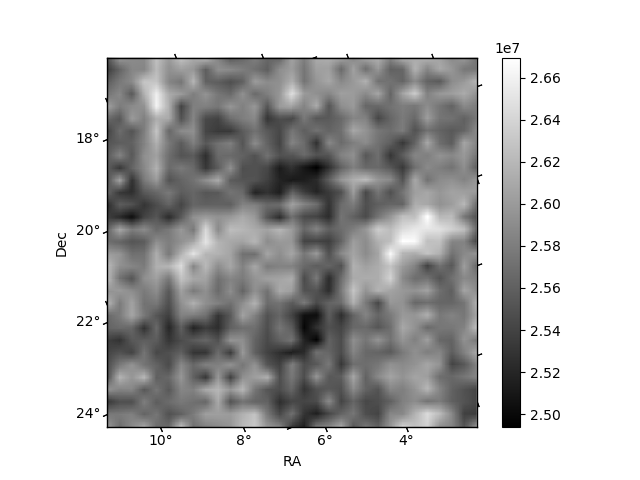
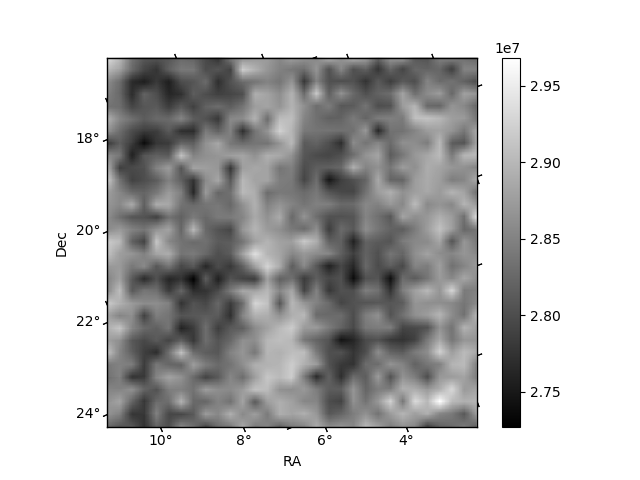
Histogram calculated using DETX and DETY for each event in the final _common_clean file
| Quadrant A | 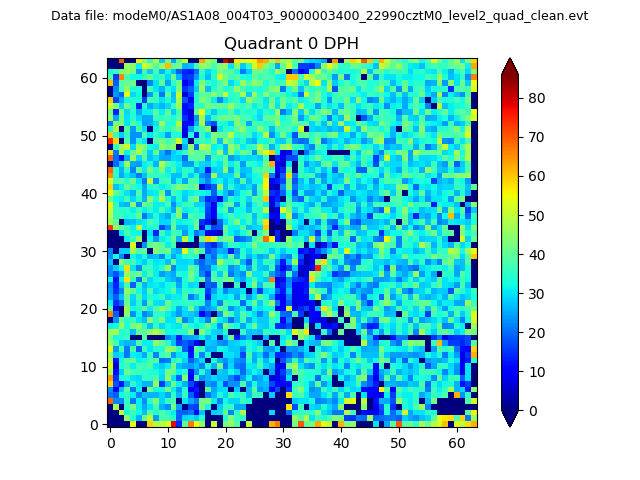 |
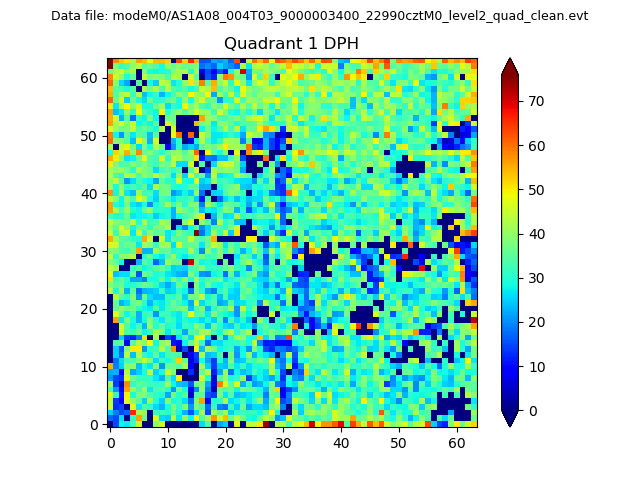 |
Quadrant B |
|---|---|---|---|
| Quadrant D | 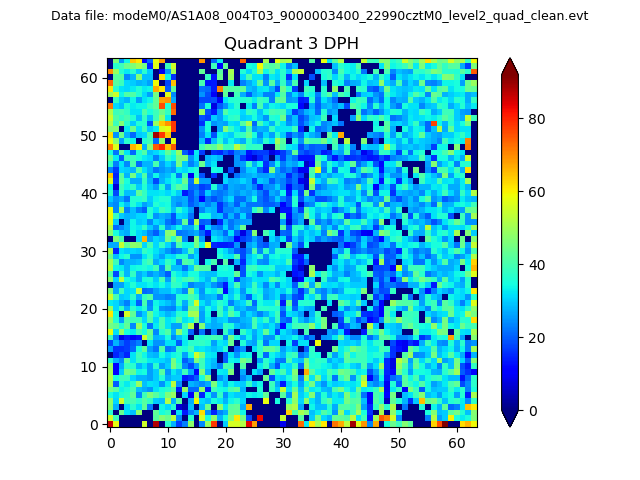 |
 |
Quadrant C |
| Plot type | Count rate plots | Images |
|---|---|---|
| Comparison with Poisson distribution Blue bars denote a histogram of data divided into 1 sec bins. Red curve is a Poisson curve with rate = median count rate of data. |
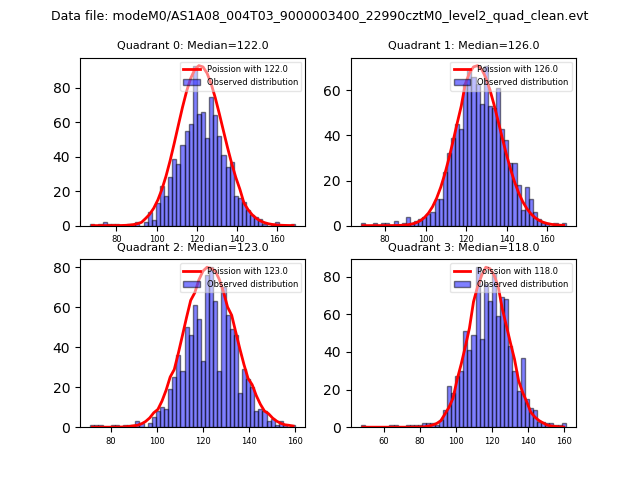 |
 |
| Quadrant-wise count rates Data is divided into 100 sec bins |
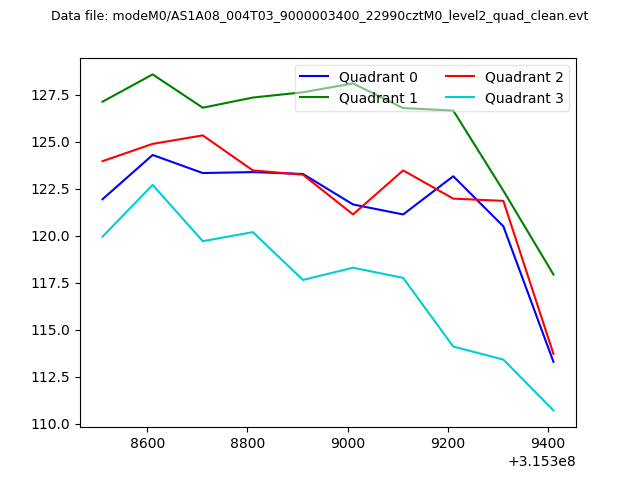 |
|
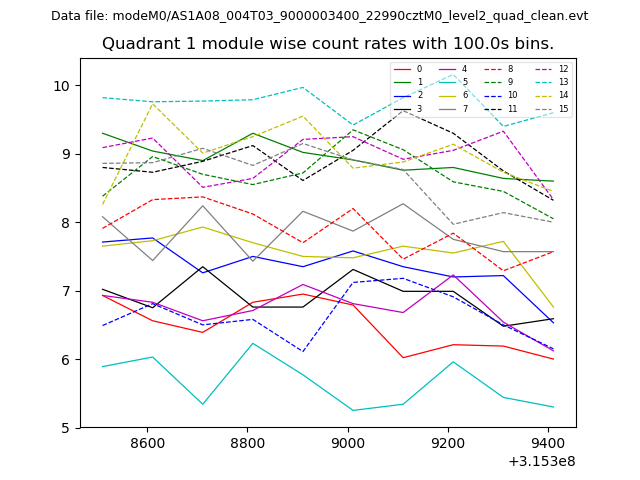
| Module-wise count rates for Quadrant A Data is divided into 100 sec bins |
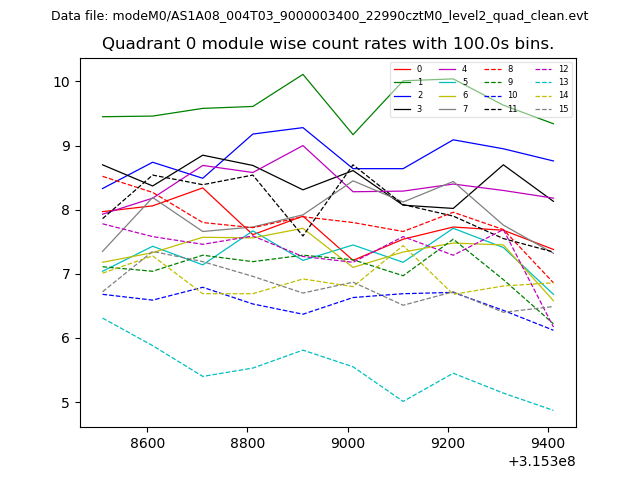 |
 |
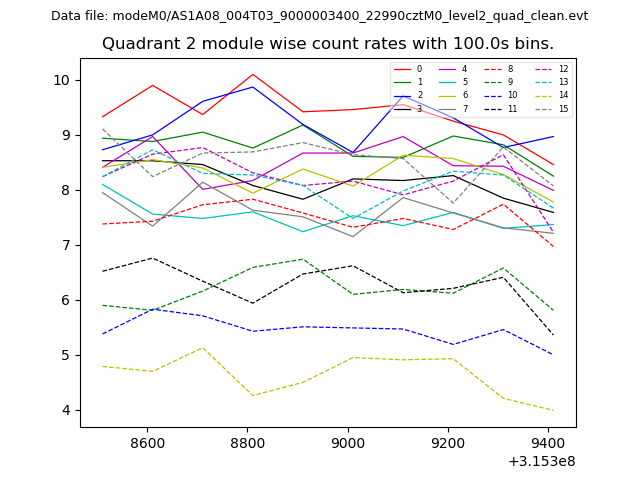
| Module-wise count rates for Quadrant B Data is divided into 100 sec bins |
 |
 |
| Module-wise count rates for Quadrant C Data is divided into 100 sec bins |
 |
 |
| Module-wise count rates for Quadrant D Data is divided into 100 sec bins |
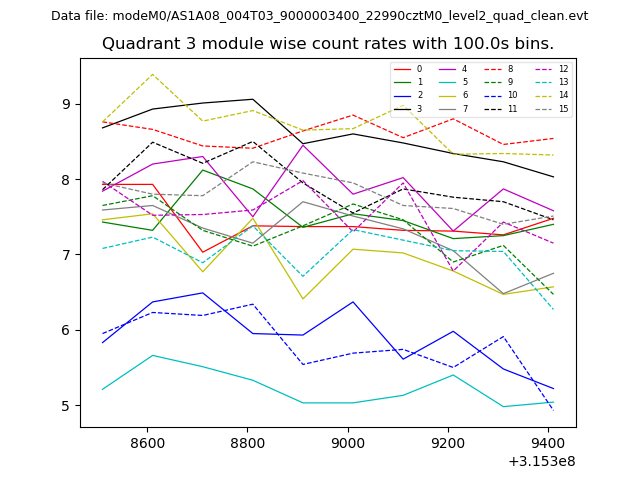 |
 |
| Parameter | Plot |
|---|---|
| CZT HV Monitor | 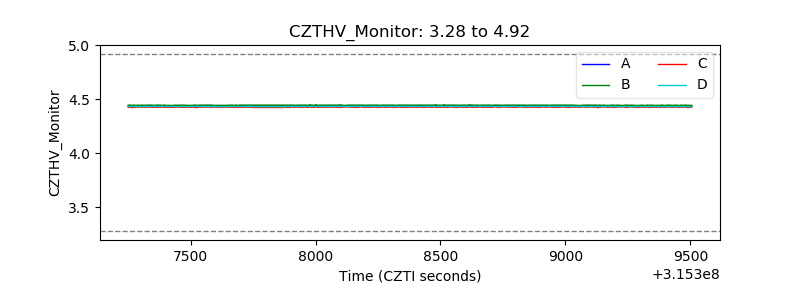 |
| D_VDD | 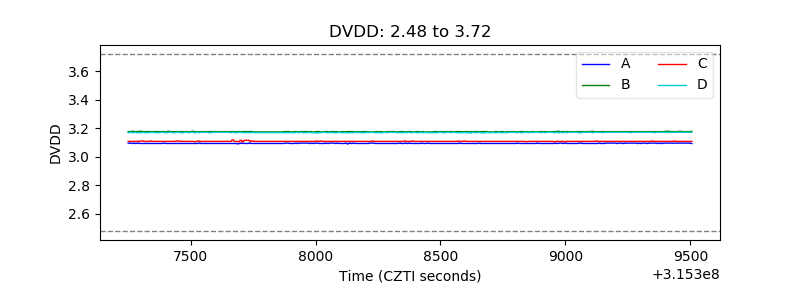 |
| Temperature 1 | 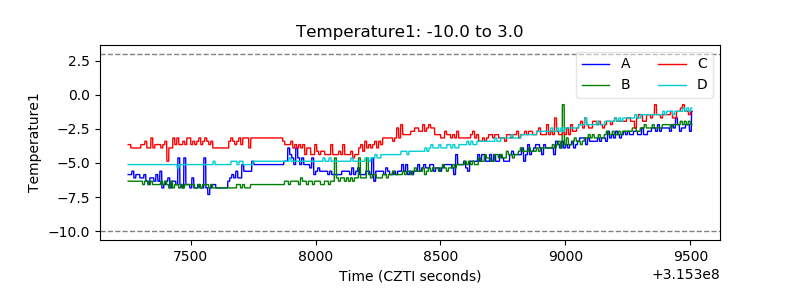 |
| Veto HV Monitor | 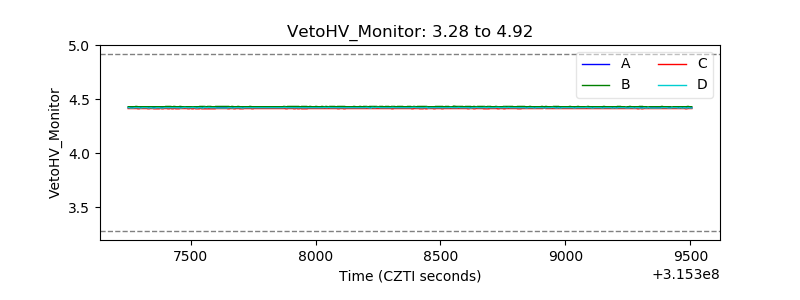 |
| Veto LLD | 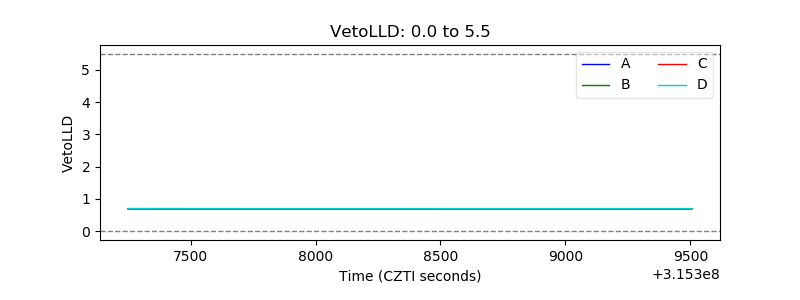 |
| Alpha Counter | 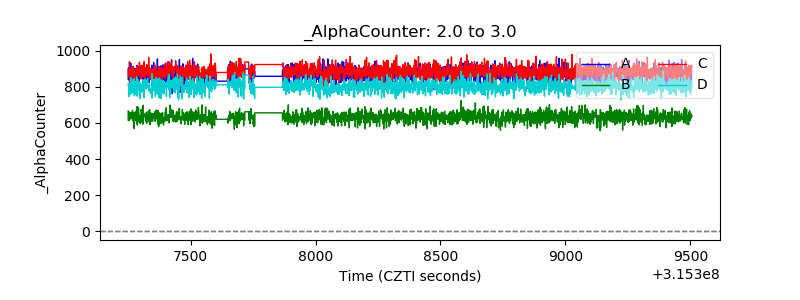 |
| _CPM_Rate | 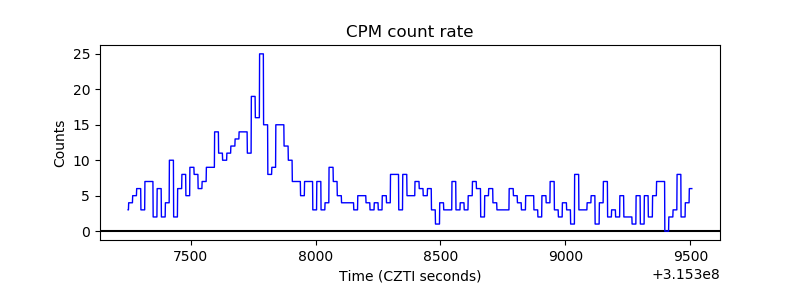 |
| CZT Counter | 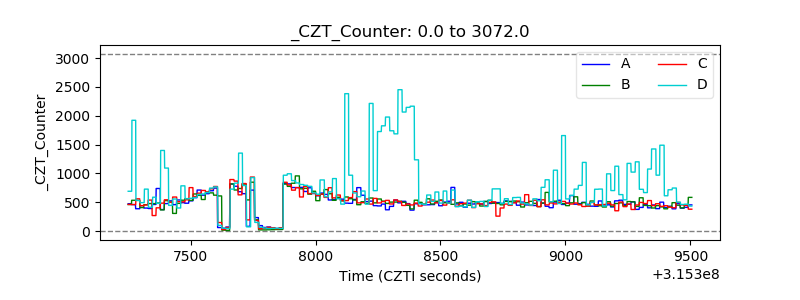 |
| +2.5 Volts monitor | 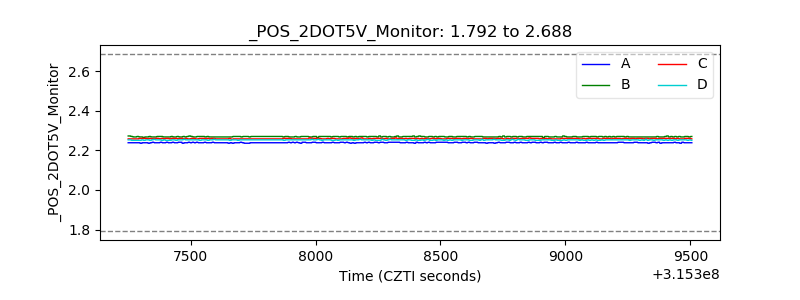 |
| +5 Volts monitor |  |
| _ROLL_ROT | 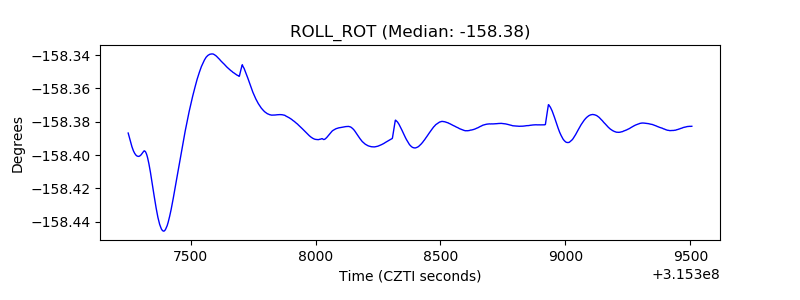 |
| _Roll_DEC | 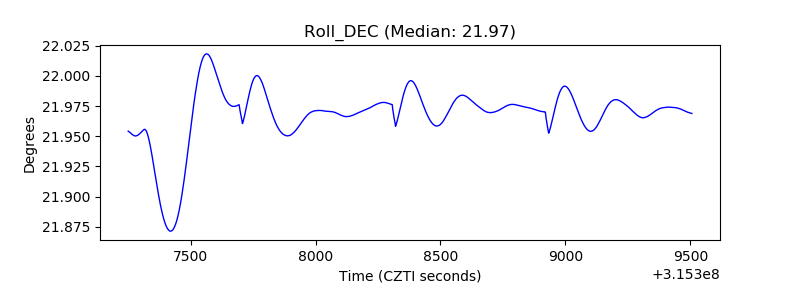 |
| _Roll_RA | 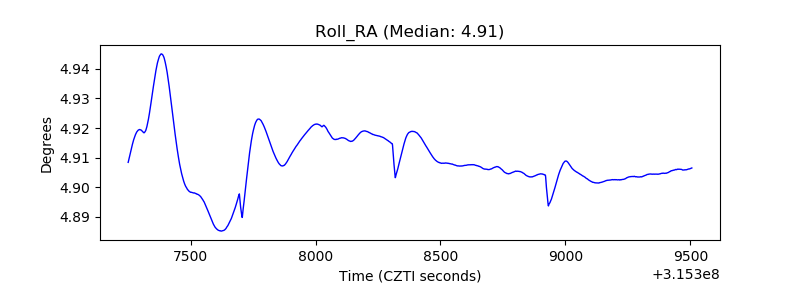 |
| Veto Counter | 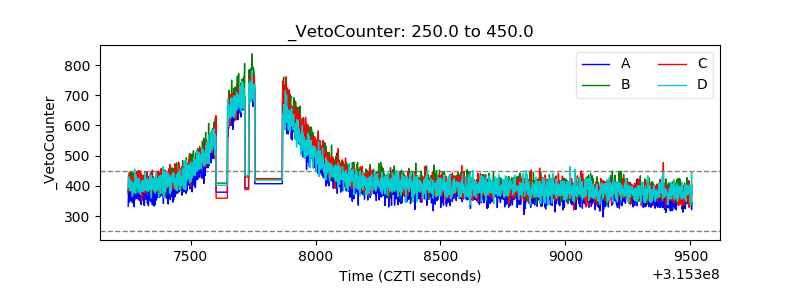 |