| Param | Original file | Final file |
|---|---|---|
| Filename | modeM0/AS1A08_004T03_9000003400_22994cztM0_level2.evt | modeM0/AS1A08_004T03_9000003400_22994cztM0_level2_quad_clean.evt |
| Size (bytes) | 1,134,204,480 | 202,170,240 |
| Size | 1.1 GB | 192.8 MB |
| Events in quadrant A | 7,700,617 | 1,269,152 |
| Events in quadrant B | 8,207,422 | 1,274,942 |
| Events in quadrant C | 7,863,429 | 1,224,536 |
| Events in quadrant D | 9,446,663 | 1,200,968 |
| Mode M0 | |||
|---|---|---|---|
| Quadrant | BADHDUFLAG | Total packets | Discarded packets |
| A | 0 | 34142 | 2 |
| B | 0 | 35173 | 2 |
| C | 0 | 34367 | 2 |
| D | 0 | 38753 | 2 |
| Mode SS | |||
|---|---|---|---|
| Quadrant | BADHDUFLAG | Total packets | Discarded packets |
| A | 0 | 340 | 0 |
| B | 0 | 340 | 0 |
| C | 0 | 340 | 0 |
| D | 0 | 340 | 0 |
| Mode M9 | |||
|---|---|---|---|
| Quadrant | BADHDUFLAG | Total packets | Discarded packets |
| A | 0 | 15 | 0 |
| B | 0 | 15 | 0 |
| C | 0 | 15 | 0 |
| D | 0 | 15 | 0 |
| Quadrant | Total seconds | Saturated seconds | Saturation percentage |
|---|---|---|---|
| A | 16727 | 133 | 0.795122% |
| B | 16728 | 165 | 0.986370% |
| C | 16728 | 195 | 1.165710% |
| D | 16728 | 192 | 1.147776% |
Noise dominated data is calculated using 1-second bins in cleaned event files. If a bin has >2000 counts, and if more than 50% of those come from <1% of pixels, then it is considered to be noise-dominated and hence unusable.
| Quadrant | # 1 sec bins | Bins with >0 counts | Bins with >2000 counts | High rate bins dominated by noise | Noise dominated (total time) | Noise dominated (detector-on time) | Marked lightcurve |
|---|---|---|---|---|---|---|---|
| A | 17867 | 16729 | 0 | 0 | 0.00% | 0.00% | 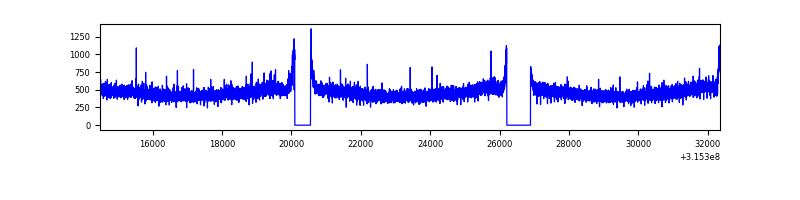 |
| B | 17868 | 16730 | 2 | 2 | 0.01% | 0.01% | 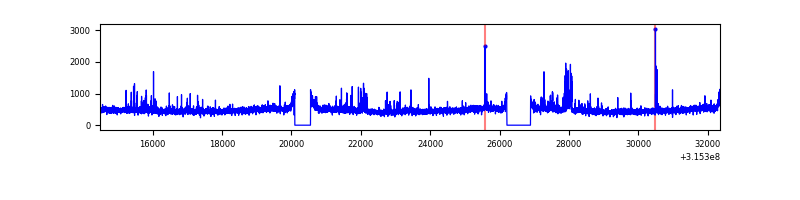 |
| C | 17868 | 16730 | 1 | 1 | 0.01% | 0.01% | 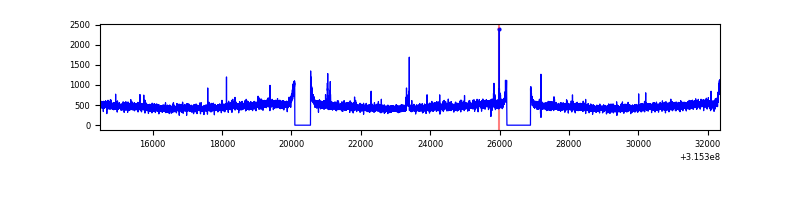 |
| D | 17868 | 16730 | 71 | 71 | 0.40% | 0.42% |  |
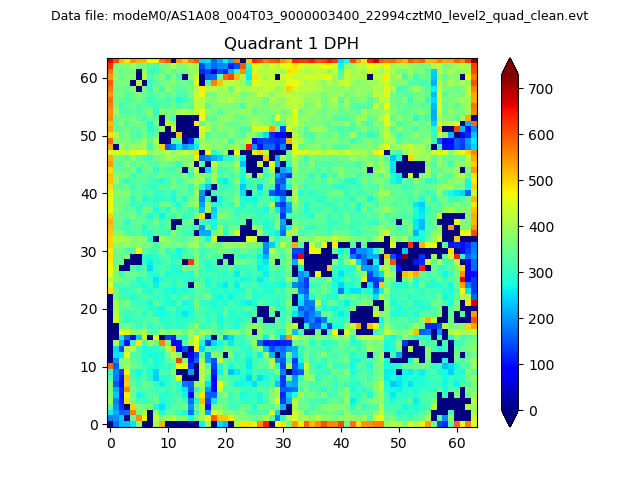
Top three noisy pixels from each quadrant. If the there are fewer than three noisy pixels in the level2.evt file, extra rows are filled as -1
| Pixel properties | Quadrant properties | ||||||
|---|---|---|---|---|---|---|---|
| Quadrant | DetID | PixID | Counts | Sigma | Mean | Median | Sigma |
| A | 13 | 254 | 26283 | 60.54 | 1993 | 1948 | 401.9 |
| A | 3 | 137 | 17614 | 38.98 | 1993 | 1948 | 401.9 |
| A | 0 | 226 | 17091 | 37.67 | 1993 | 1948 | 401.9 |
| B | 0 | 189 | 185217 | 483.83 | 1982 | 1933 | 378.8 |
| B | 0 | 190 | 111789 | 290.0 | 1982 | 1933 | 378.8 |
| B | 10 | 247 | 109573 | 284.15 | 1982 | 1933 | 378.8 |
| C | 14 | 238 | 300657 | 665.31 | 1917 | 1929 | 449.0 |
| C | 7 | 247 | 45080 | 96.1 | 1917 | 1929 | 449.0 |
| C | 0 | 10 | 31805 | 66.54 | 1917 | 1929 | 449.0 |
| D | 1 | 52 | 1263477 | 2679.5 | 1943 | 1890 | 470.8 |
| D | 13 | 153 | 250258 | 527.51 | 1943 | 1890 | 470.8 |
| D | 12 | 227 | 89290 | 185.63 | 1943 | 1890 | 470.8 |
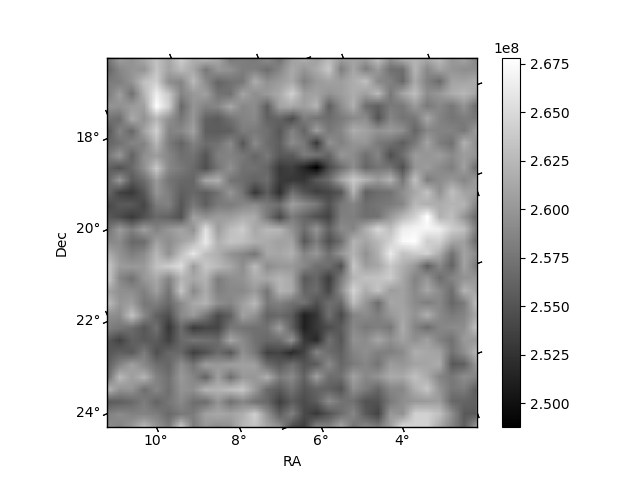
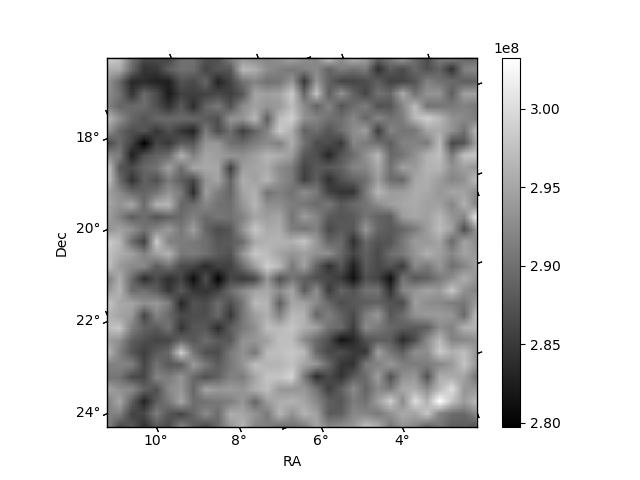
Histogram calculated using DETX and DETY for each event in the final _common_clean file
| Quadrant A |  |
 |
Quadrant B |
|---|---|---|---|
| Quadrant D |  |
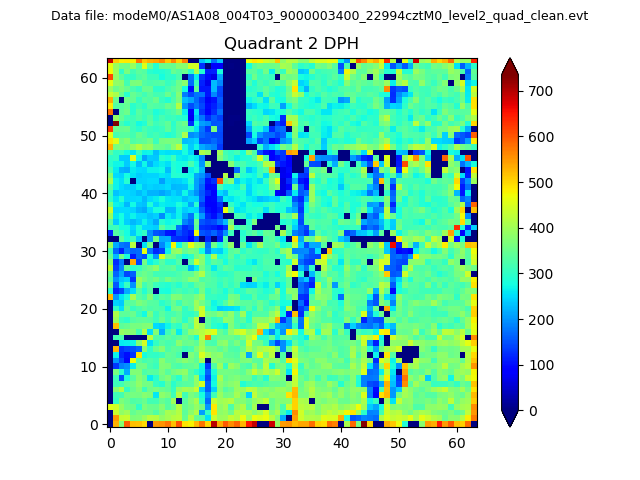 |
Quadrant C |
| Plot type | Count rate plots | Images |
|---|---|---|
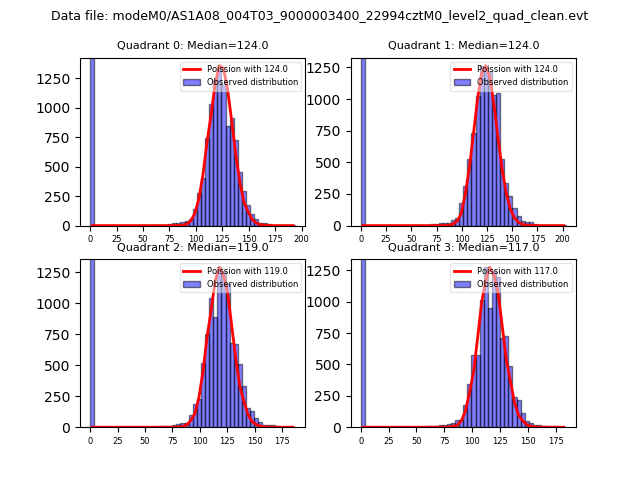
| Comparison with Poisson distribution Blue bars denote a histogram of data divided into 1 sec bins. Red curve is a Poisson curve with rate = median count rate of data. |
 |
 |
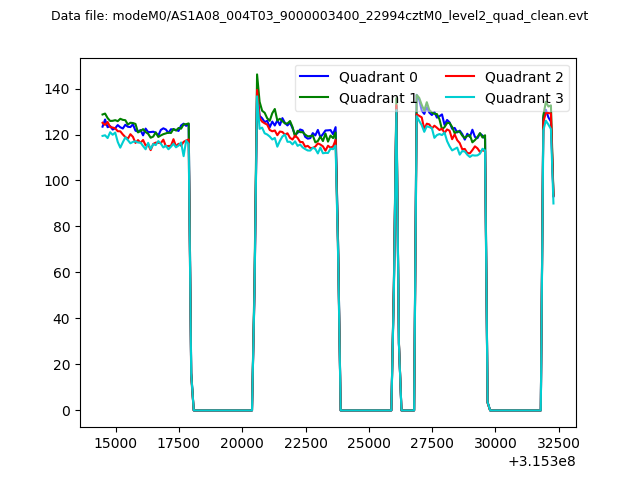
| Quadrant-wise count rates Data is divided into 100 sec bins |
 |
|
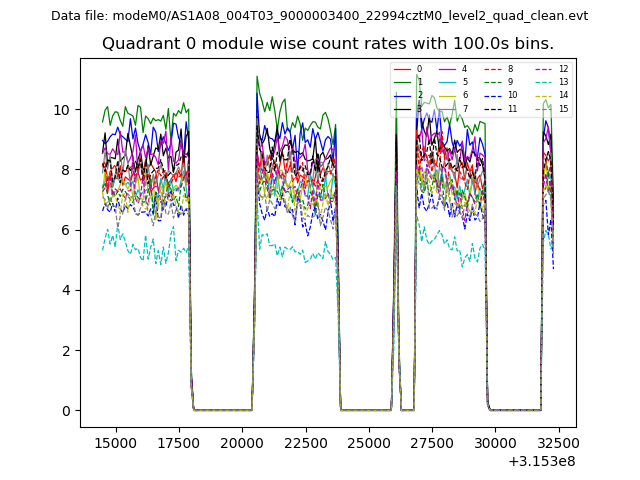
| Module-wise count rates for Quadrant A Data is divided into 100 sec bins |
 |
 |
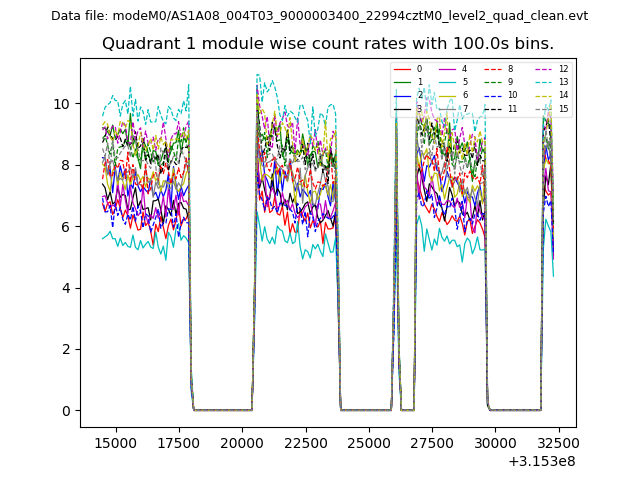
| Module-wise count rates for Quadrant B Data is divided into 100 sec bins |
 |
 |
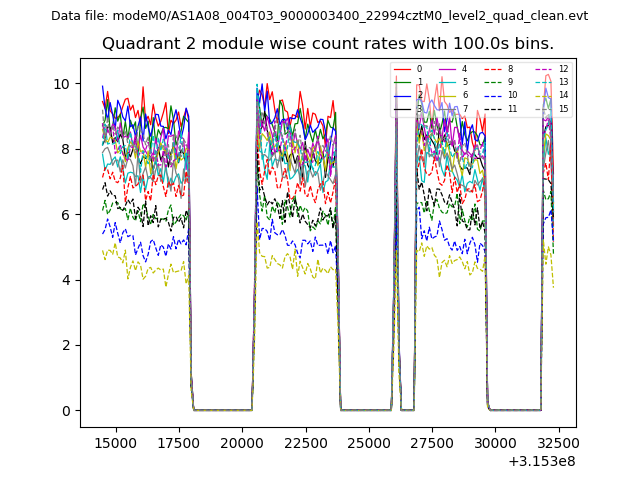
| Module-wise count rates for Quadrant C Data is divided into 100 sec bins |
 |
 |
| Module-wise count rates for Quadrant D Data is divided into 100 sec bins |
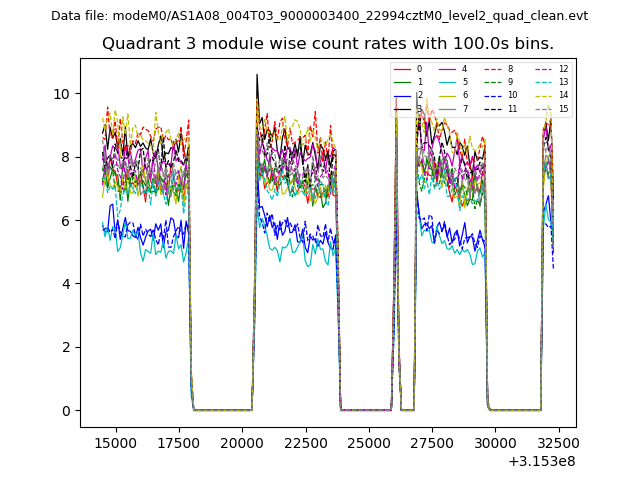 |
 |
| Parameter | Plot |
|---|---|
| CZT HV Monitor | 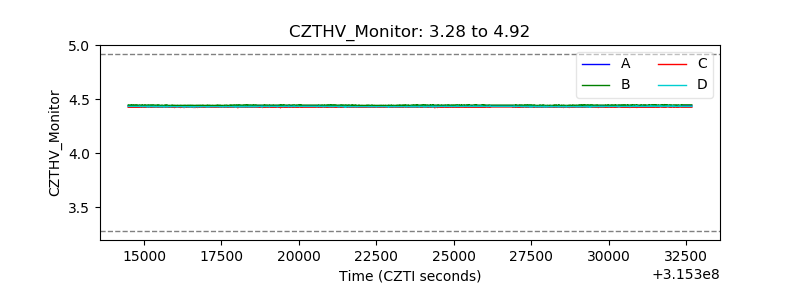 |
| D_VDD | 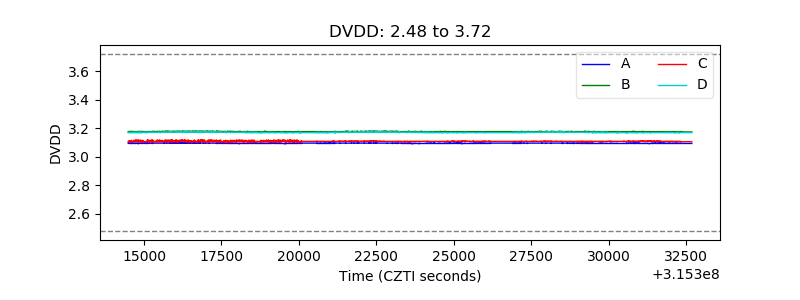 |
| Temperature 1 | 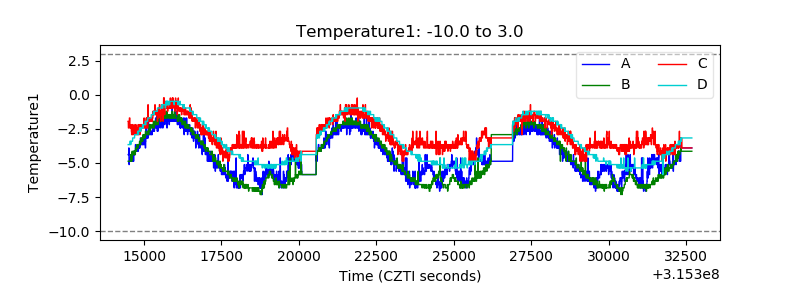 |
| Veto HV Monitor | 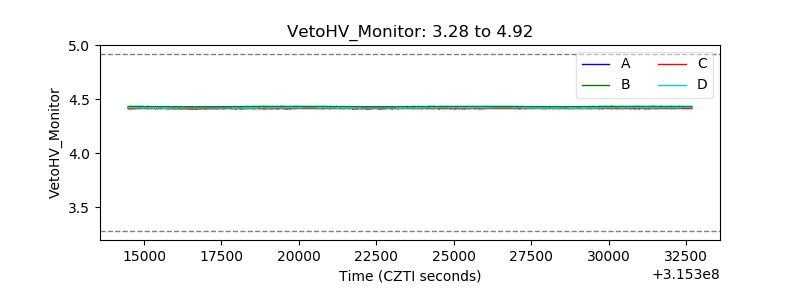 |
| Veto LLD |  |
| Alpha Counter | 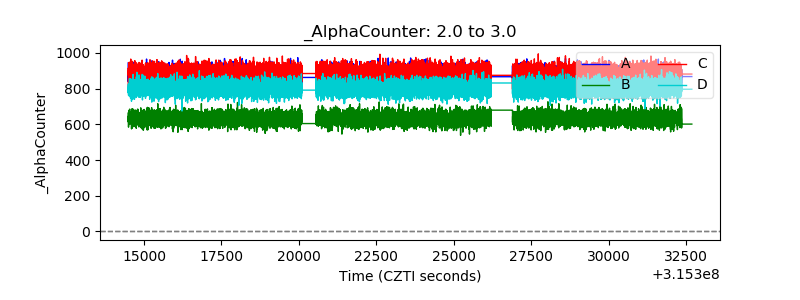 |
| _CPM_Rate | 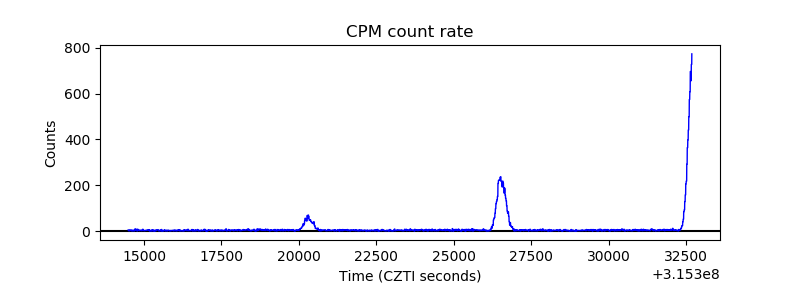 |
| CZT Counter | 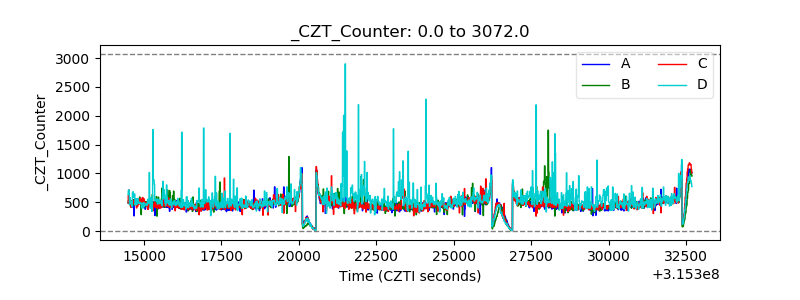 |
| +2.5 Volts monitor |  |
| +5 Volts monitor |  |
| _ROLL_ROT | 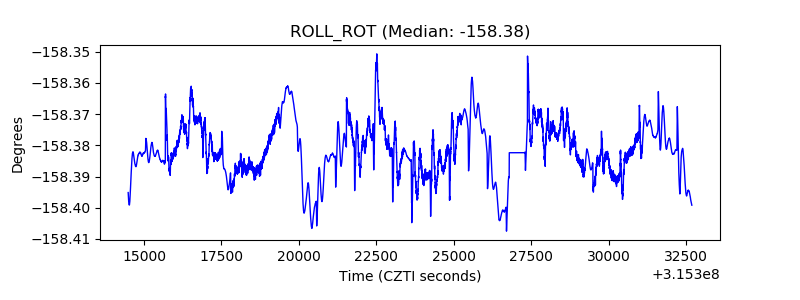 |
| _Roll_DEC | 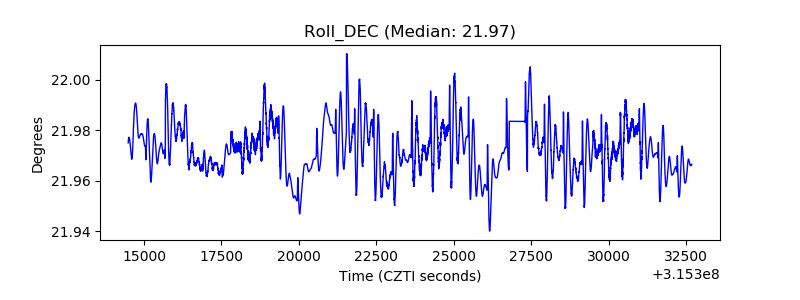 |
| _Roll_RA | 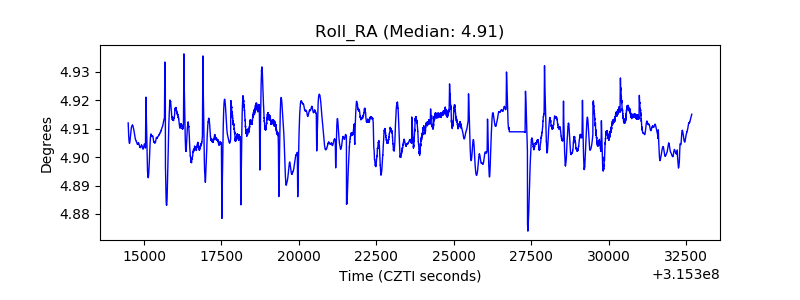 |
| Veto Counter | 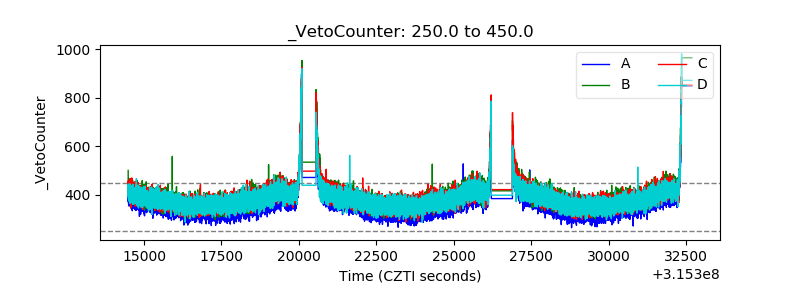 |