| Param | Original file | Final file |
|---|---|---|
| Filename | modeM0/AS1A08_004T03_9000003400_22995cztM0_level2.evt | modeM0/AS1A08_004T03_9000003400_22995cztM0_level2_quad_clean.evt |
| Size (bytes) | 455,227,200 | 91,952,640 |
| Size | 434.1 MB | 87.7 MB |
| Events in quadrant A | 3,116,863 | 591,389 |
| Events in quadrant B | 3,269,036 | 601,357 |
| Events in quadrant C | 3,156,164 | 571,250 |
| Events in quadrant D | 3,794,362 | 558,818 |
| Mode M0 | |||
|---|---|---|---|
| Quadrant | BADHDUFLAG | Total packets | Discarded packets |
| A | 0 | 13635 | 1 |
| B | 0 | 13924 | 1 |
| C | 0 | 13607 | 1 |
| D | 0 | 15647 | 2 |
| Mode SS | |||
|---|---|---|---|
| Quadrant | BADHDUFLAG | Total packets | Discarded packets |
| A | 0 | 134 | 0 |
| B | 0 | 134 | 0 |
| C | 0 | 134 | 0 |
| D | 0 | 134 | 0 |
| Mode M9 | |||
|---|---|---|---|
| Quadrant | BADHDUFLAG | Total packets | Discarded packets |
| A | 0 | 15 | 0 |
| B | 0 | 16 | 0 |
| C | 0 | 16 | 0 |
| D | 0 | 16 | 0 |
| Quadrant | Total seconds | Saturated seconds | Saturation percentage |
|---|---|---|---|
| A | 6625 | 24 | 0.362264% |
| B | 6625 | 41 | 0.618868% |
| C | 6625 | 59 | 0.890566% |
| D | 6624 | 47 | 0.709541% |
Noise dominated data is calculated using 1-second bins in cleaned event files. If a bin has >2000 counts, and if more than 50% of those come from <1% of pixels, then it is considered to be noise-dominated and hence unusable.
| Quadrant | # 1 sec bins | Bins with >0 counts | Bins with >2000 counts | High rate bins dominated by noise | Noise dominated (total time) | Noise dominated (detector-on time) | Marked lightcurve |
|---|---|---|---|---|---|---|---|
| A | 7625 | 6626 | 0 | 0 | 0.00% | 0.00% |  |
| B | 7625 | 6626 | 4 | 4 | 0.05% | 0.06% | 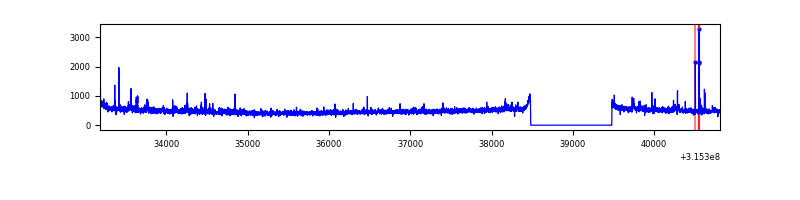 |
| C | 7625 | 6626 | 0 | 0 | 0.00% | 0.00% | 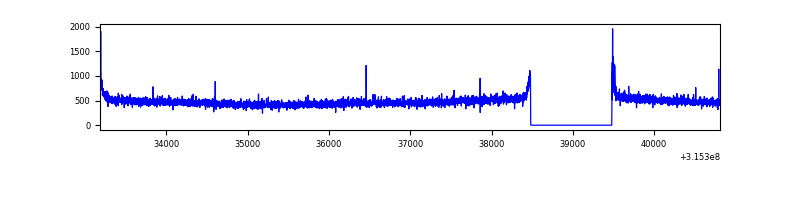 |
| D | 7624 | 6625 | 22 | 22 | 0.29% | 0.33% | 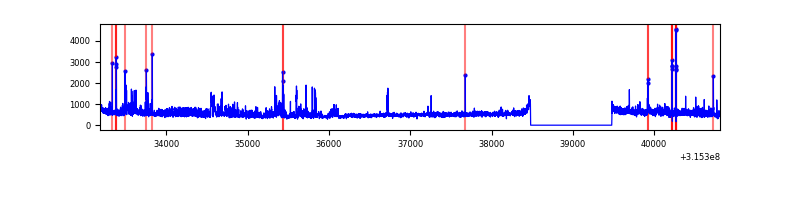 |
Top three noisy pixels from each quadrant. If the there are fewer than three noisy pixels in the level2.evt file, extra rows are filled as -1
| Pixel properties | Quadrant properties | ||||||
|---|---|---|---|---|---|---|---|
| Quadrant | DetID | PixID | Counts | Sigma | Mean | Median | Sigma |
| A | 11 | 47 | 18145 | 107.1 | 800 | 781 | 162.1 |
| A | 14 | 237 | 12153 | 70.14 | 800 | 781 | 162.1 |
| A | 13 | 254 | 9750 | 55.32 | 800 | 781 | 162.1 |
| B | 0 | 189 | 83097 | 537.93 | 801 | 780 | 153.0 |
| B | 0 | 190 | 33501 | 213.83 | 801 | 780 | 153.0 |
| B | 4 | 216 | 19731 | 123.84 | 801 | 780 | 153.0 |
| C | 14 | 238 | 121496 | 666.68 | 772 | 777 | 181.1 |
| C | 0 | 10 | 17715 | 93.54 | 772 | 777 | 181.1 |
| C | 7 | 247 | 6013 | 28.92 | 772 | 777 | 181.1 |
| D | 1 | 52 | 515874 | 2728.44 | 781 | 760 | 188.8 |
| D | 13 | 153 | 94620 | 497.15 | 781 | 760 | 188.8 |
| D | 2 | 152 | 60982 | 318.98 | 781 | 760 | 188.8 |
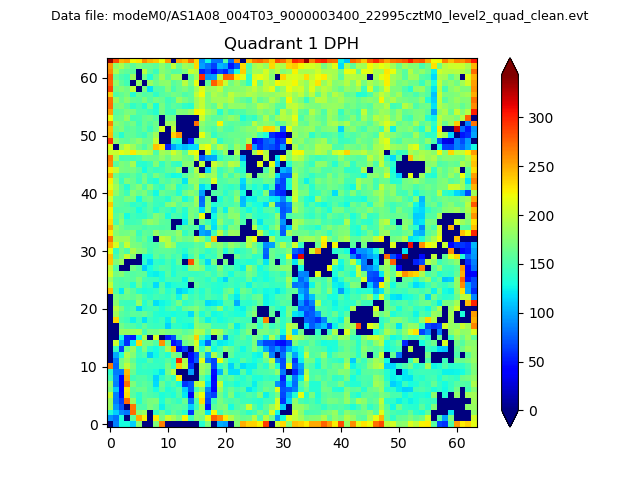
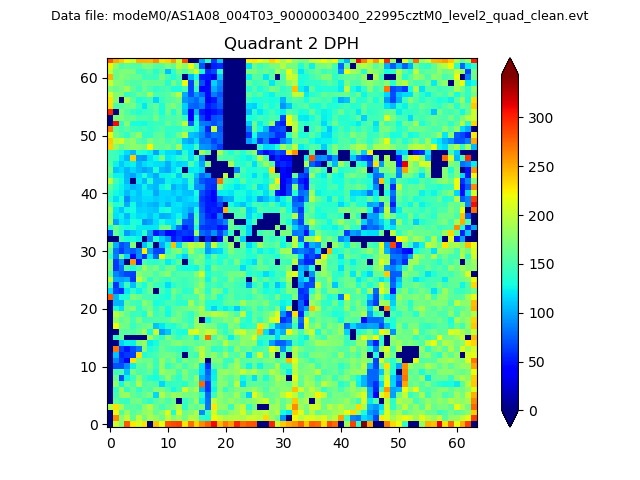
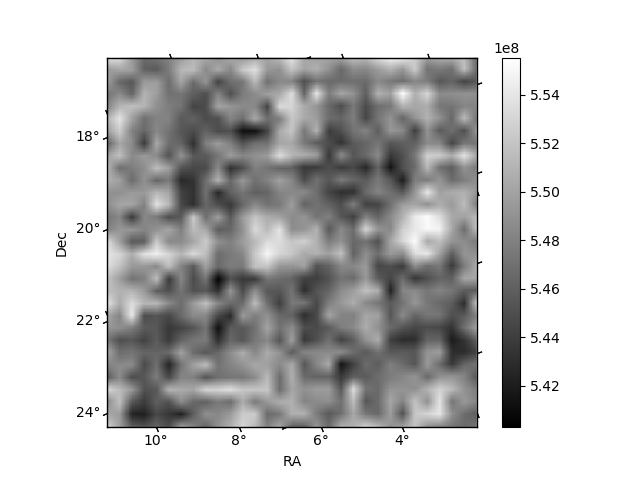
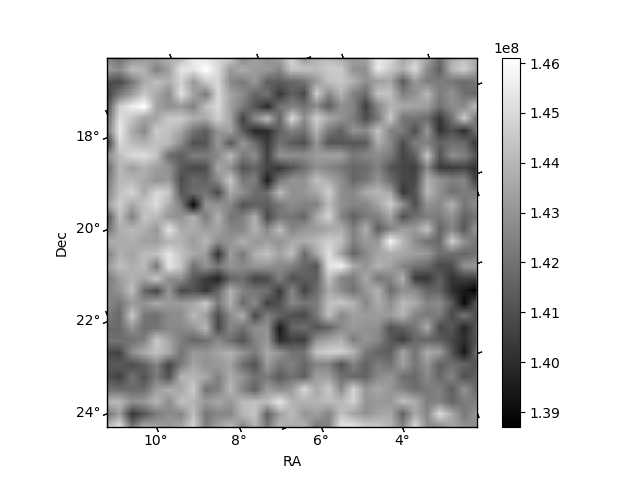
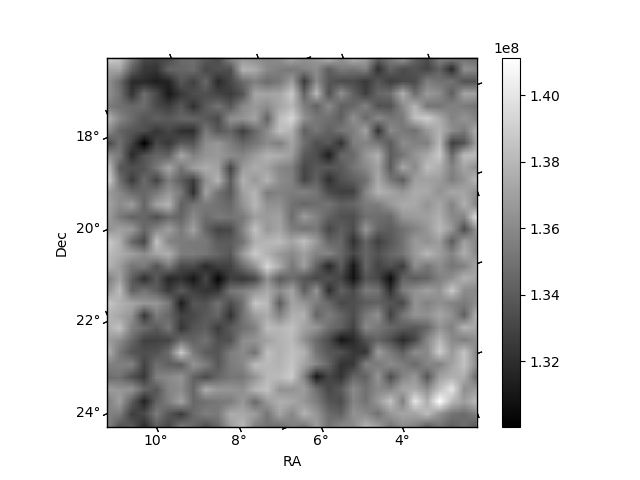
Histogram calculated using DETX and DETY for each event in the final _common_clean file
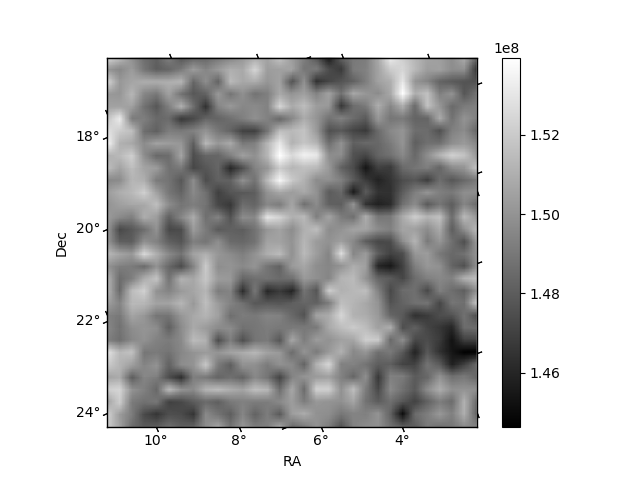
| Quadrant A | 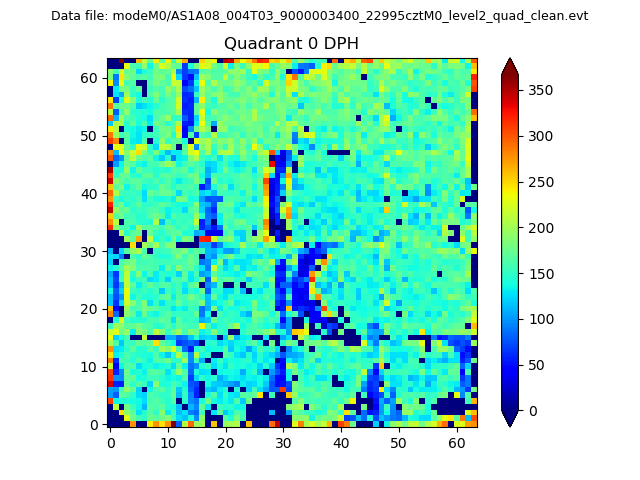 |
 |
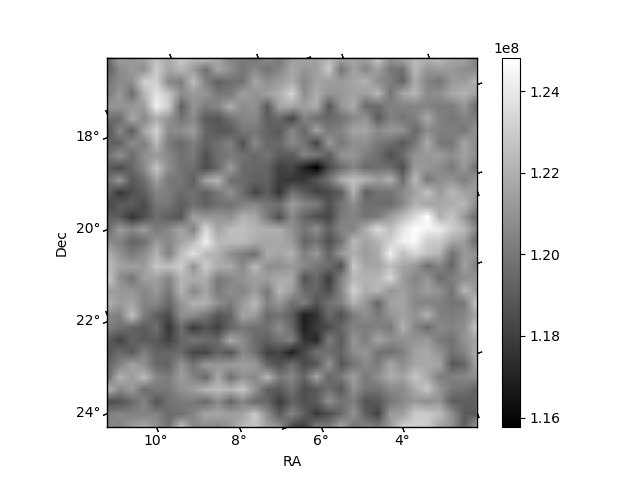
Quadrant B |
|---|---|---|---|
| Quadrant D | 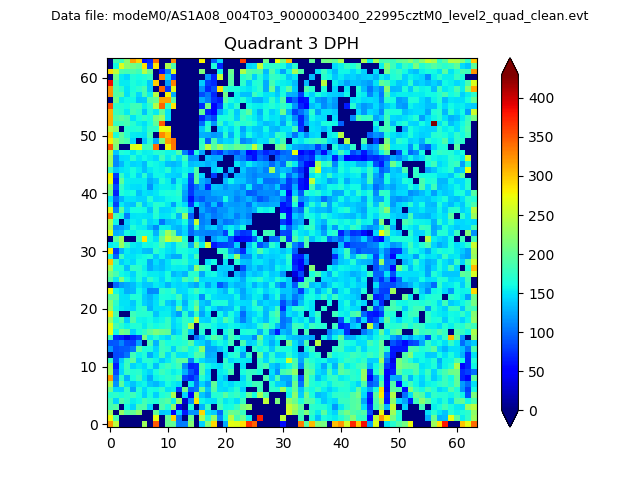 |
 |
Quadrant C |
| Plot type | Count rate plots | Images |
|---|---|---|
| Comparison with Poisson distribution Blue bars denote a histogram of data divided into 1 sec bins. Red curve is a Poisson curve with rate = median count rate of data. |
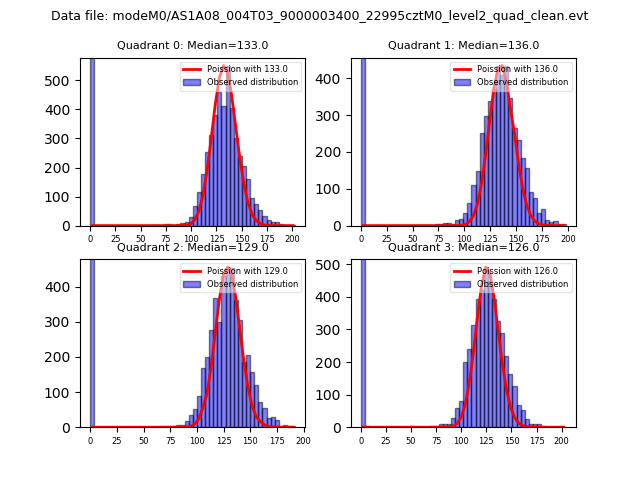 |
 |
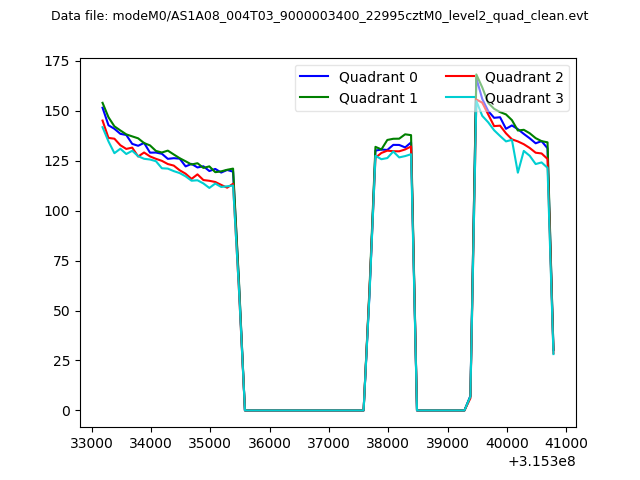
| Quadrant-wise count rates Data is divided into 100 sec bins |
 |
|
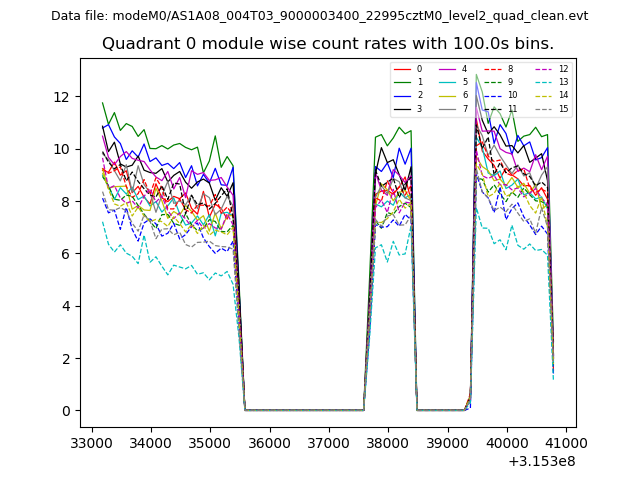
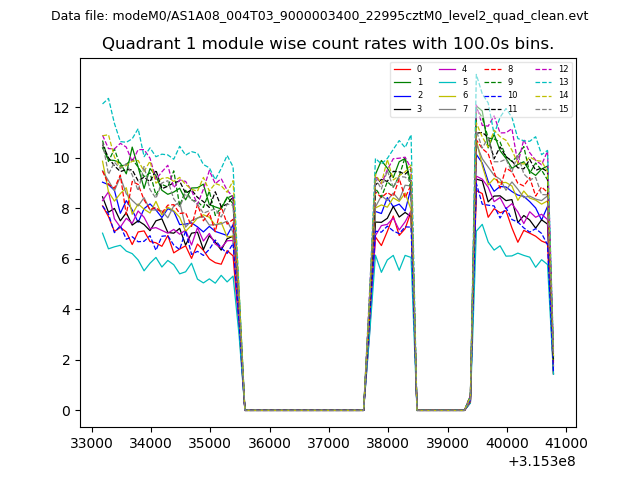
| Module-wise count rates for Quadrant A Data is divided into 100 sec bins |
 |
 |
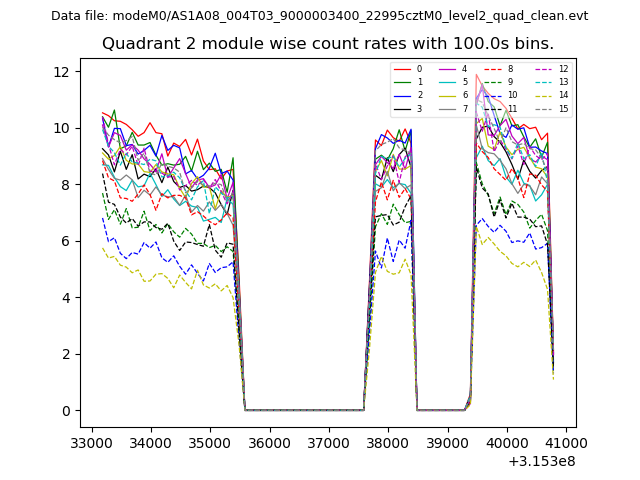
| Module-wise count rates for Quadrant B Data is divided into 100 sec bins |
 |
 |
| Module-wise count rates for Quadrant C Data is divided into 100 sec bins |
 |
 |
| Module-wise count rates for Quadrant D Data is divided into 100 sec bins |
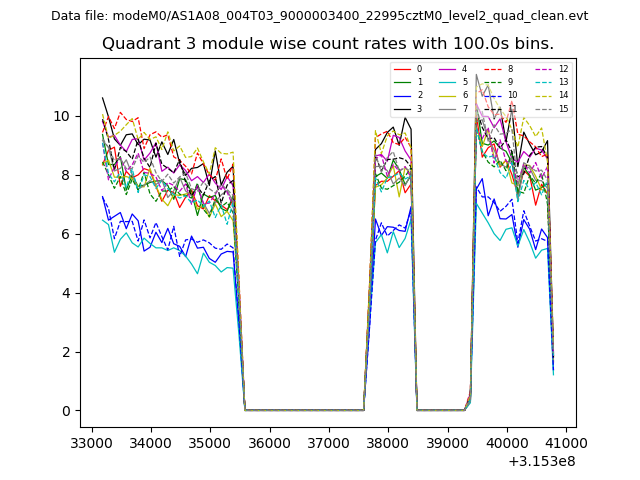 |
 |
| Parameter | Plot |
|---|---|
| CZT HV Monitor | 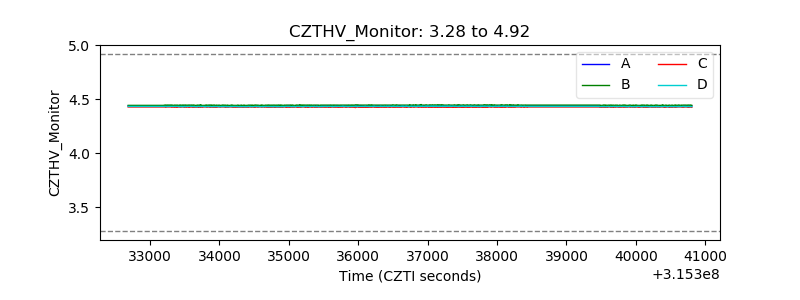 |
| D_VDD | 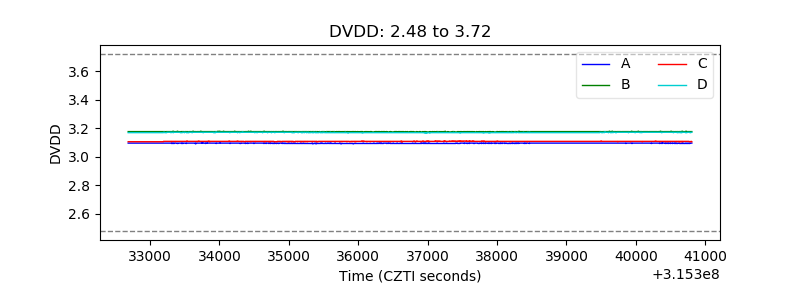 |
| Temperature 1 | 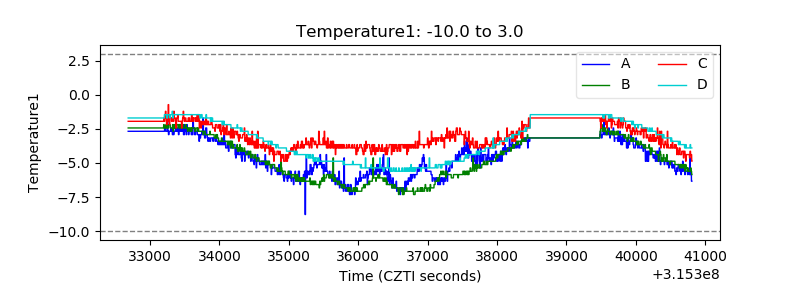 |
| Veto HV Monitor | 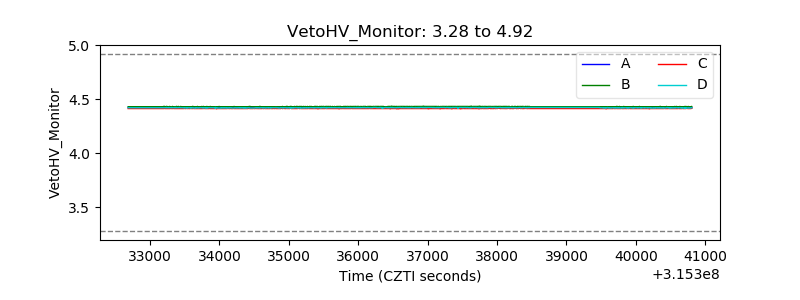 |
| Veto LLD | 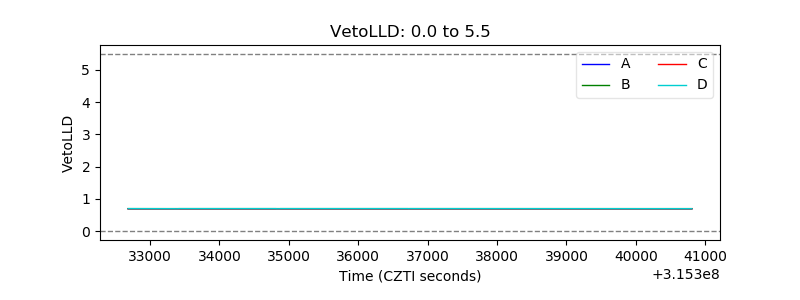 |
| Alpha Counter | 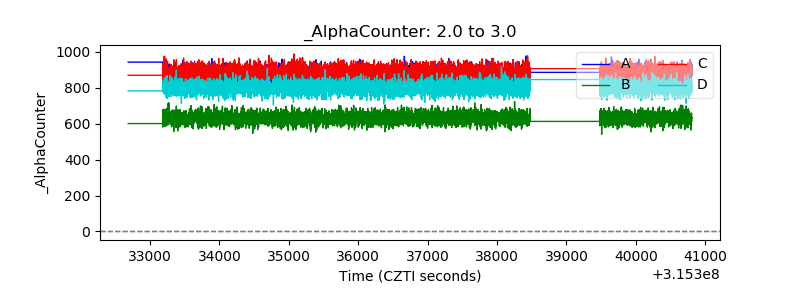 |
| _CPM_Rate | 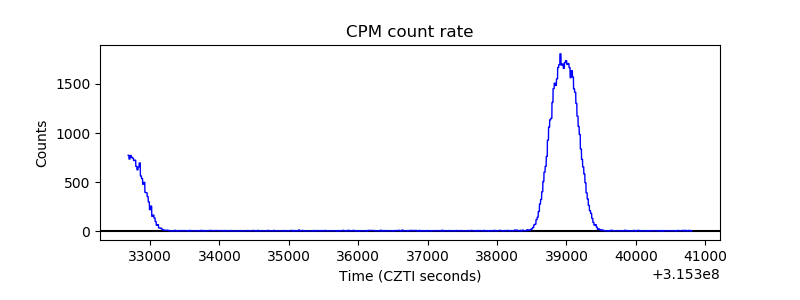 |
| CZT Counter | 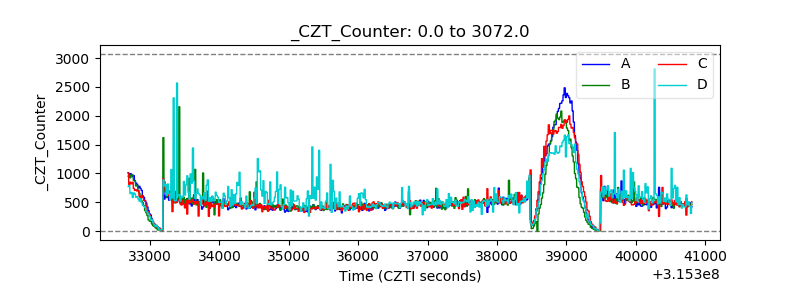 |
| +2.5 Volts monitor | 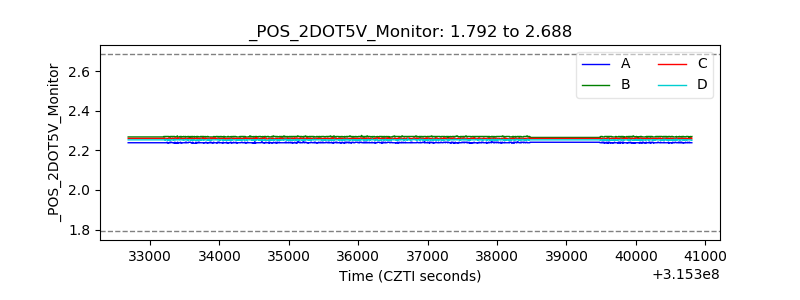 |
| +5 Volts monitor |  |
| _ROLL_ROT | 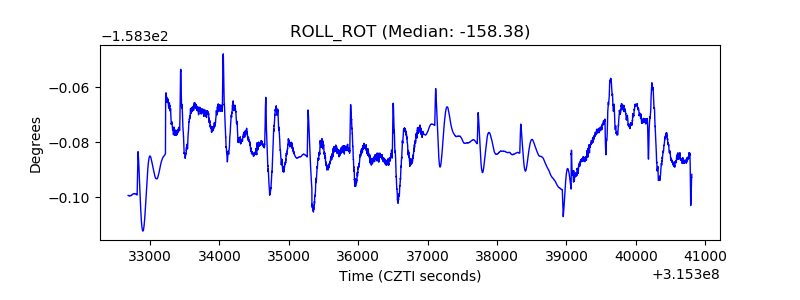 |
| _Roll_DEC | 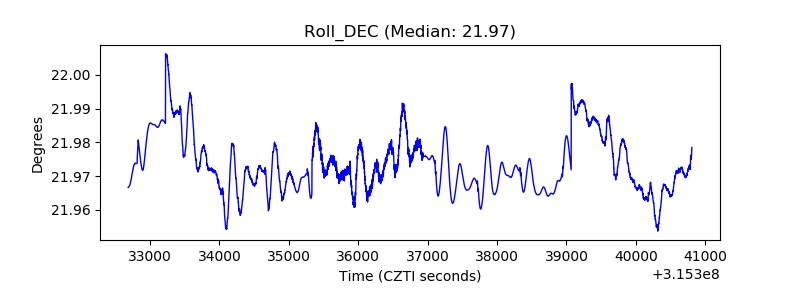 |
| _Roll_RA | 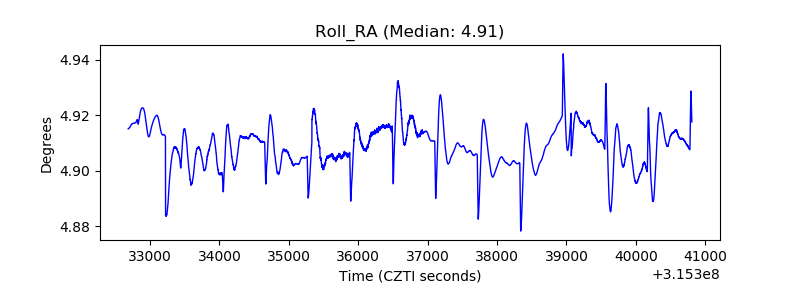 |
| Veto Counter | 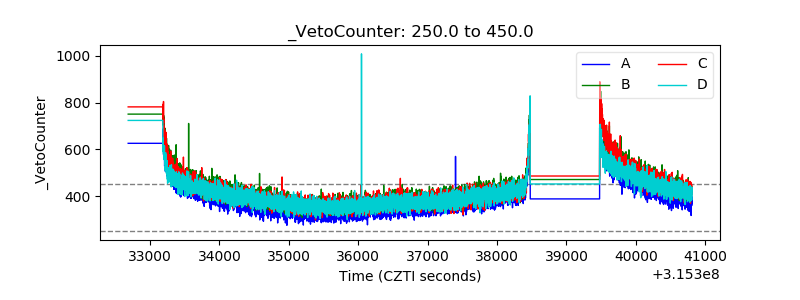 |