| Param | Original file | Final file |
|---|---|---|
| Filename | modeM0/AS1A08_004T03_9000003400_22997cztM0_level2.evt | modeM0/AS1A08_004T03_9000003400_22997cztM0_level2_quad_clean.evt |
| Size (bytes) | 465,713,280 | 94,570,560 |
| Size | 444.1 MB | 90.2 MB |
| Events in quadrant A | 3,134,722 | 613,503 |
| Events in quadrant B | 3,278,755 | 627,828 |
| Events in quadrant C | 3,208,352 | 594,217 |
| Events in quadrant D | 4,039,367 | 573,682 |
| Mode M0 | |||
|---|---|---|---|
| Quadrant | BADHDUFLAG | Total packets | Discarded packets |
| A | 0 | 13468 | 2 |
| B | 0 | 13894 | 2 |
| C | 0 | 13567 | 2 |
| D | 0 | 16483 | 2 |
| Mode SS | |||
|---|---|---|---|
| Quadrant | BADHDUFLAG | Total packets | Discarded packets |
| A | 0 | 134 | 0 |
| B | 0 | 134 | 0 |
| C | 0 | 134 | 0 |
| D | 0 | 134 | 0 |
| Mode M9 | |||
|---|---|---|---|
| Quadrant | BADHDUFLAG | Total packets | Discarded packets |
| A | 0 | 16 | 0 |
| B | 0 | 17 | 0 |
| C | 0 | 17 | 0 |
| D | 0 | 17 | 0 |
| Quadrant | Total seconds | Saturated seconds | Saturation percentage |
|---|---|---|---|
| A | 6517 | 19 | 0.291545% |
| B | 6517 | 49 | 0.751880% |
| C | 6516 | 63 | 0.966851% |
| D | 6516 | 103 | 1.580724% |
Noise dominated data is calculated using 1-second bins in cleaned event files. If a bin has >2000 counts, and if more than 50% of those come from <1% of pixels, then it is considered to be noise-dominated and hence unusable.
| Quadrant | # 1 sec bins | Bins with >0 counts | Bins with >2000 counts | High rate bins dominated by noise | Noise dominated (total time) | Noise dominated (detector-on time) | Marked lightcurve |
|---|---|---|---|---|---|---|---|
| A | 7662 | 6518 | 0 | 0 | 0.00% | 0.00% | 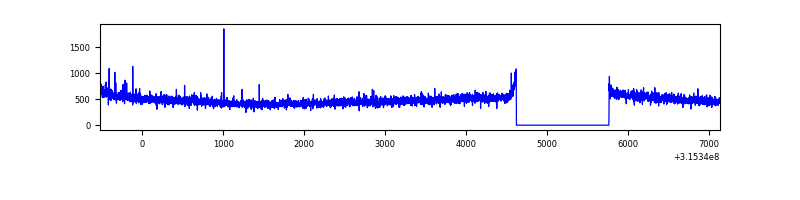 |
| B | 7662 | 6518 | 16 | 16 | 0.21% | 0.25% |  |
| C | 7661 | 6517 | 0 | 0 | 0.00% | 0.00% |  |
| D | 7661 | 6517 | 61 | 61 | 0.80% | 0.94% | 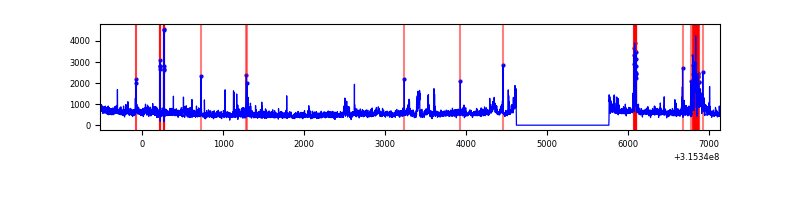 |
Top three noisy pixels from each quadrant. If the there are fewer than three noisy pixels in the level2.evt file, extra rows are filled as -1
| Pixel properties | Quadrant properties | ||||||
|---|---|---|---|---|---|---|---|
| Quadrant | DetID | PixID | Counts | Sigma | Mean | Median | Sigma |
| A | 11 | 47 | 25316 | 151.44 | 806 | 788 | 162.0 |
| A | 13 | 254 | 10359 | 59.09 | 806 | 788 | 162.0 |
| A | 0 | 226 | 7018 | 38.46 | 806 | 788 | 162.0 |
| B | 4 | 216 | 64894 | 415.92 | 807 | 788 | 154.1 |
| B | 0 | 189 | 45915 | 292.78 | 807 | 788 | 154.1 |
| B | 12 | 111 | 18268 | 113.41 | 807 | 788 | 154.1 |
| C | 14 | 238 | 124803 | 678.76 | 780 | 789 | 182.7 |
| C | 0 | 10 | 24188 | 128.07 | 780 | 789 | 182.7 |
| C | 7 | 247 | 17533 | 91.64 | 780 | 789 | 182.7 |
| D | 1 | 52 | 417823 | 2203.08 | 781 | 759 | 189.3 |
| D | 2 | 152 | 217305 | 1143.87 | 781 | 759 | 189.3 |
| D | 10 | 230 | 134668 | 707.35 | 781 | 759 | 189.3 |
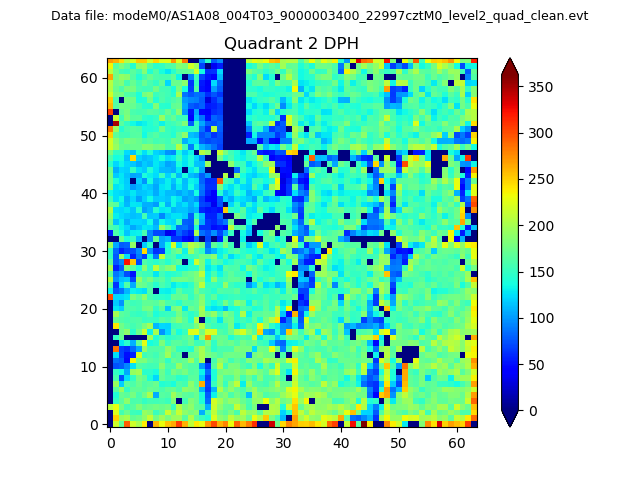
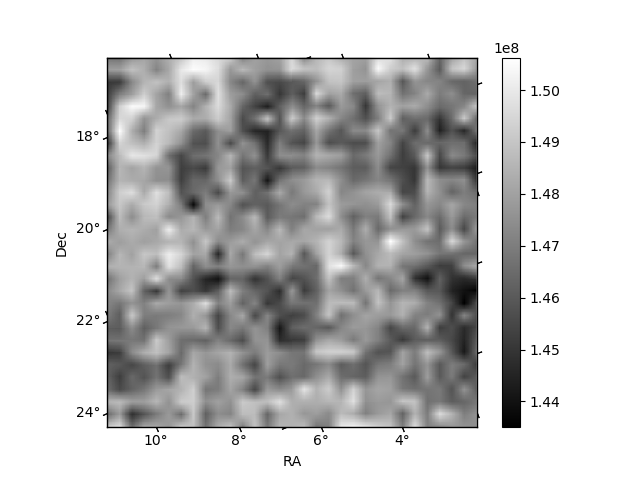
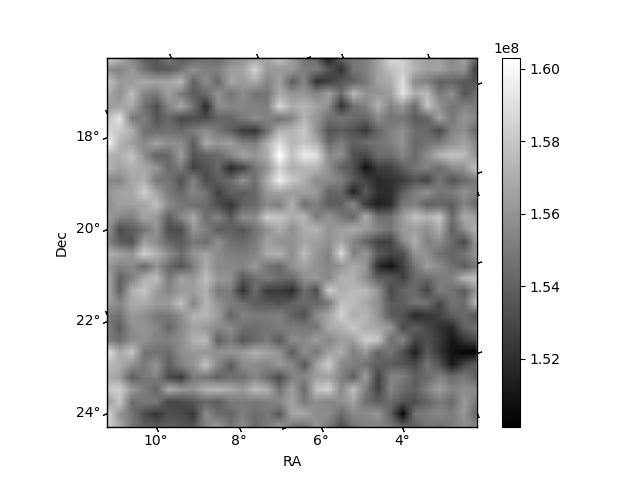
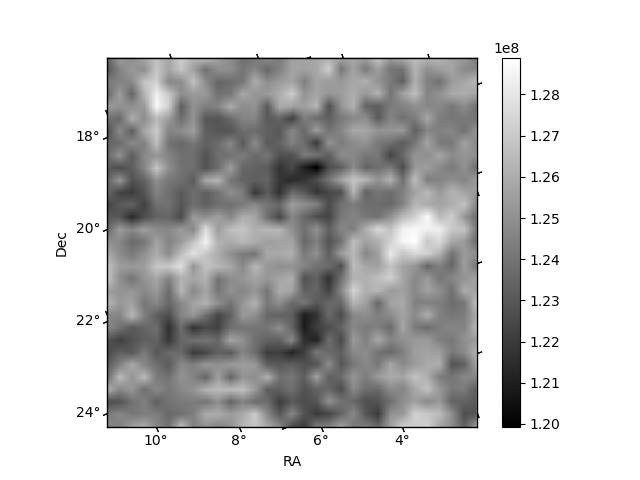
Histogram calculated using DETX and DETY for each event in the final _common_clean file
| Quadrant A | 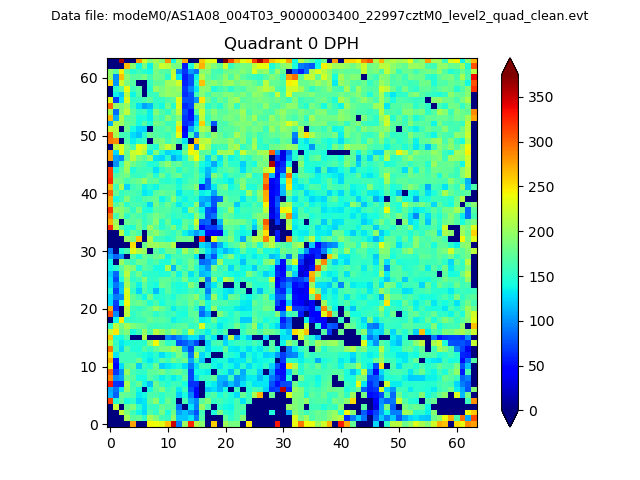 |
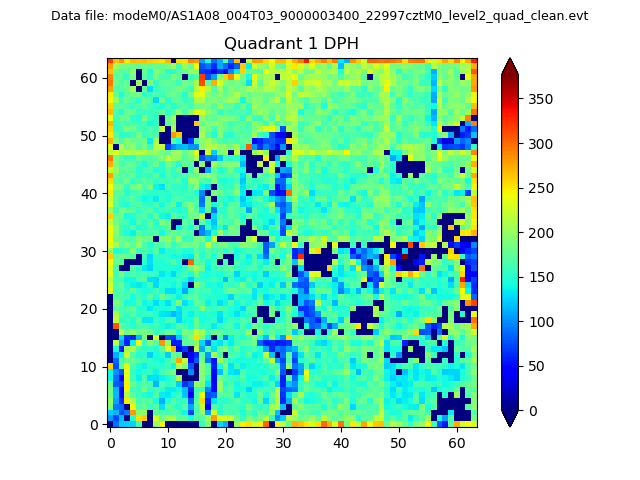 |
Quadrant B |
|---|---|---|---|
| Quadrant D | 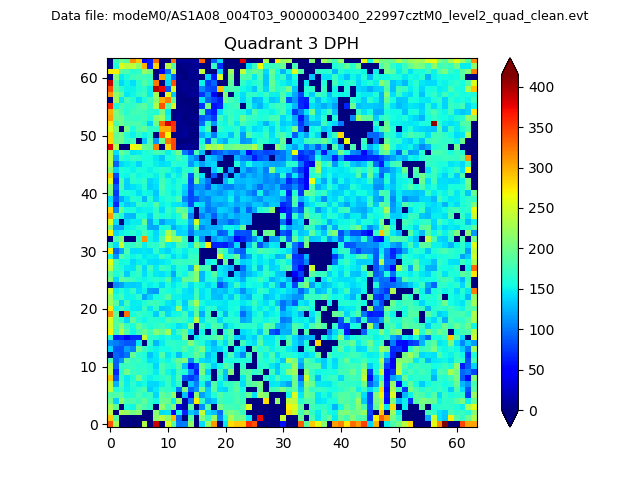 |
 |
Quadrant C |
| Plot type | Count rate plots | Images |
|---|---|---|
| Comparison with Poisson distribution Blue bars denote a histogram of data divided into 1 sec bins. Red curve is a Poisson curve with rate = median count rate of data. |
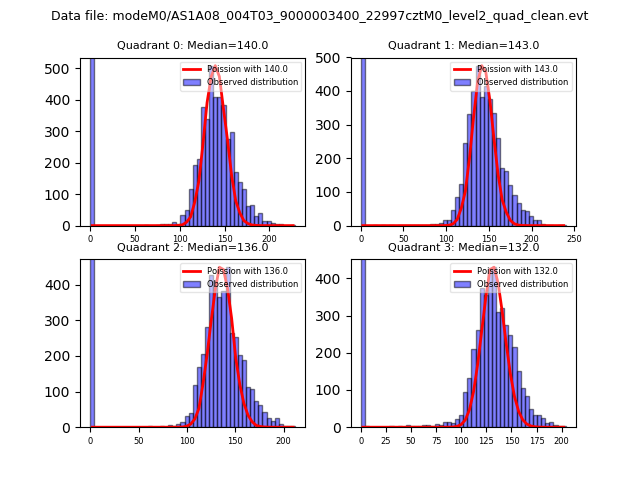 |
 |
| Quadrant-wise count rates Data is divided into 100 sec bins |
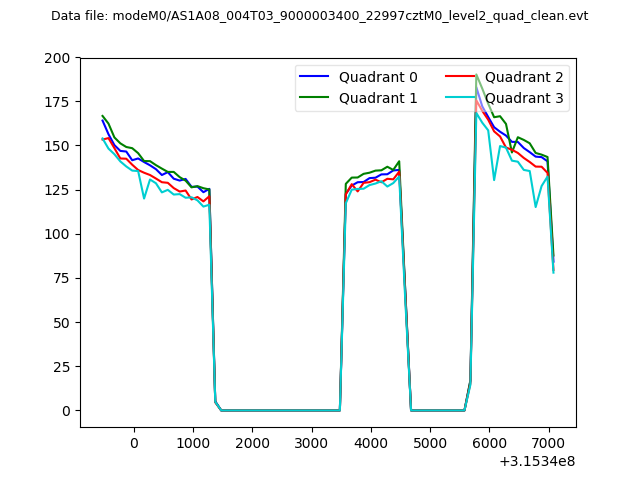 |
|
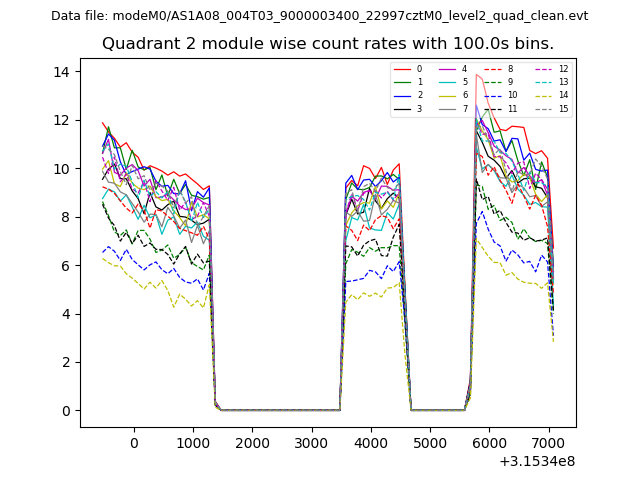
| Module-wise count rates for Quadrant A Data is divided into 100 sec bins |
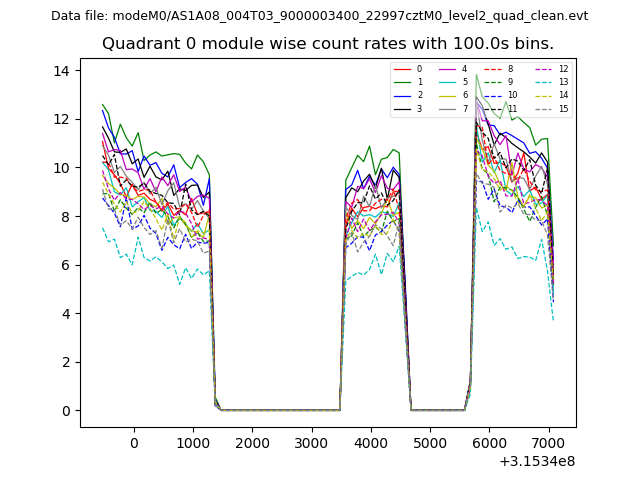 |
 |
| Module-wise count rates for Quadrant B Data is divided into 100 sec bins |
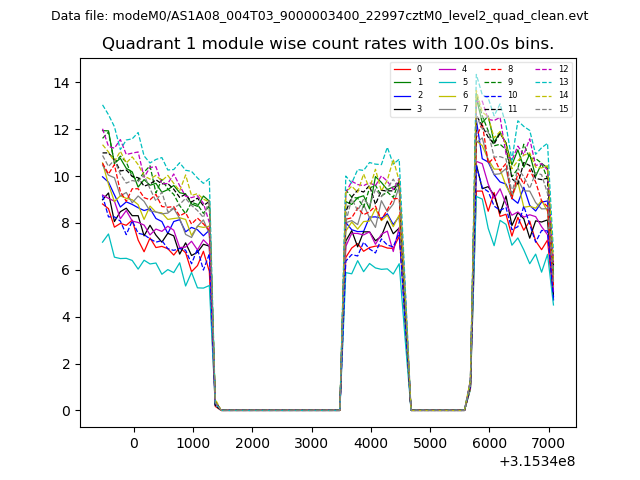 |
 |
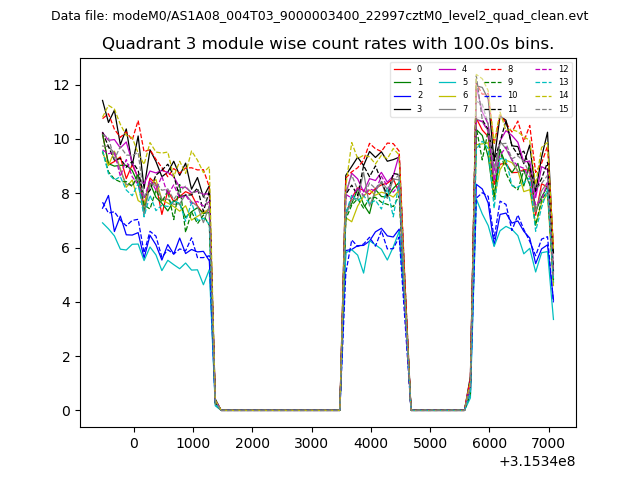
| Module-wise count rates for Quadrant C Data is divided into 100 sec bins |
 |
 |
| Module-wise count rates for Quadrant D Data is divided into 100 sec bins |
 |
 |
| Parameter | Plot |
|---|---|
| CZT HV Monitor | 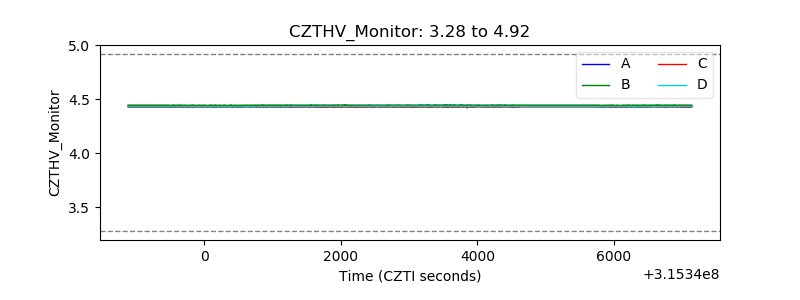 |
| D_VDD | 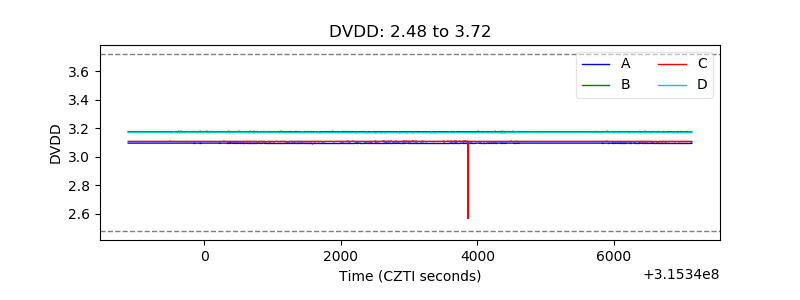 |
| Temperature 1 | 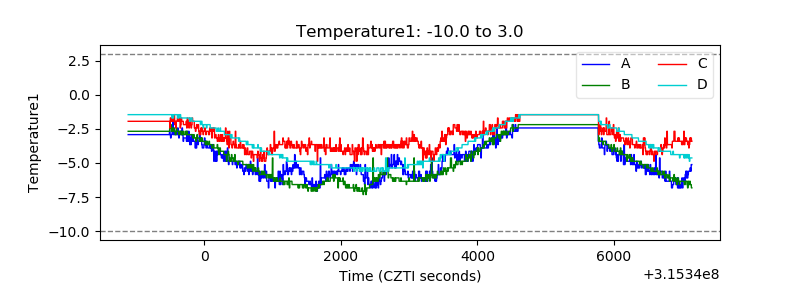 |
| Veto HV Monitor | 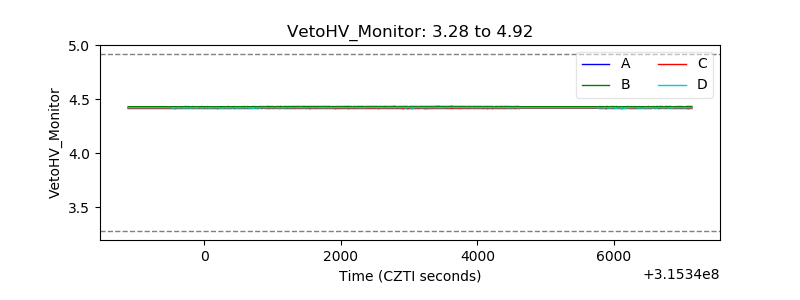 |
| Veto LLD | 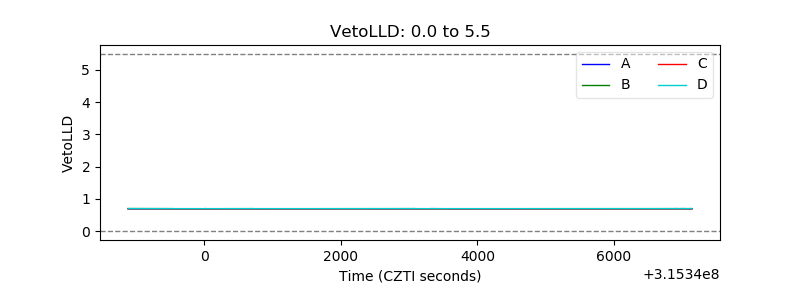 |
| Alpha Counter | 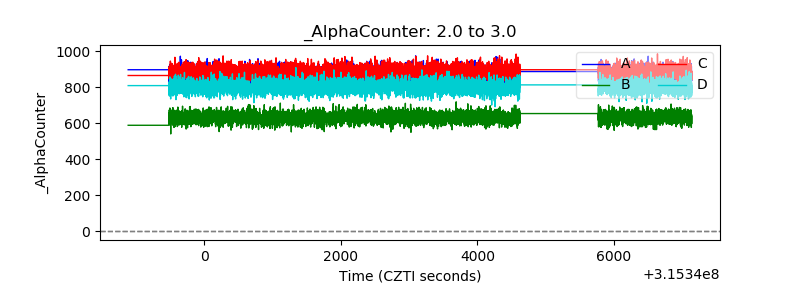 |
| _CPM_Rate | 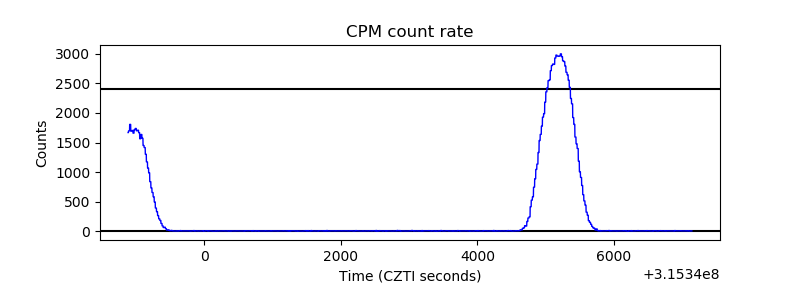 |
| CZT Counter | 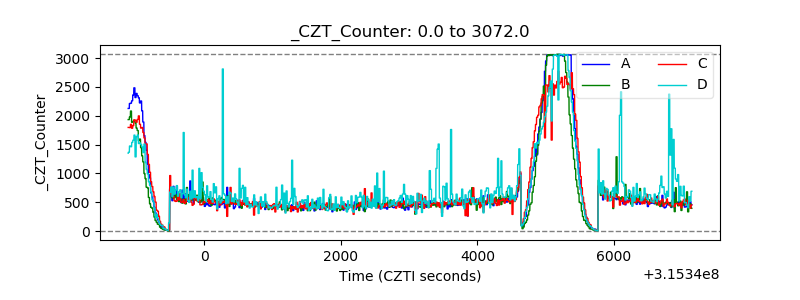 |
| +2.5 Volts monitor |  |
| +5 Volts monitor |  |
| _ROLL_ROT | 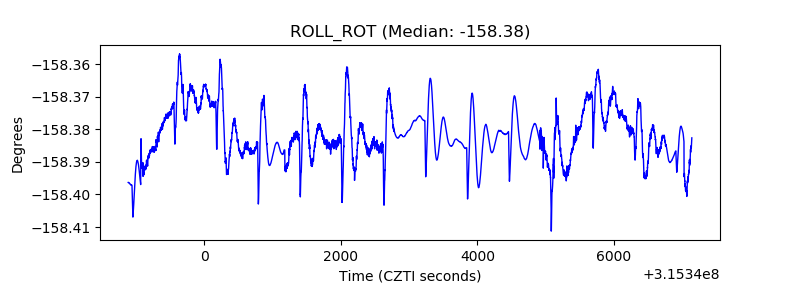 |
| _Roll_DEC | 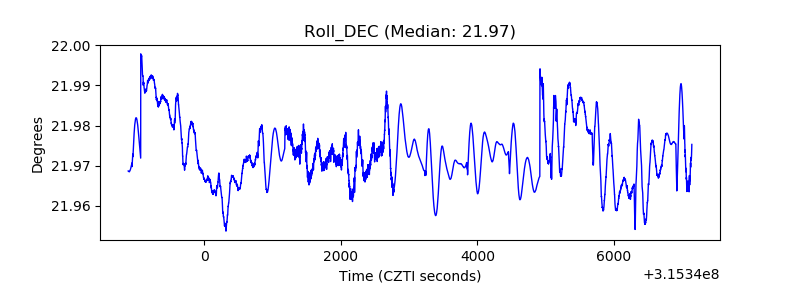 |
| _Roll_RA | 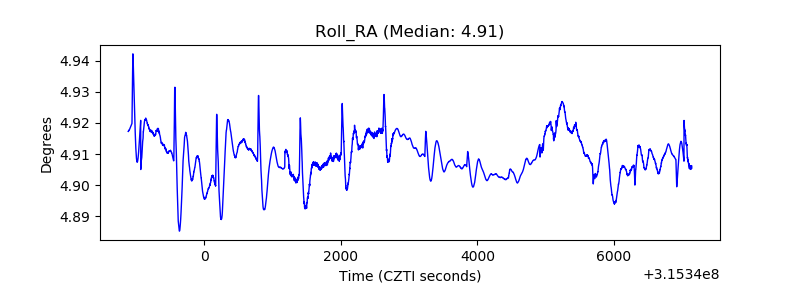 |
| Veto Counter | 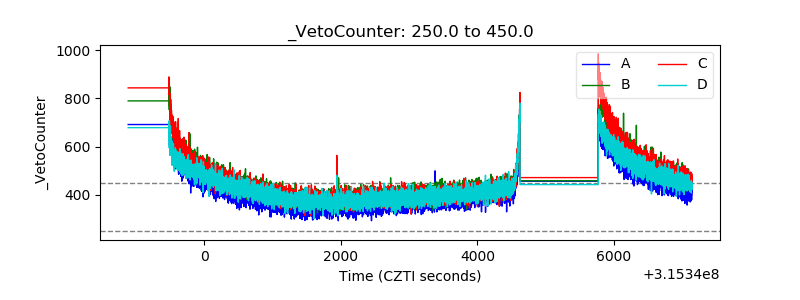 |