| Param | Original file | Final file |
|---|---|---|
| Filename | modeM0/AS1A08_004T03_9000003400_23001cztM0_level2.evt | modeM0/AS1A08_004T03_9000003400_23001cztM0_level2_quad_clean.evt |
| Size (bytes) | 446,958,720 | 59,333,760 |
| Size | 426.3 MB | 56.6 MB |
| Events in quadrant A | 3,136,275 | 349,912 |
| Events in quadrant B | 3,301,316 | 358,245 |
| Events in quadrant C | 3,211,291 | 337,952 |
| Events in quadrant D | 3,474,782 | 326,137 |
| Mode M0 | |||
|---|---|---|---|
| Quadrant | BADHDUFLAG | Total packets | Discarded packets |
| A | 0 | 12748 | 1 |
| B | 0 | 13341 | 1 |
| C | 0 | 13064 | 1 |
| D | 0 | 14148 | 1 |
| Mode SS | |||
|---|---|---|---|
| Quadrant | BADHDUFLAG | Total packets | Discarded packets |
| A | 0 | 122 | 0 |
| B | 0 | 122 | 0 |
| C | 0 | 122 | 0 |
| D | 0 | 122 | 0 |
| Mode M9 | |||
|---|---|---|---|
| Quadrant | BADHDUFLAG | Total packets | Discarded packets |
| A | 0 | 14 | 0 |
| B | 0 | 14 | 0 |
| C | 0 | 14 | 0 |
| D | 0 | 14 | 0 |
| Quadrant | Total seconds | Saturated seconds | Saturation percentage |
|---|---|---|---|
| A | 6078 | 17 | 0.279697% |
| B | 6078 | 39 | 0.641658% |
| C | 6078 | 73 | 1.201053% |
| D | 6078 | 82 | 1.349128% |
Noise dominated data is calculated using 1-second bins in cleaned event files. If a bin has >2000 counts, and if more than 50% of those come from <1% of pixels, then it is considered to be noise-dominated and hence unusable.
| Quadrant | # 1 sec bins | Bins with >0 counts | Bins with >2000 counts | High rate bins dominated by noise | Noise dominated (total time) | Noise dominated (detector-on time) | Marked lightcurve |
|---|---|---|---|---|---|---|---|
| A | 7443 | 6079 | 0 | 0 | 0.00% | 0.00% | 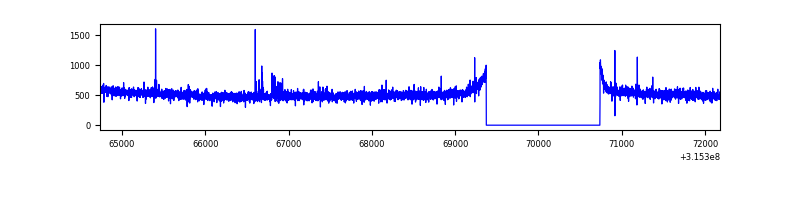 |
| B | 7443 | 6079 | 3 | 3 | 0.04% | 0.05% | 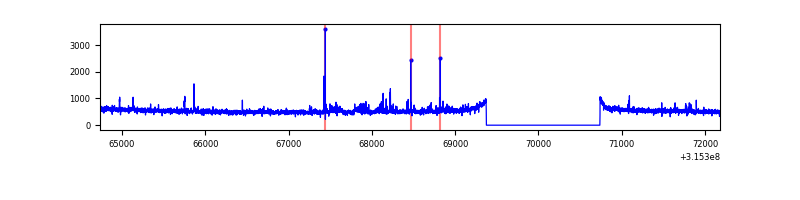 |
| C | 7443 | 6079 | 0 | 0 | 0.00% | 0.00% | 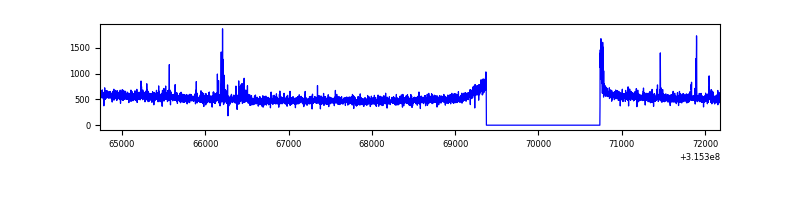 |
| D | 7443 | 6079 | 54 | 54 | 0.73% | 0.89% | 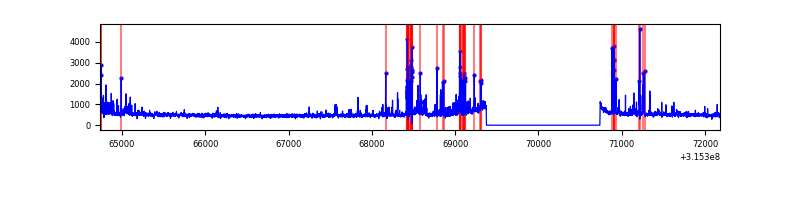 |
Top three noisy pixels from each quadrant. If the there are fewer than three noisy pixels in the level2.evt file, extra rows are filled as -1
| Pixel properties | Quadrant properties | ||||||
|---|---|---|---|---|---|---|---|
| Quadrant | DetID | PixID | Counts | Sigma | Mean | Median | Sigma |
| A | 10 | 17 | 19030 | 114.18 | 807 | 796 | 159.7 |
| A | 13 | 254 | 9252 | 52.95 | 807 | 796 | 159.7 |
| A | 0 | 226 | 6975 | 38.69 | 807 | 796 | 159.7 |
| B | 0 | 189 | 106456 | 696.77 | 810 | 792 | 151.6 |
| B | 4 | 216 | 19427 | 122.88 | 810 | 792 | 151.6 |
| B | 12 | 111 | 17853 | 112.5 | 810 | 792 | 151.6 |
| C | 14 | 238 | 124864 | 697.47 | 771 | 780 | 177.9 |
| C | 7 | 247 | 66991 | 372.17 | 771 | 780 | 177.9 |
| C | 0 | 10 | 15004 | 79.95 | 771 | 780 | 177.9 |
| D | 1 | 52 | 259588 | 1375.68 | 773 | 751 | 188.2 |
| D | 13 | 153 | 171987 | 910.1 | 773 | 751 | 188.2 |
| D | 12 | 227 | 64197 | 337.21 | 773 | 751 | 188.2 |
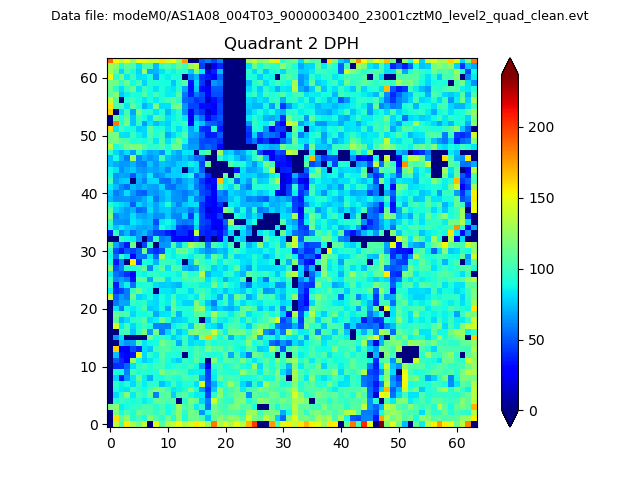
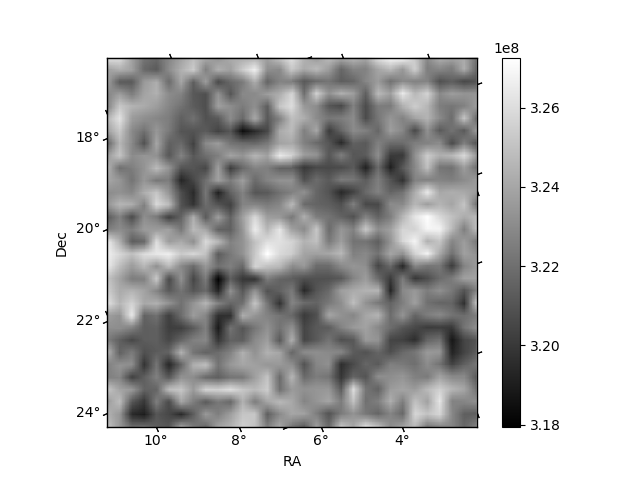
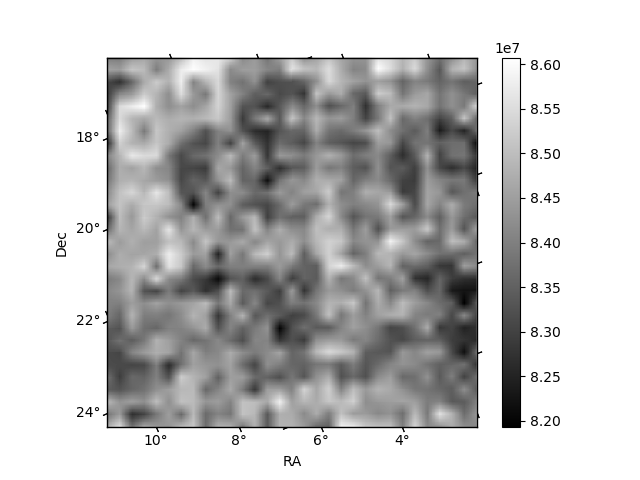
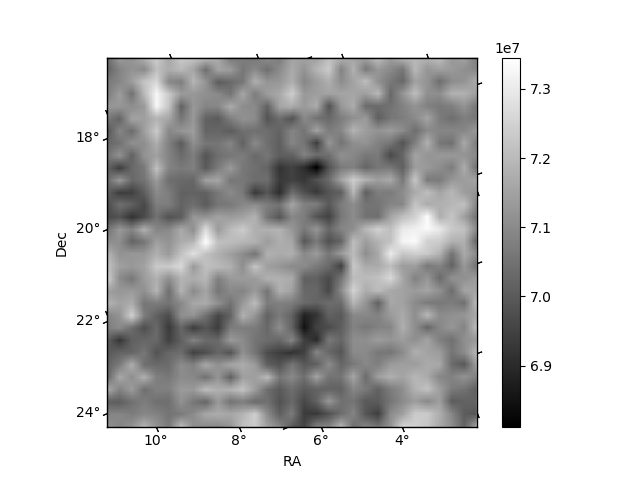
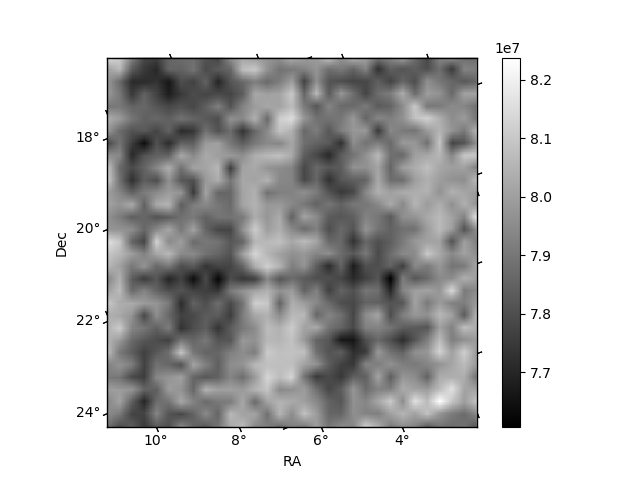
Histogram calculated using DETX and DETY for each event in the final _common_clean file
| Quadrant A | 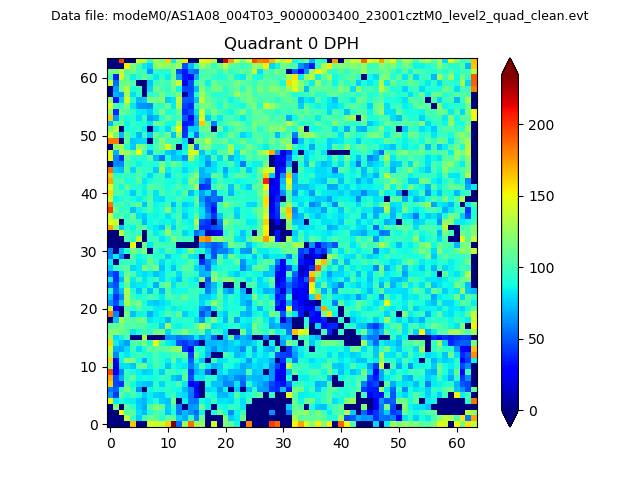 |
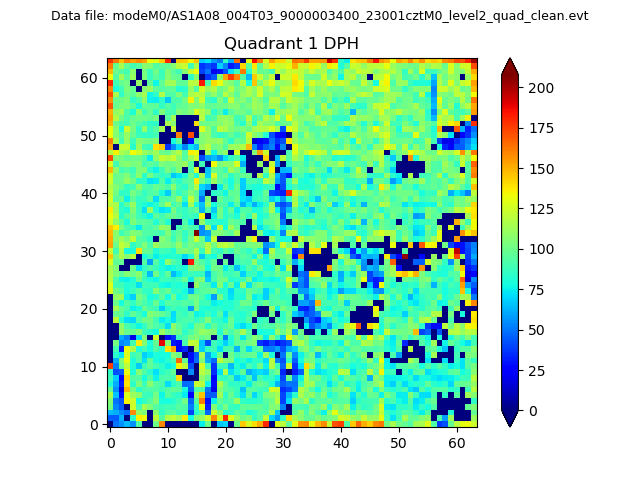 |
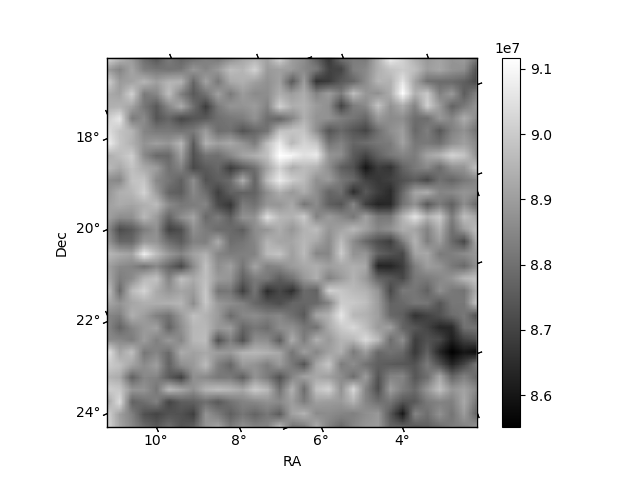
Quadrant B |
|---|---|---|---|
| Quadrant D | 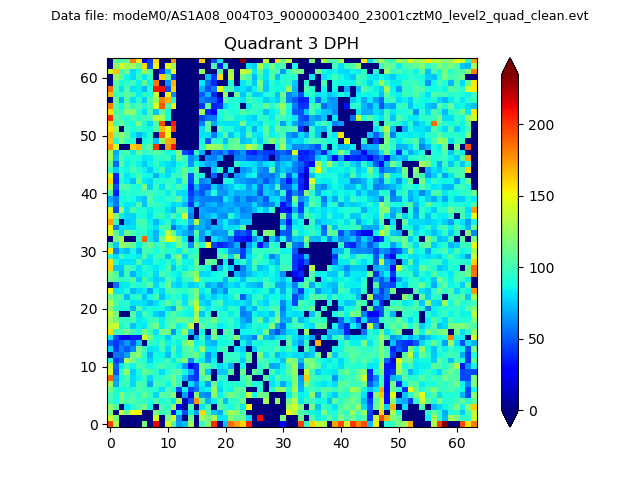 |
 |
Quadrant C |
| Plot type | Count rate plots | Images |
|---|---|---|
| Comparison with Poisson distribution Blue bars denote a histogram of data divided into 1 sec bins. Red curve is a Poisson curve with rate = median count rate of data. |
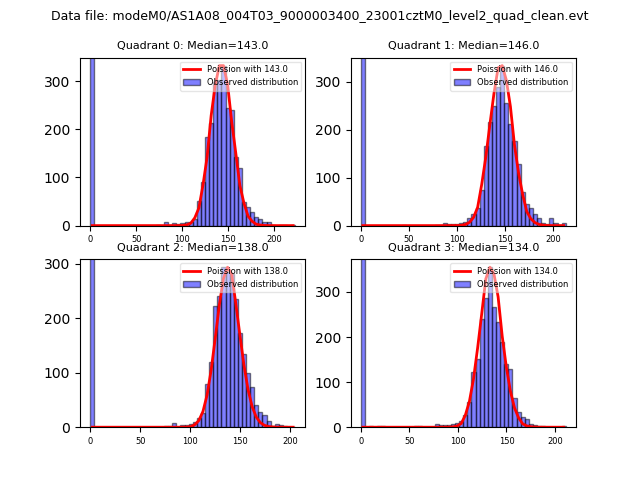 |
 |
| Quadrant-wise count rates Data is divided into 100 sec bins |
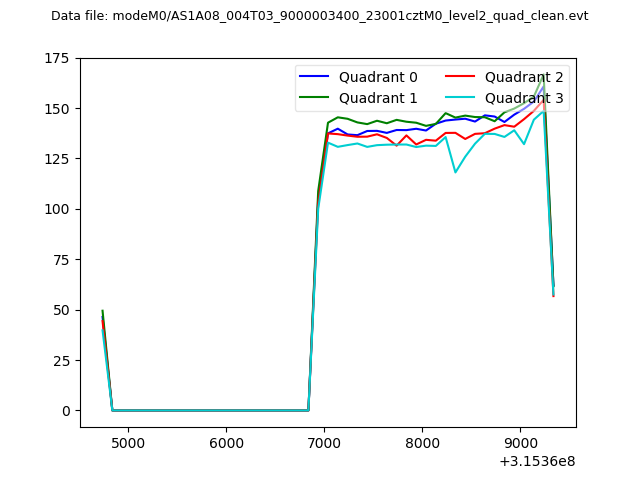 |
|
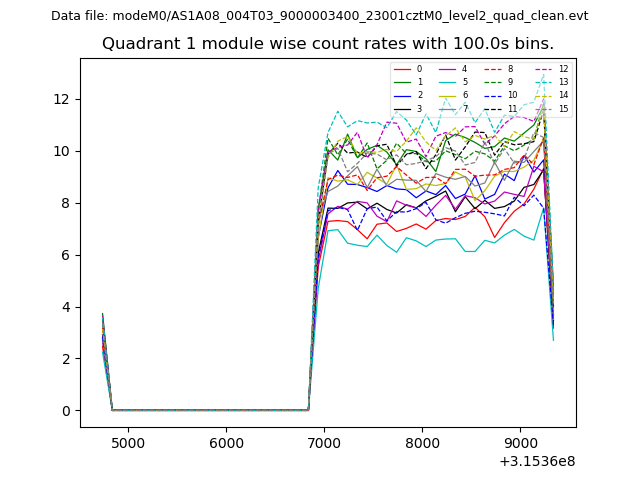
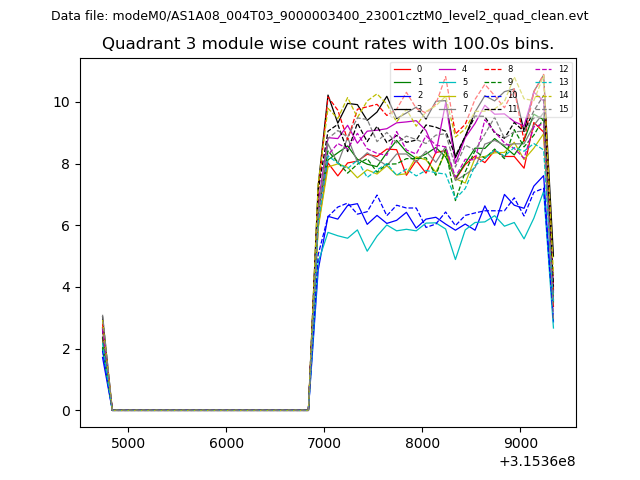
| Module-wise count rates for Quadrant A Data is divided into 100 sec bins |
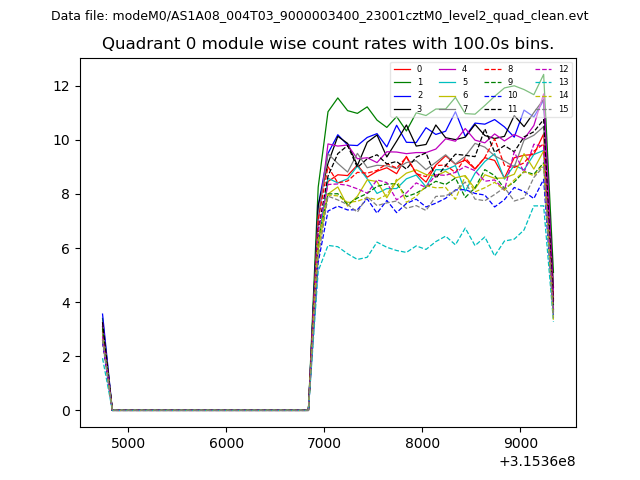 |
 |
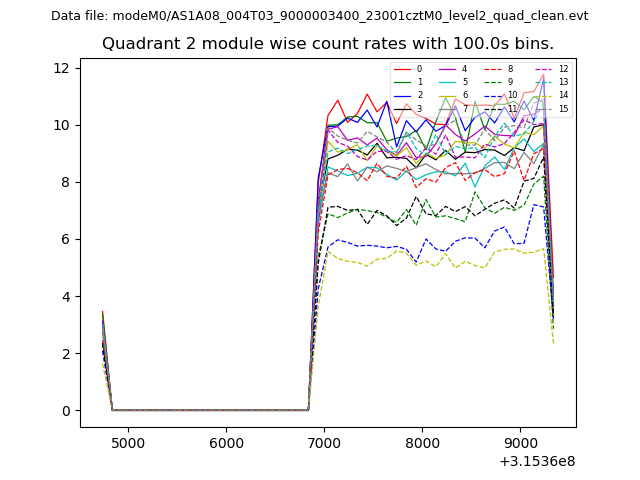
| Module-wise count rates for Quadrant B Data is divided into 100 sec bins |
 |
 |
| Module-wise count rates for Quadrant C Data is divided into 100 sec bins |
 |
 |
| Module-wise count rates for Quadrant D Data is divided into 100 sec bins |
 |
 |
| Parameter | Plot |
|---|---|
| CZT HV Monitor | 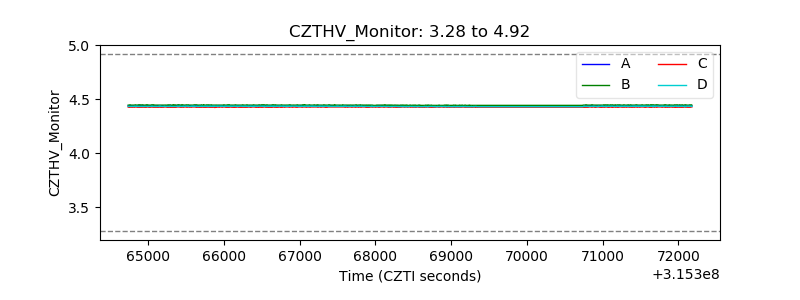 |
| D_VDD | 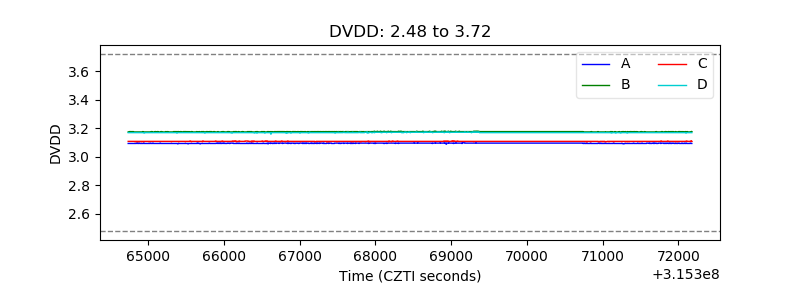 |
| Temperature 1 | 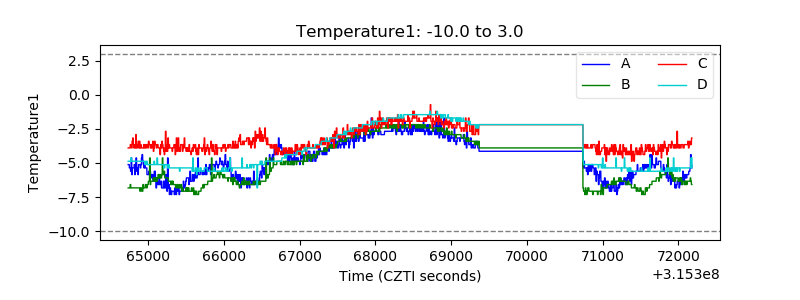 |
| Veto HV Monitor | 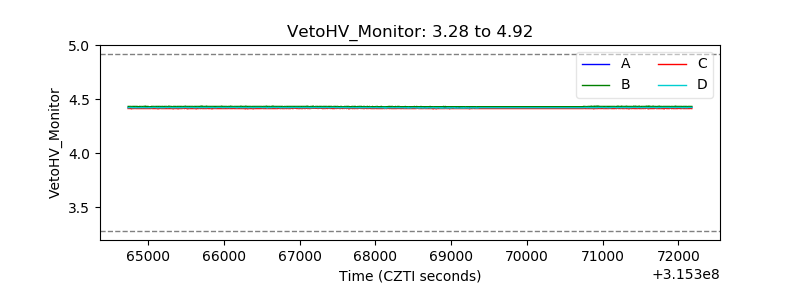 |
| Veto LLD | 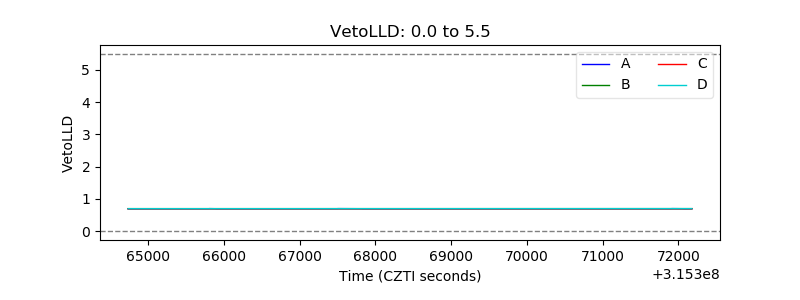 |
| Alpha Counter | 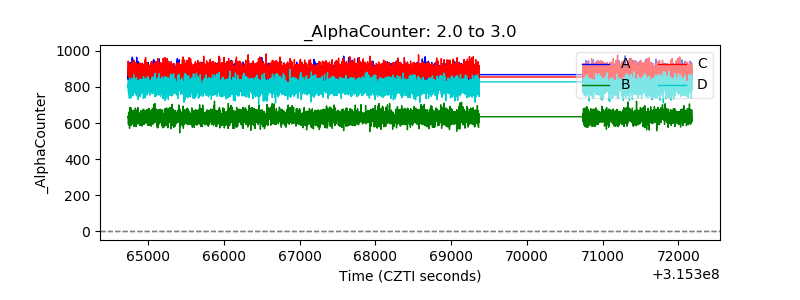 |
| _CPM_Rate | 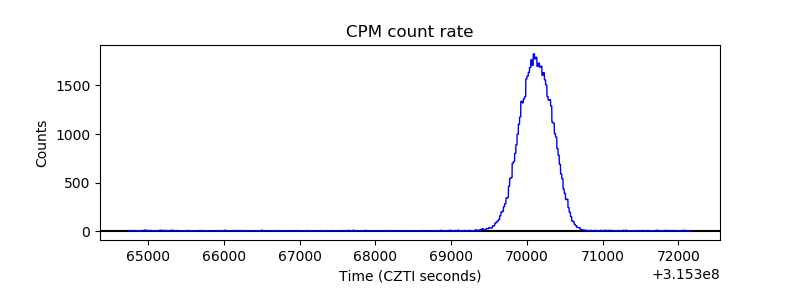 |
| CZT Counter | 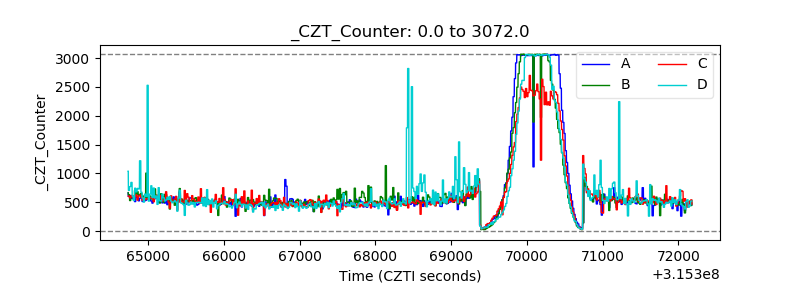 |
| +2.5 Volts monitor | 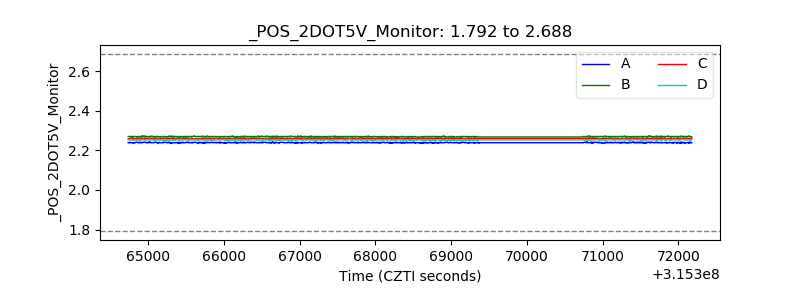 |
| +5 Volts monitor |  |
| _ROLL_ROT | 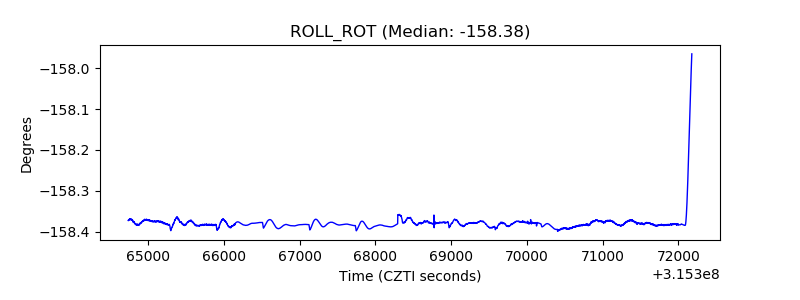 |
| _Roll_DEC | 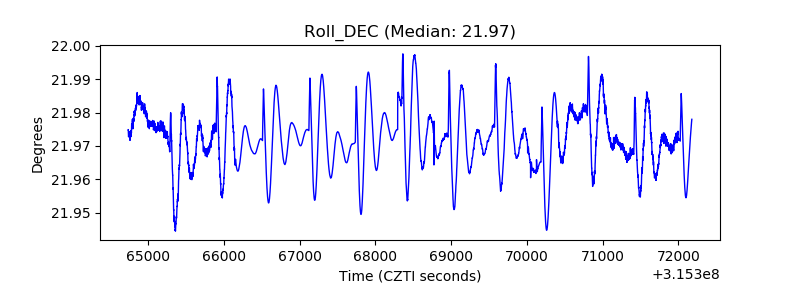 |
| _Roll_RA | 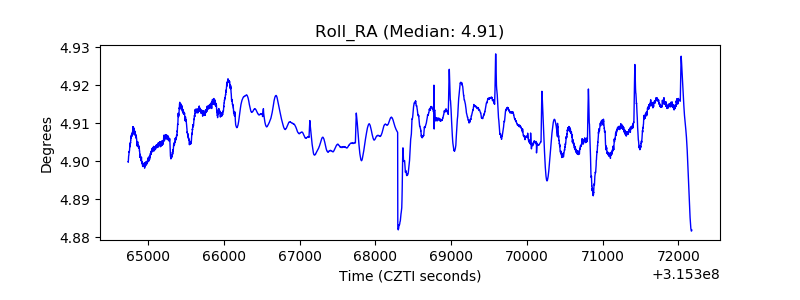 |
| Veto Counter | 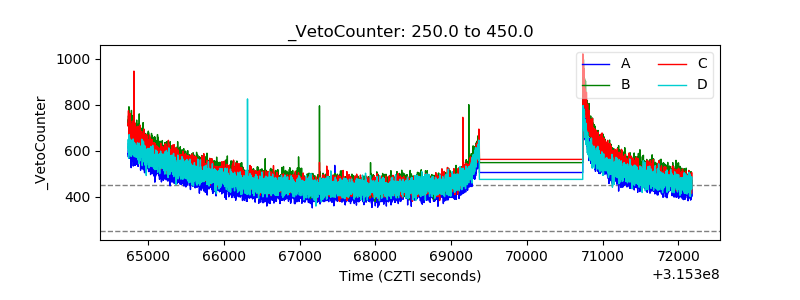 |