| Param | Original file | Final file |
|---|---|---|
| Filename | modeM0/AS1A08_004T03_9000003400_23002cztM0_level2.evt | modeM0/AS1A08_004T03_9000003400_23002cztM0_level2_quad_clean.evt |
| Size (bytes) | 477,322,560 | 70,104,960 |
| Size | 455.2 MB | 66.9 MB |
| Events in quadrant A | 3,273,675 | 426,481 |
| Events in quadrant B | 3,405,314 | 433,035 |
| Events in quadrant C | 3,367,640 | 411,018 |
| Events in quadrant D | 3,970,040 | 401,117 |
| Mode M0 | |||
|---|---|---|---|
| Quadrant | BADHDUFLAG | Total packets | Discarded packets |
| A | 0 | 13536 | 2 |
| B | 0 | 13917 | 2 |
| C | 0 | 13823 | 2 |
| D | 0 | 15903 | 2 |
| Mode SS | |||
|---|---|---|---|
| Quadrant | BADHDUFLAG | Total packets | Discarded packets |
| A | 0 | 132 | 0 |
| B | 0 | 132 | 0 |
| C | 0 | 132 | 0 |
| D | 0 | 132 | 0 |
| Mode M9 | |||
|---|---|---|---|
| Quadrant | BADHDUFLAG | Total packets | Discarded packets |
| A | 0 | 13 | 0 |
| B | 0 | 14 | 0 |
| C | 0 | 14 | 0 |
| D | 0 | 14 | 0 |
| Quadrant | Total seconds | Saturated seconds | Saturation percentage |
|---|---|---|---|
| A | 6463 | 71 | 1.098561% |
| B | 6463 | 109 | 1.686523% |
| C | 6463 | 134 | 2.073341% |
| D | 6463 | 150 | 2.320904% |
Noise dominated data is calculated using 1-second bins in cleaned event files. If a bin has >2000 counts, and if more than 50% of those come from <1% of pixels, then it is considered to be noise-dominated and hence unusable.
| Quadrant | # 1 sec bins | Bins with >0 counts | Bins with >2000 counts | High rate bins dominated by noise | Noise dominated (total time) | Noise dominated (detector-on time) | Marked lightcurve |
|---|---|---|---|---|---|---|---|
| A | 7573 | 6464 | 0 | 0 | 0.00% | 0.00% | 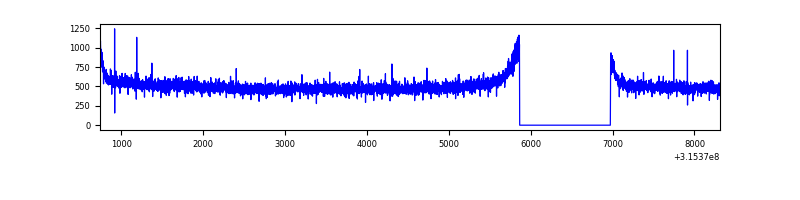 |
| B | 7573 | 6464 | 8 | 8 | 0.11% | 0.12% | 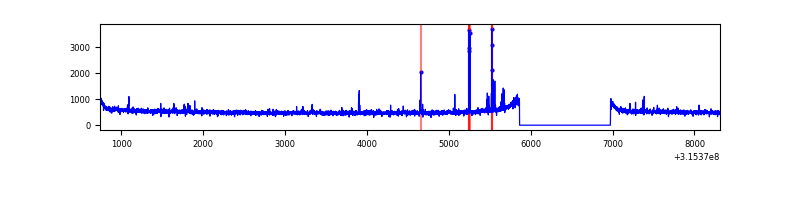 |
| C | 7573 | 6464 | 4 | 4 | 0.05% | 0.06% | 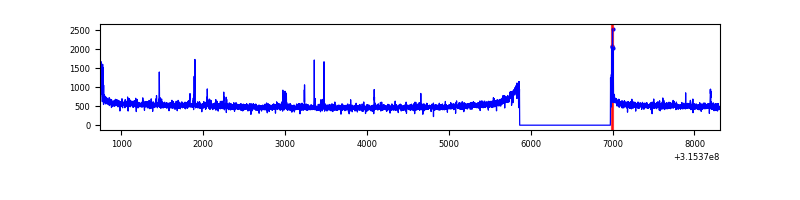 |
| D | 7573 | 6464 | 70 | 70 | 0.92% | 1.08% | 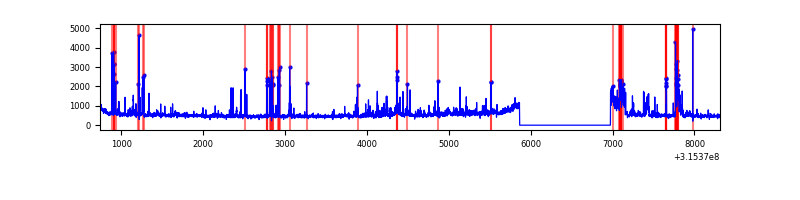 |
Top three noisy pixels from each quadrant. If the there are fewer than three noisy pixels in the level2.evt file, extra rows are filled as -1
| Pixel properties | Quadrant properties | ||||||
|---|---|---|---|---|---|---|---|
| Quadrant | DetID | PixID | Counts | Sigma | Mean | Median | Sigma |
| A | 13 | 254 | 9417 | 50.89 | 849 | 833 | 168.7 |
| A | 3 | 137 | 7276 | 38.19 | 849 | 833 | 168.7 |
| A | 0 | 226 | 7126 | 37.3 | 849 | 833 | 168.7 |
| B | 4 | 216 | 47020 | 286.67 | 848 | 827 | 161.1 |
| B | 0 | 189 | 35986 | 218.19 | 848 | 827 | 161.1 |
| B | 12 | 111 | 19570 | 116.32 | 848 | 827 | 161.1 |
| C | 14 | 238 | 130002 | 685.33 | 809 | 815 | 188.5 |
| C | 7 | 247 | 45182 | 235.37 | 809 | 815 | 188.5 |
| C | 0 | 10 | 32107 | 166.0 | 809 | 815 | 188.5 |
| D | 1 | 52 | 417271 | 2114.03 | 814 | 793 | 197.0 |
| D | 13 | 153 | 158283 | 799.41 | 814 | 793 | 197.0 |
| D | 2 | 152 | 133113 | 671.65 | 814 | 793 | 197.0 |
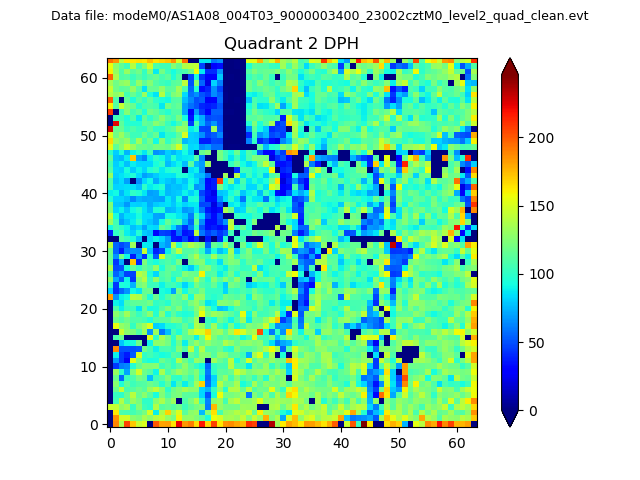
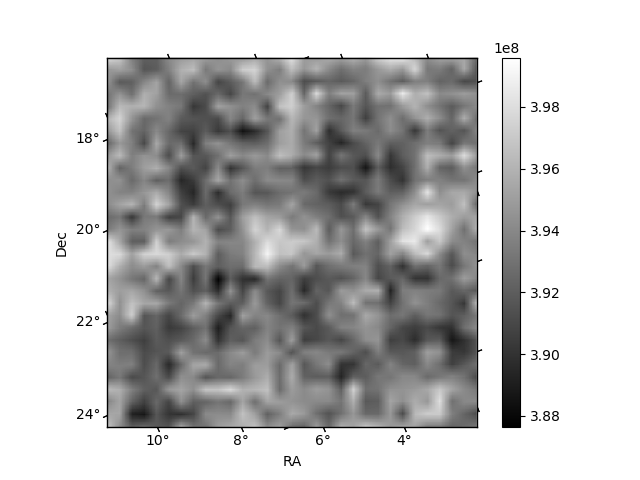
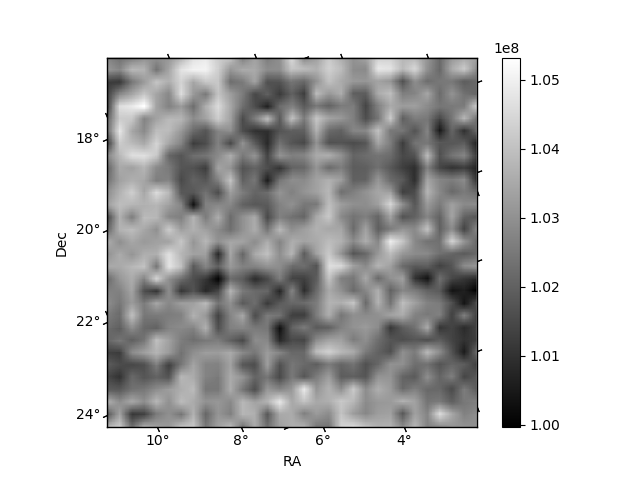
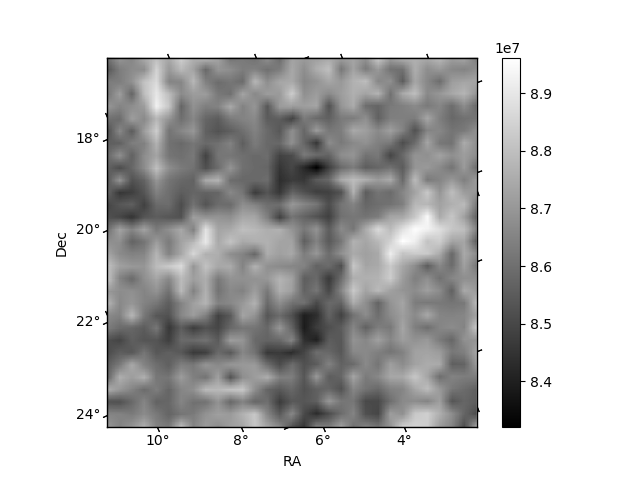
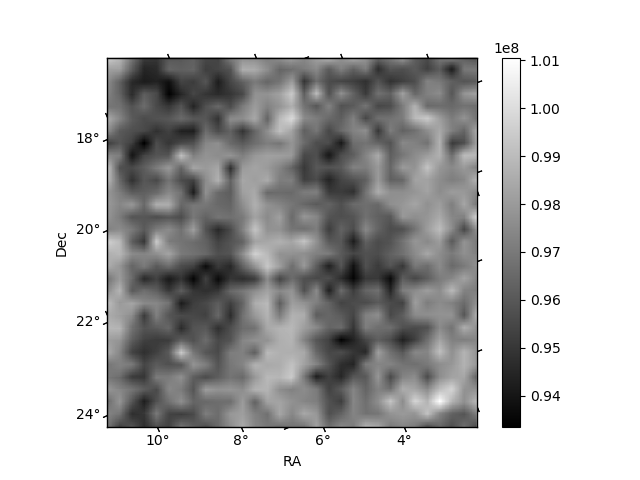
Histogram calculated using DETX and DETY for each event in the final _common_clean file
| Quadrant A | 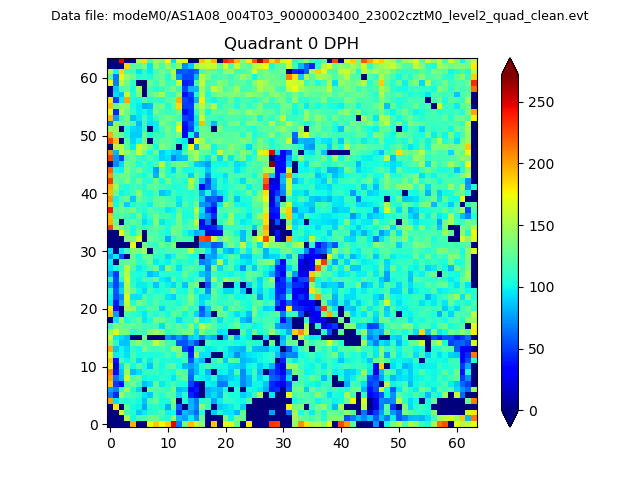 |
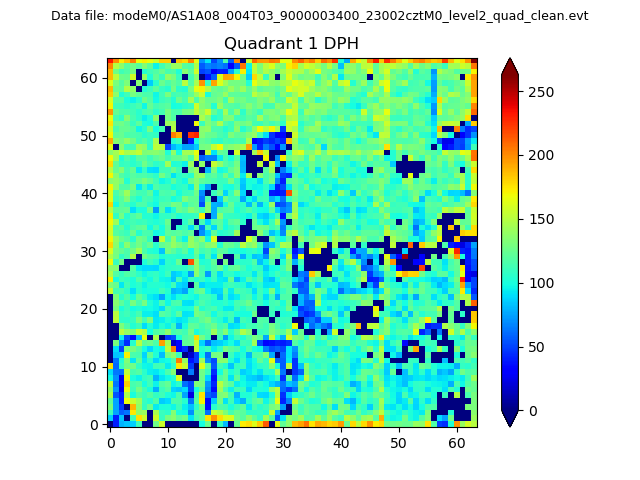 |
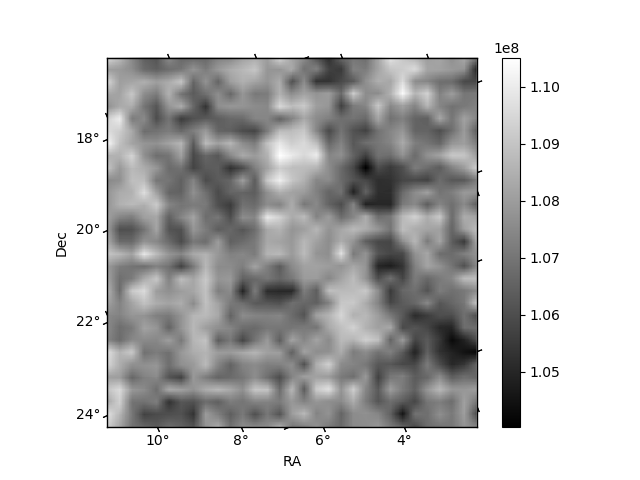
Quadrant B |
|---|---|---|---|
| Quadrant D | 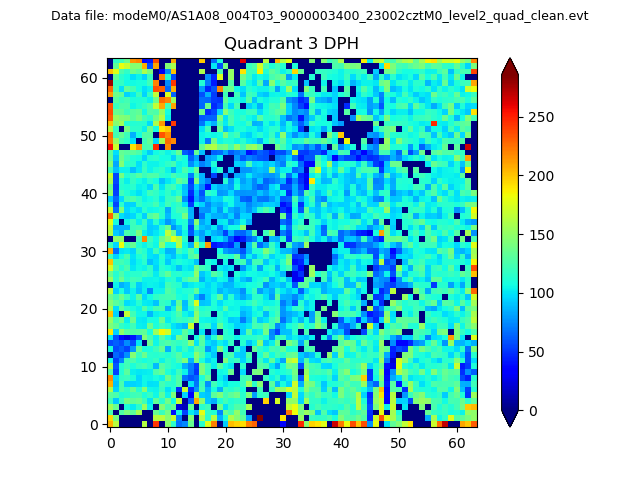 |
 |
Quadrant C |
| Plot type | Count rate plots | Images |
|---|---|---|
| Comparison with Poisson distribution Blue bars denote a histogram of data divided into 1 sec bins. Red curve is a Poisson curve with rate = median count rate of data. |
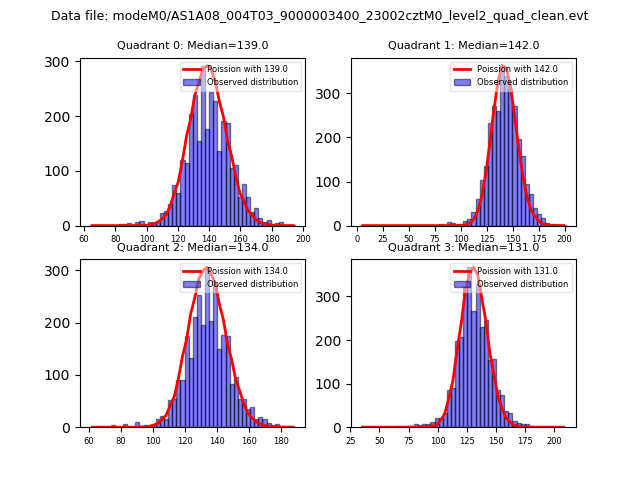 |
 |
| Quadrant-wise count rates Data is divided into 100 sec bins |
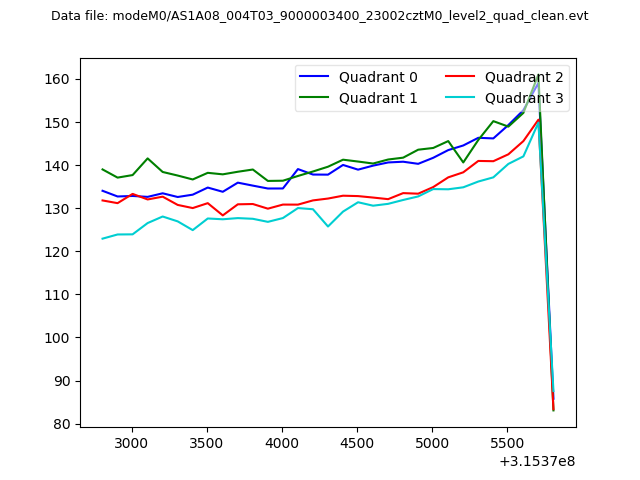 |
|
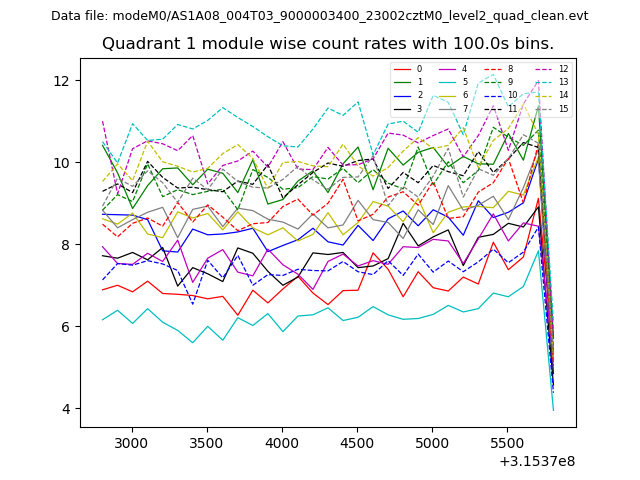
| Module-wise count rates for Quadrant A Data is divided into 100 sec bins |
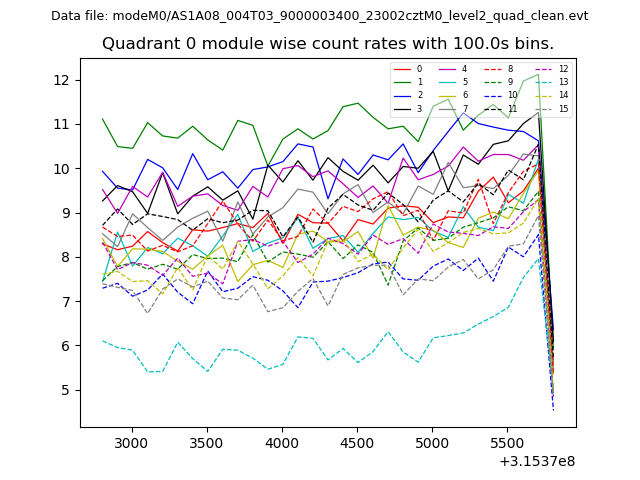 |
 |
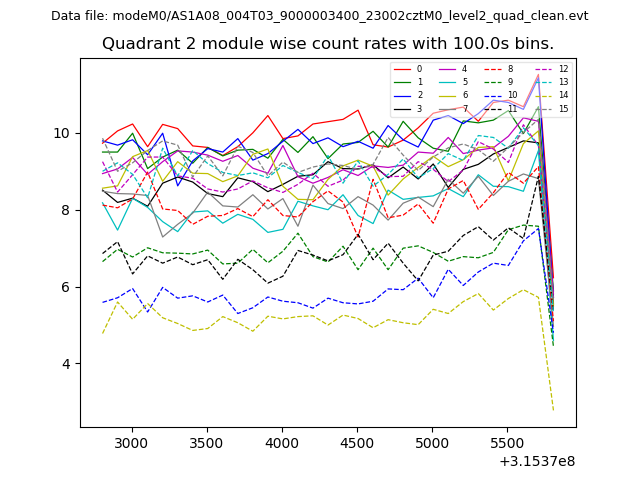
| Module-wise count rates for Quadrant B Data is divided into 100 sec bins |
 |
 |
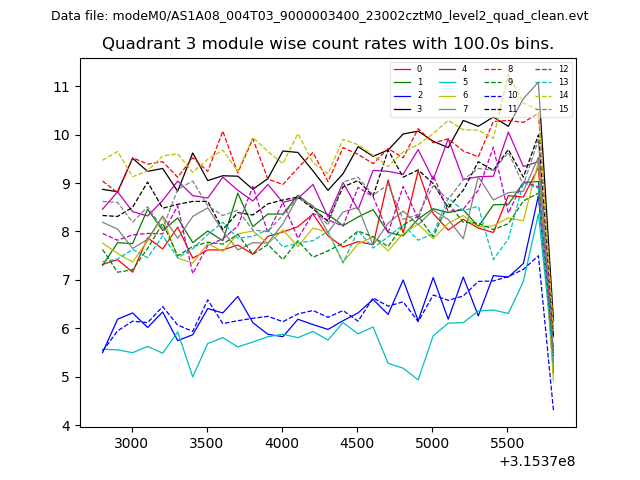
| Module-wise count rates for Quadrant C Data is divided into 100 sec bins |
 |
 |
| Module-wise count rates for Quadrant D Data is divided into 100 sec bins |
 |
 |
| Parameter | Plot |
|---|---|
| CZT HV Monitor | 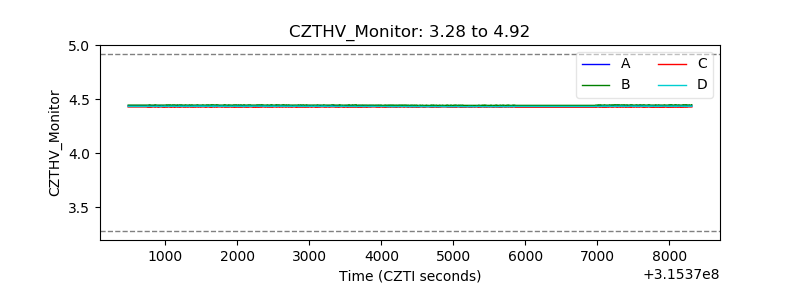 |
| D_VDD | 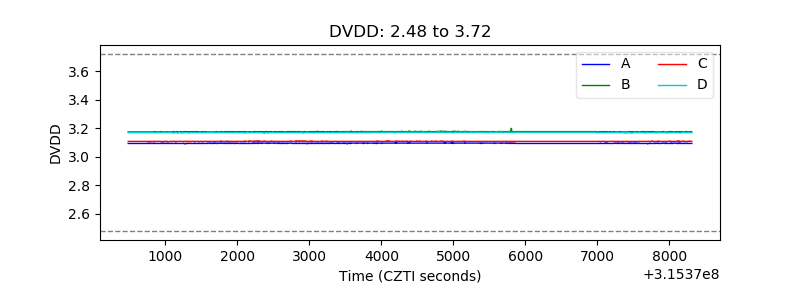 |
| Temperature 1 | 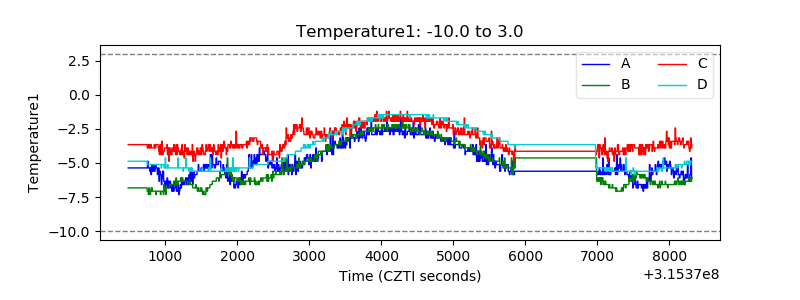 |
| Veto HV Monitor | 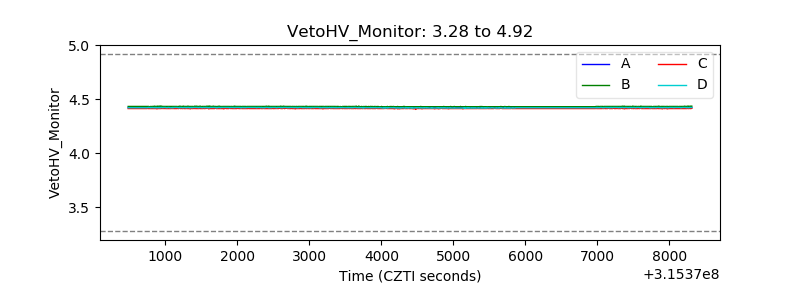 |
| Veto LLD | 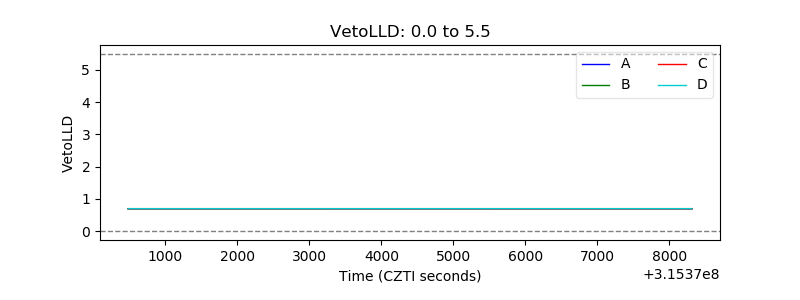 |
| Alpha Counter | 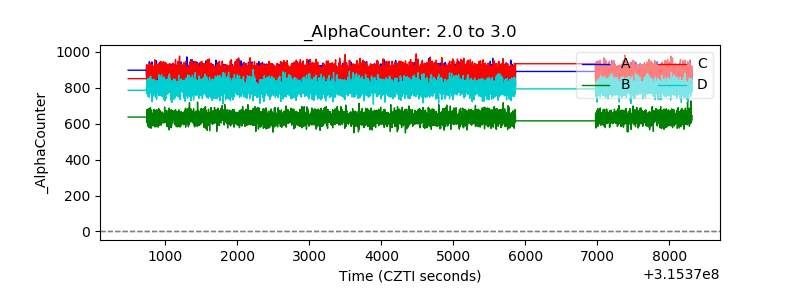 |
| _CPM_Rate | 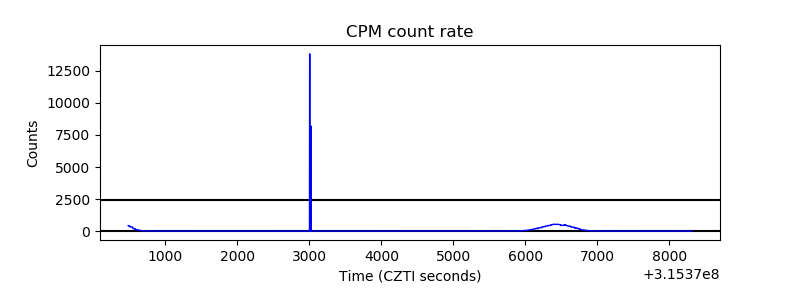 |
| CZT Counter | 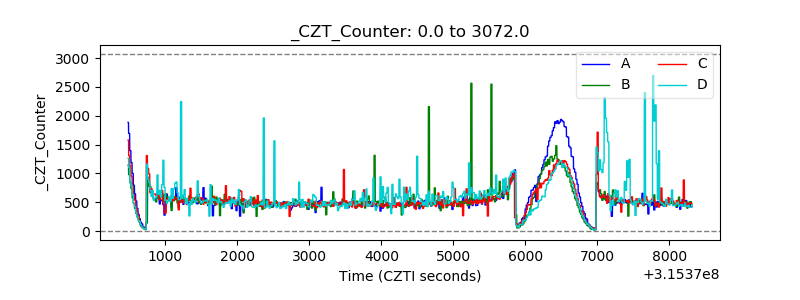 |
| +2.5 Volts monitor | 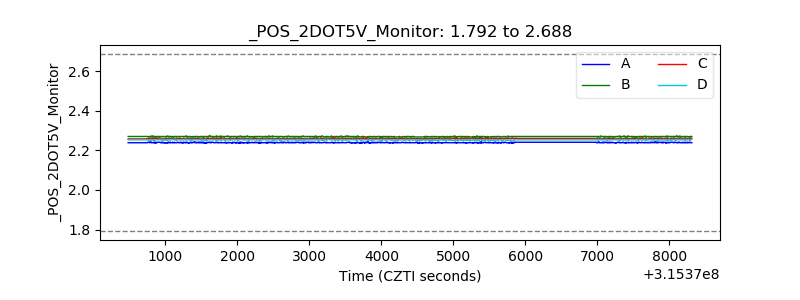 |
| +5 Volts monitor |  |
| _ROLL_ROT | 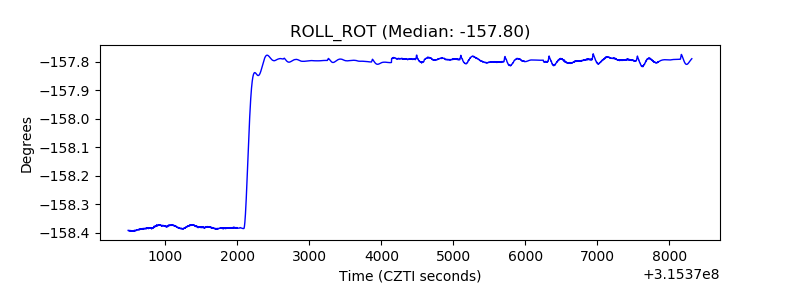 |
| _Roll_DEC | 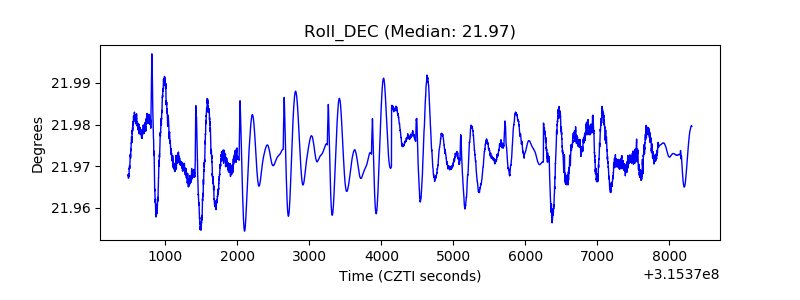 |
| _Roll_RA | 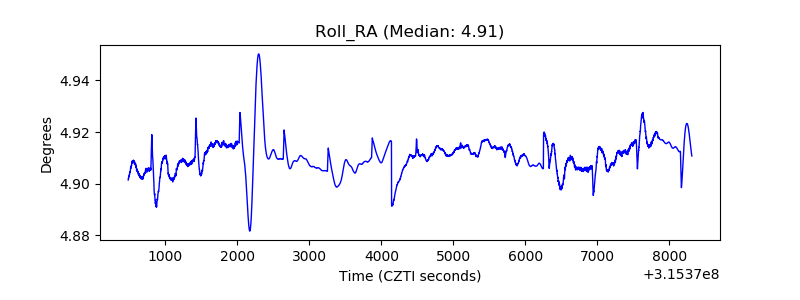 |
| Veto Counter | 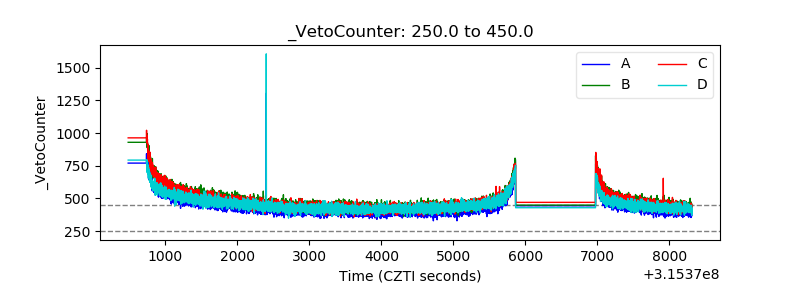 |