| Param | Original file | Final file |
|---|---|---|
| Filename | modeM0/AS1A08_004T03_9000003400_23003cztM0_level2.evt | modeM0/AS1A08_004T03_9000003400_23003cztM0_level2_quad_clean.evt |
| Size (bytes) | 518,109,120 | 81,014,400 |
| Size | 494.1 MB | 77.3 MB |
| Events in quadrant A | 3,394,441 | 502,513 |
| Events in quadrant B | 3,613,755 | 508,680 |
| Events in quadrant C | 3,773,099 | 485,220 |
| Events in quadrant D | 4,434,105 | 469,081 |
| Mode M0 | |||
|---|---|---|---|
| Quadrant | BADHDUFLAG | Total packets | Discarded packets |
| A | 0 | 14423 | 2 |
| B | 0 | 14917 | 2 |
| C | 0 | 15476 | 2 |
| D | 0 | 17644 | 2 |
| Mode SS | |||
|---|---|---|---|
| Quadrant | BADHDUFLAG | Total packets | Discarded packets |
| A | 0 | 142 | 0 |
| B | 0 | 142 | 0 |
| C | 0 | 142 | 0 |
| D | 0 | 142 | 0 |
| Mode M9 | |||
|---|---|---|---|
| Quadrant | BADHDUFLAG | Total packets | Discarded packets |
| A | 0 | 9 | 0 |
| B | 0 | 10 | 0 |
| C | 0 | 10 | 0 |
| D | 0 | 10 | 0 |
| Quadrant | Total seconds | Saturated seconds | Saturation percentage |
|---|---|---|---|
| A | 6996 | 113 | 1.615209% |
| B | 6996 | 197 | 2.815895% |
| C | 6996 | 314 | 4.488279% |
| D | 6996 | 237 | 3.387650% |
Noise dominated data is calculated using 1-second bins in cleaned event files. If a bin has >2000 counts, and if more than 50% of those come from <1% of pixels, then it is considered to be noise-dominated and hence unusable.
| Quadrant | # 1 sec bins | Bins with >0 counts | Bins with >2000 counts | High rate bins dominated by noise | Noise dominated (total time) | Noise dominated (detector-on time) | Marked lightcurve |
|---|---|---|---|---|---|---|---|
| A | 7686 | 6997 | 0 | 0 | 0.00% | 0.00% | 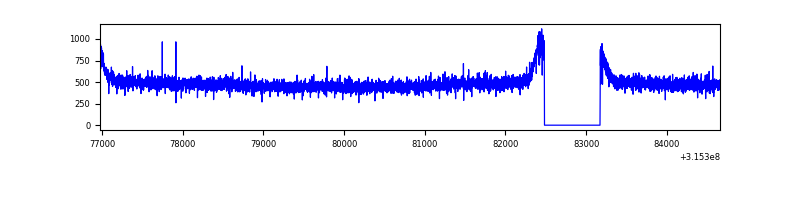 |
| B | 7686 | 6997 | 27 | 27 | 0.35% | 0.39% | 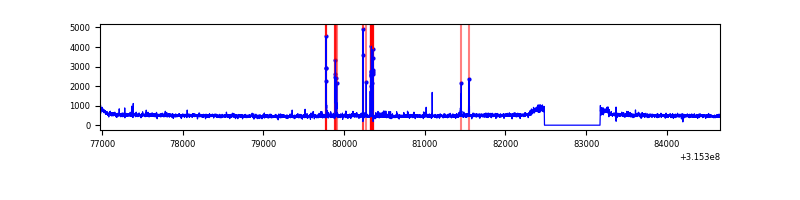 |
| C | 7686 | 6997 | 79 | 79 | 1.03% | 1.13% | 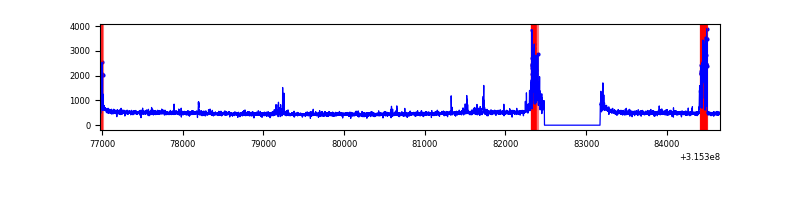 |
| D | 7686 | 6997 | 96 | 96 | 1.25% | 1.37% | 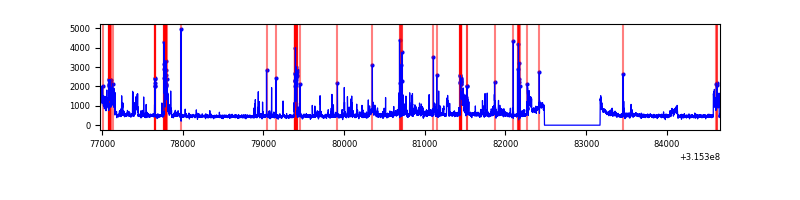 |
Top three noisy pixels from each quadrant. If the there are fewer than three noisy pixels in the level2.evt file, extra rows are filled as -1
| Pixel properties | Quadrant properties | ||||||
|---|---|---|---|---|---|---|---|
| Quadrant | DetID | PixID | Counts | Sigma | Mean | Median | Sigma |
| A | 13 | 254 | 10033 | 51.73 | 880 | 862 | 177.3 |
| A | 3 | 137 | 7817 | 39.23 | 880 | 862 | 177.3 |
| A | 0 | 226 | 7501 | 37.45 | 880 | 862 | 177.3 |
| B | 4 | 216 | 102481 | 600.06 | 878 | 855 | 169.4 |
| B | 0 | 189 | 47581 | 275.9 | 878 | 855 | 169.4 |
| B | 12 | 111 | 20516 | 116.09 | 878 | 855 | 169.4 |
| C | 10 | 223 | 306692 | 1571.67 | 833 | 839 | 194.6 |
| C | 14 | 238 | 131788 | 672.9 | 833 | 839 | 194.6 |
| C | 7 | 247 | 57107 | 289.14 | 833 | 839 | 194.6 |
| D | 12 | 227 | 334544 | 1606.57 | 850 | 826 | 207.7 |
| D | 13 | 153 | 300028 | 1440.4 | 850 | 826 | 207.7 |
| D | 1 | 52 | 278236 | 1335.49 | 850 | 826 | 207.7 |
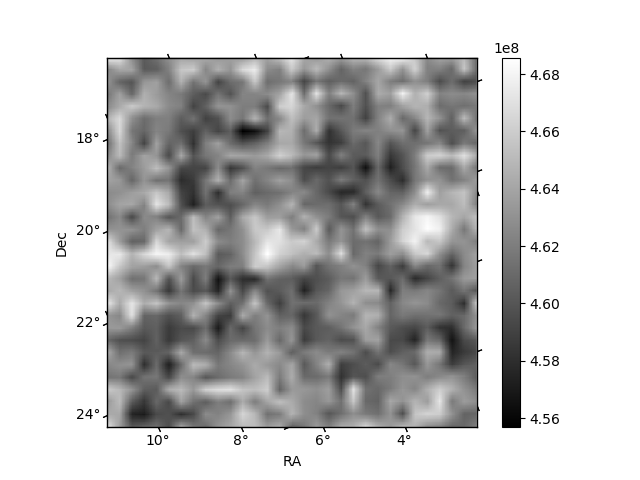
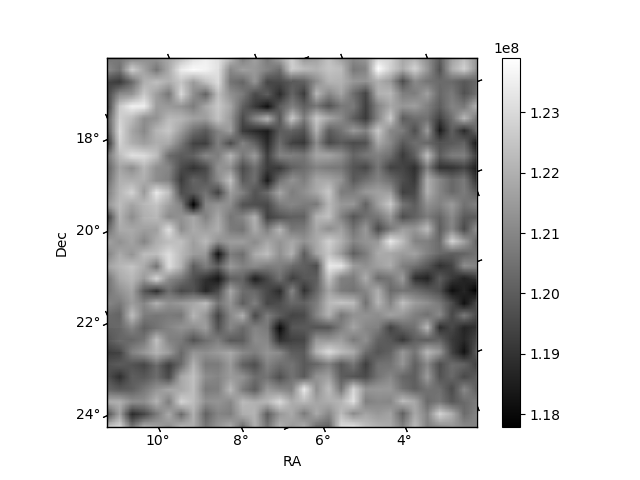
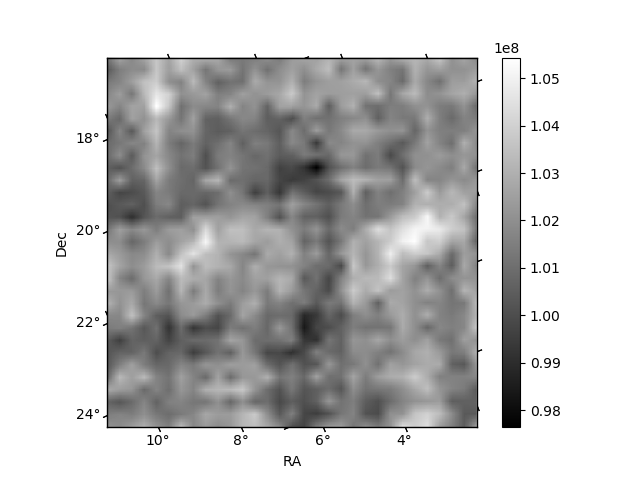
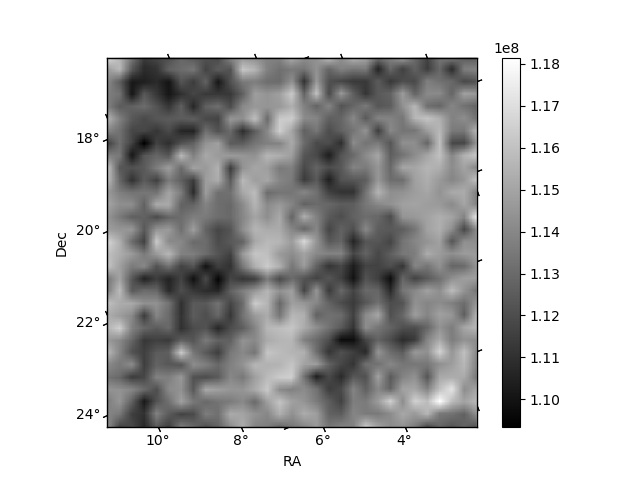
Histogram calculated using DETX and DETY for each event in the final _common_clean file
| Quadrant A | 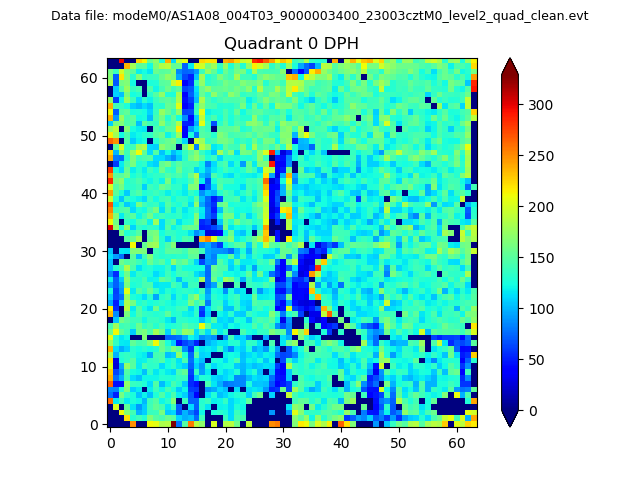 |
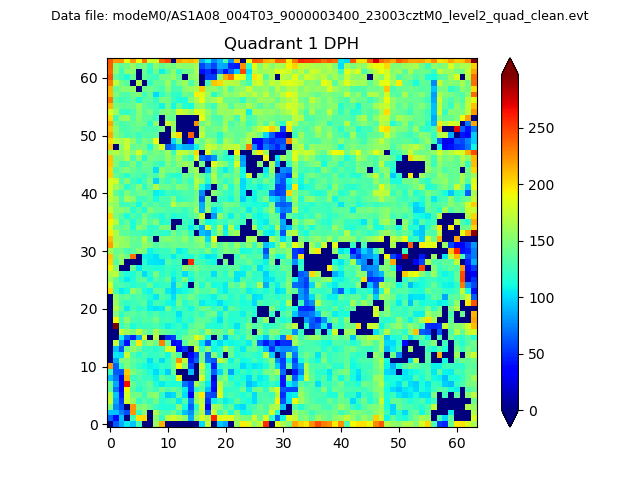 |
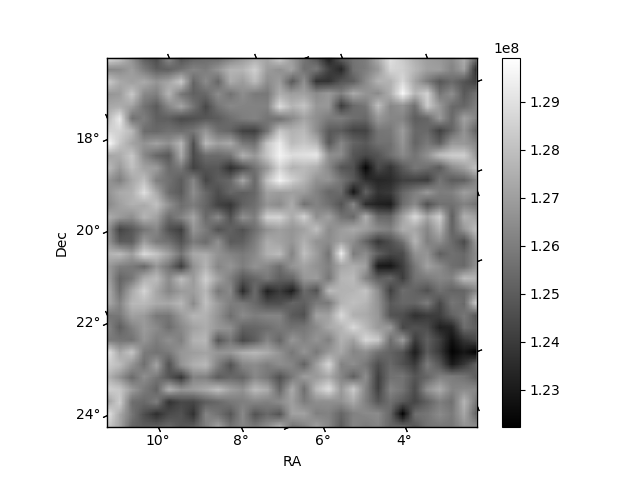
Quadrant B |
|---|---|---|---|
| Quadrant D | 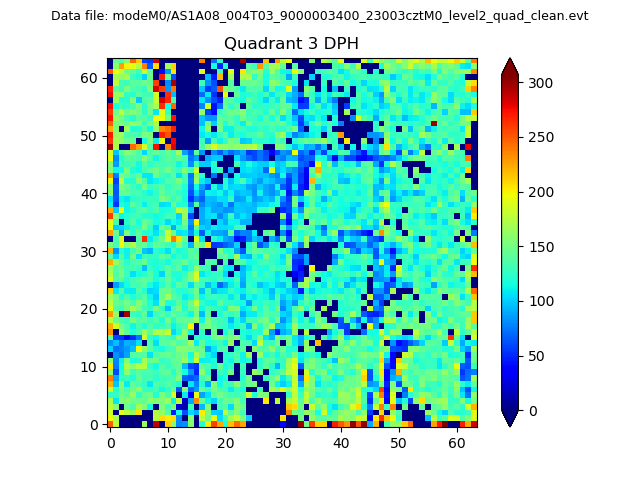 |
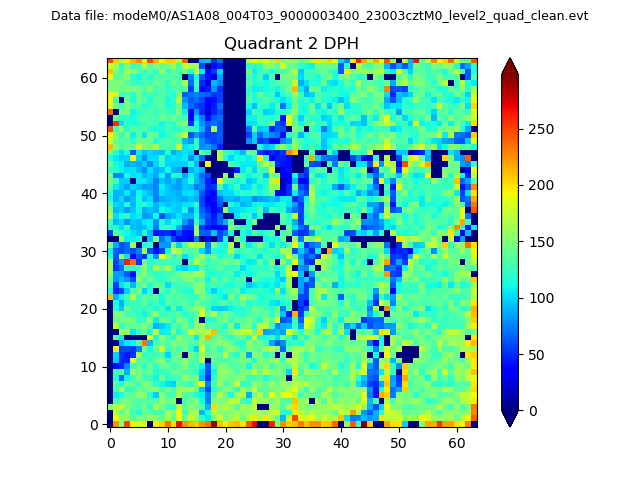 |
Quadrant C |
| Plot type | Count rate plots | Images |
|---|---|---|
| Comparison with Poisson distribution Blue bars denote a histogram of data divided into 1 sec bins. Red curve is a Poisson curve with rate = median count rate of data. |
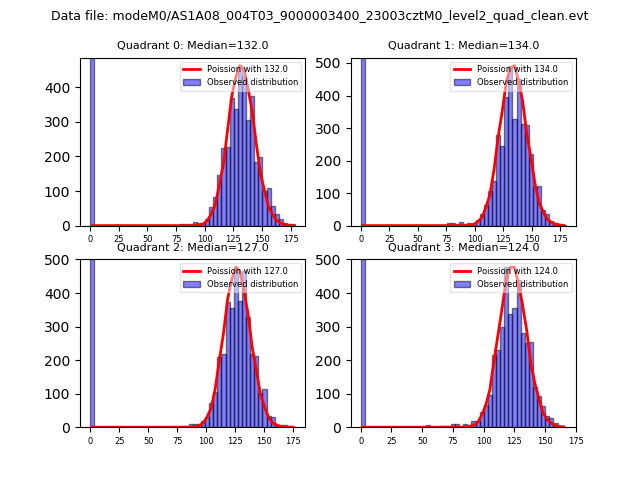 |
 |
| Quadrant-wise count rates Data is divided into 100 sec bins |
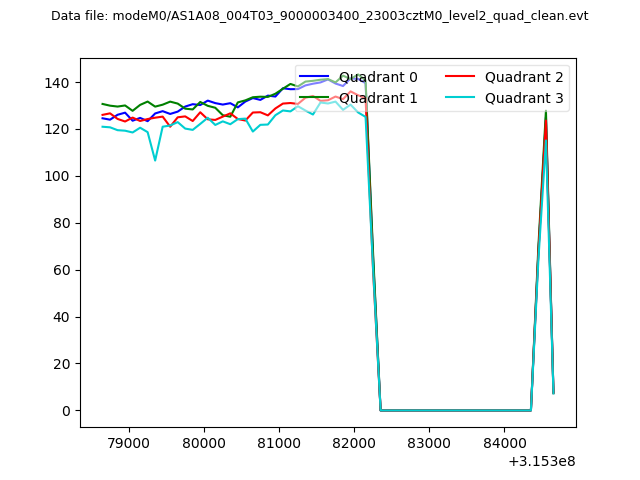 |
|
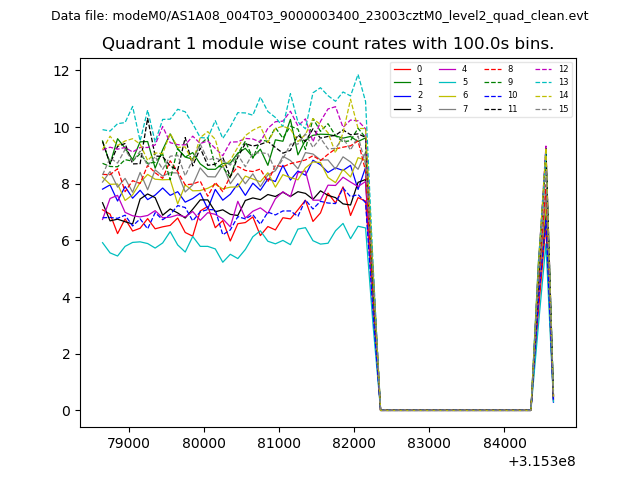
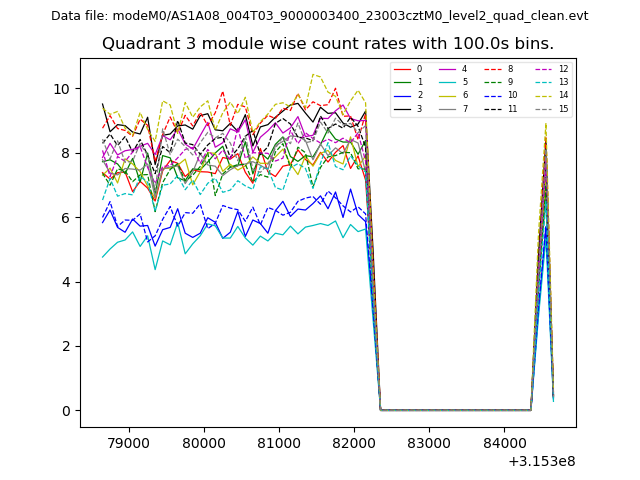
| Module-wise count rates for Quadrant A Data is divided into 100 sec bins |
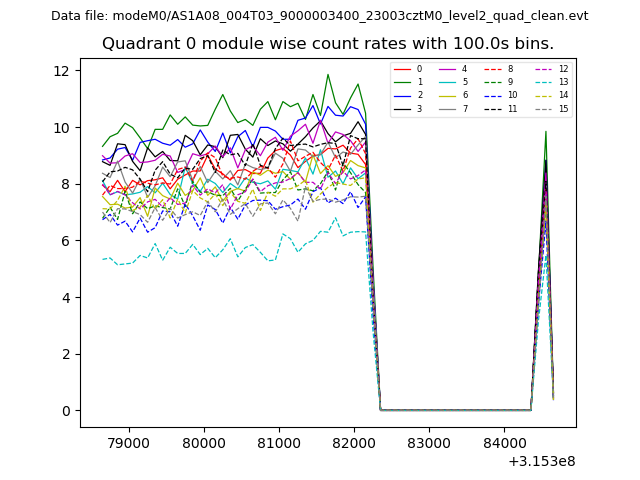 |
 |
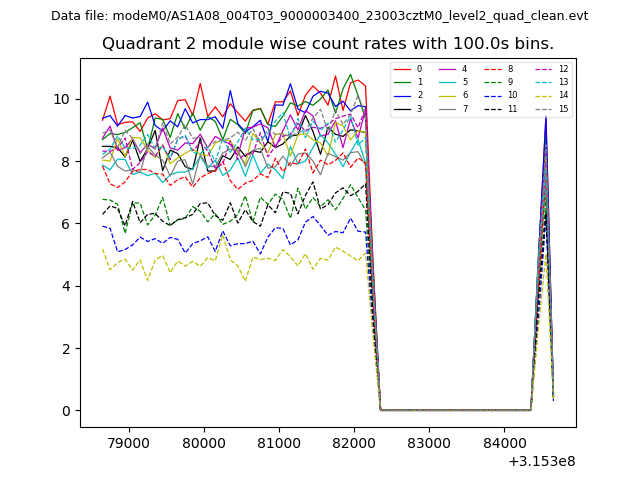
| Module-wise count rates for Quadrant B Data is divided into 100 sec bins |
 |
 |
| Module-wise count rates for Quadrant C Data is divided into 100 sec bins |
 |
 |
| Module-wise count rates for Quadrant D Data is divided into 100 sec bins |
 |
 |
| Parameter | Plot |
|---|---|
| CZT HV Monitor | 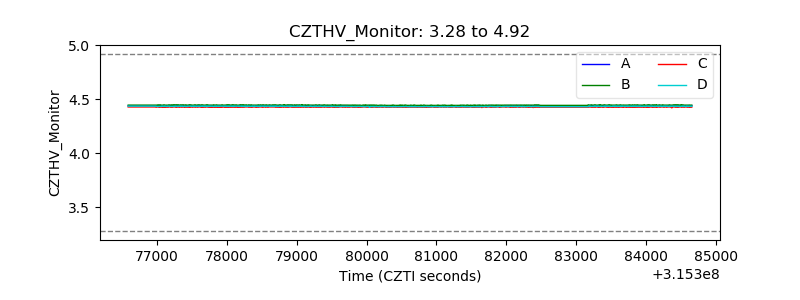 |
| D_VDD | 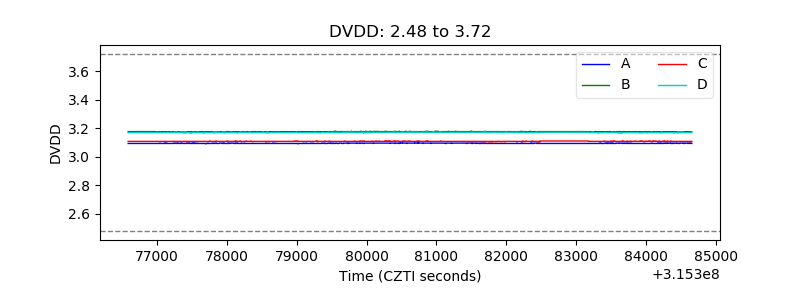 |
| Temperature 1 | 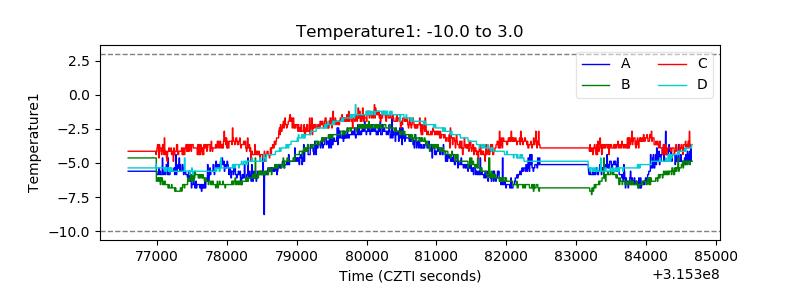 |
| Veto HV Monitor | 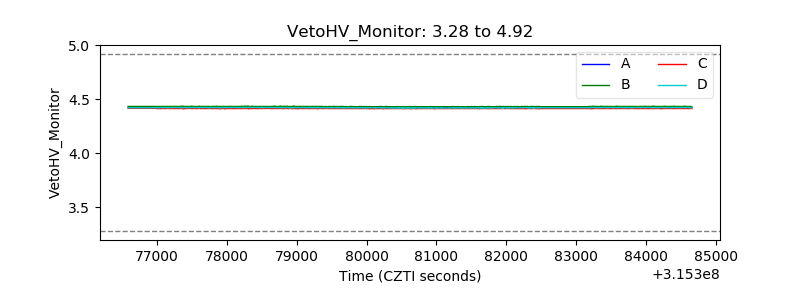 |
| Veto LLD | 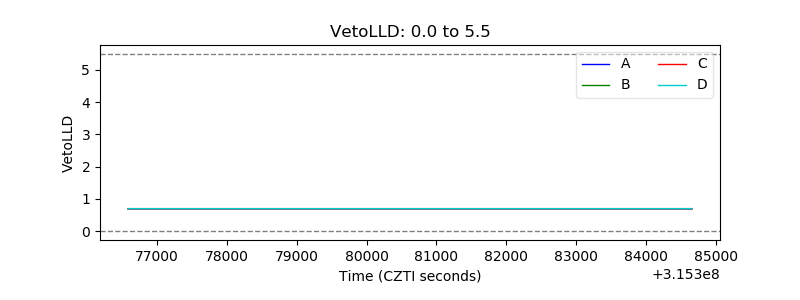 |
| Alpha Counter | 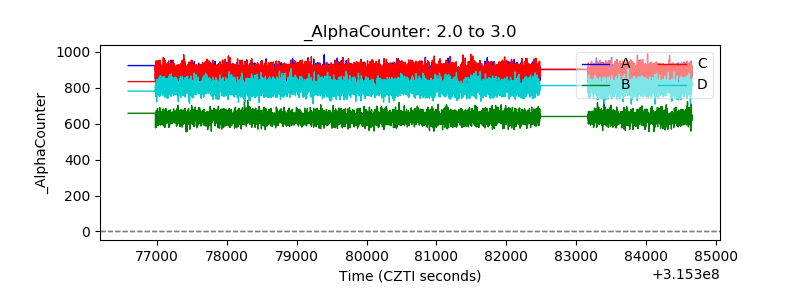 |
| _CPM_Rate | 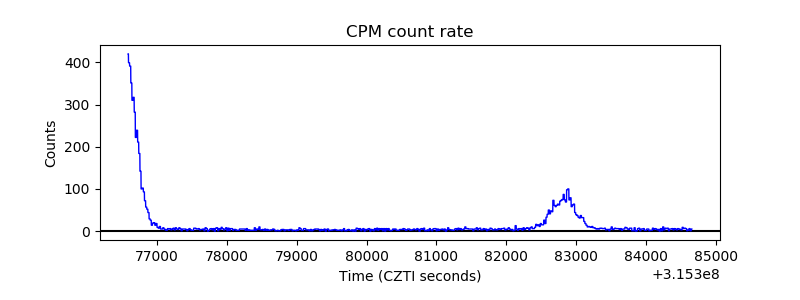 |
| CZT Counter | 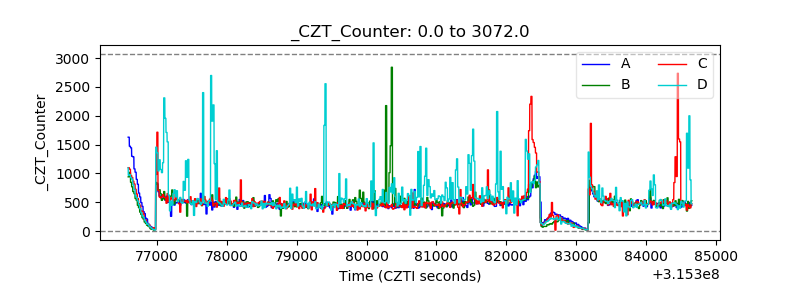 |
| +2.5 Volts monitor |  |
| +5 Volts monitor |  |
| _ROLL_ROT | 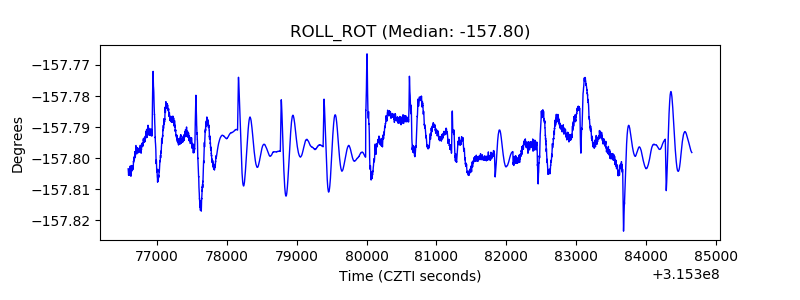 |
| _Roll_DEC | 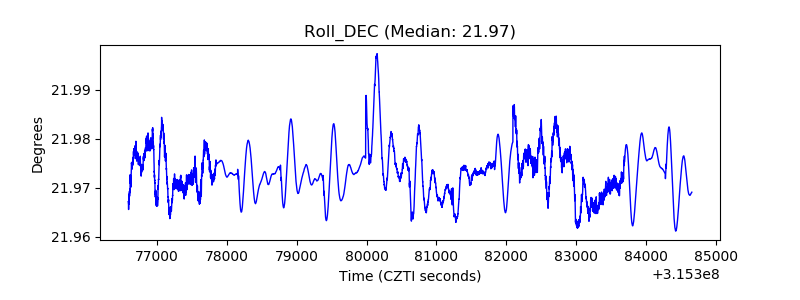 |
| _Roll_RA | 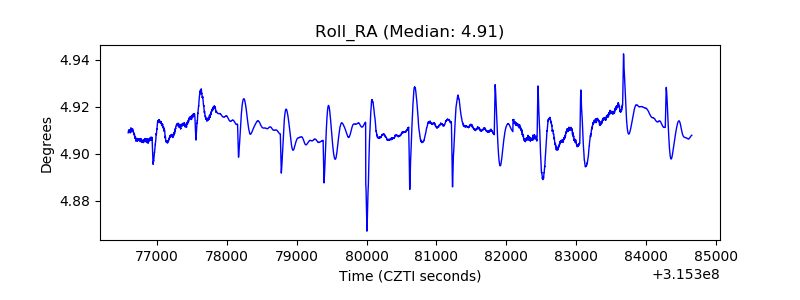 |
| Veto Counter | 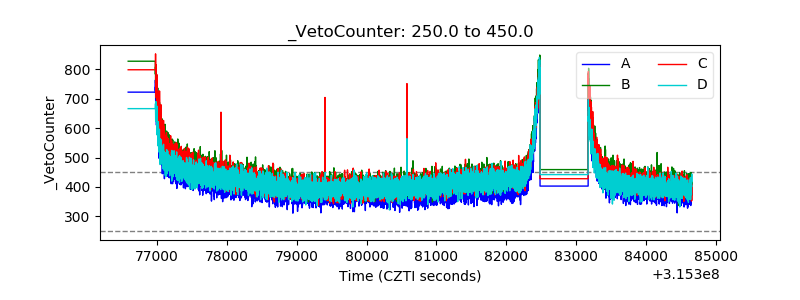 |