| Param | Original file | Final file |
|---|---|---|
| Filename | modeM0/AS1A08_004T03_9000003400_23004cztM0_level2.evt | modeM0/AS1A08_004T03_9000003400_23004cztM0_level2_quad_clean.evt |
| Size (bytes) | 534,738,240 | 87,482,880 |
| Size | 510.0 MB | 83.4 MB |
| Events in quadrant A | 3,561,888 | 541,704 |
| Events in quadrant B | 3,702,955 | 549,928 |
| Events in quadrant C | 3,862,322 | 526,117 |
| Events in quadrant D | 4,557,630 | 508,807 |
| Mode M0 | |||
|---|---|---|---|
| Quadrant | BADHDUFLAG | Total packets | Discarded packets |
| A | 0 | 15426 | 2 |
| B | 0 | 15637 | 3 |
| C | 0 | 16199 | 2 |
| D | 0 | 18307 | 2 |
| Mode SS | |||
|---|---|---|---|
| Quadrant | BADHDUFLAG | Total packets | Discarded packets |
| A | 0 | 154 | 0 |
| B | 0 | 154 | 0 |
| C | 0 | 154 | 0 |
| D | 0 | 154 | 0 |
| Mode M9 | |||
|---|---|---|---|
| Quadrant | BADHDUFLAG | Total packets | Discarded packets |
| A | 0 | 10 | 0 |
| B | 0 | 10 | 0 |
| C | 0 | 10 | 0 |
| D | 0 | 10 | 0 |
| Quadrant | Total seconds | Saturated seconds | Saturation percentage |
|---|---|---|---|
| A | 7502 | 117 | 1.559584% |
| B | 7501 | 182 | 2.426343% |
| C | 7501 | 262 | 3.492868% |
| D | 7502 | 271 | 3.612370% |
Noise dominated data is calculated using 1-second bins in cleaned event files. If a bin has >2000 counts, and if more than 50% of those come from <1% of pixels, then it is considered to be noise-dominated and hence unusable.
| Quadrant | # 1 sec bins | Bins with >0 counts | Bins with >2000 counts | High rate bins dominated by noise | Noise dominated (total time) | Noise dominated (detector-on time) | Marked lightcurve |
|---|---|---|---|---|---|---|---|
| A | 8512 | 7504 | 0 | 0 | 0.00% | 0.00% |  |
| B | 8511 | 7503 | 2 | 2 | 0.02% | 0.03% |  |
| C | 8511 | 7503 | 77 | 77 | 0.90% | 1.03% | 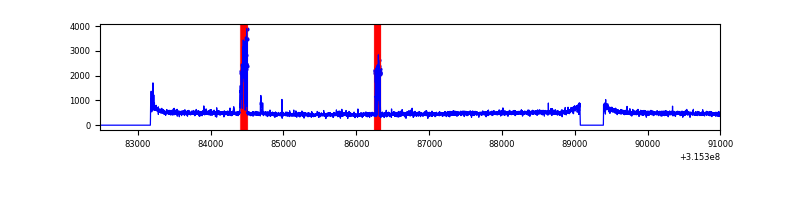 |
| D | 8512 | 7504 | 214 | 214 | 2.51% | 2.85% | 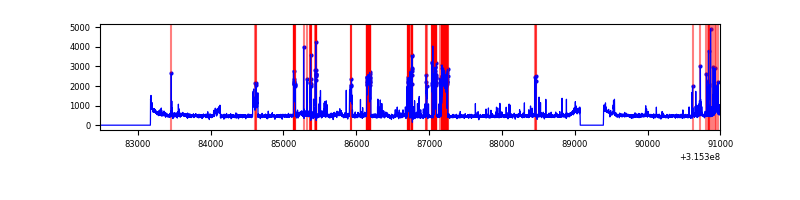 |
Top three noisy pixels from each quadrant. If the there are fewer than three noisy pixels in the level2.evt file, extra rows are filled as -1
| Pixel properties | Quadrant properties | ||||||
|---|---|---|---|---|---|---|---|
| Quadrant | DetID | PixID | Counts | Sigma | Mean | Median | Sigma |
| A | 13 | 254 | 11189 | 54.92 | 921 | 898 | 187.4 |
| A | 3 | 137 | 8326 | 39.64 | 921 | 898 | 187.4 |
| A | 0 | 226 | 7988 | 37.83 | 921 | 898 | 187.4 |
| B | 0 | 189 | 44300 | 243.06 | 919 | 894 | 178.6 |
| B | 0 | 190 | 24457 | 131.95 | 919 | 894 | 178.6 |
| B | 12 | 111 | 22080 | 118.64 | 919 | 894 | 178.6 |
| C | 10 | 223 | 249569 | 1202.69 | 881 | 884 | 206.8 |
| C | 14 | 238 | 140666 | 676.02 | 881 | 884 | 206.8 |
| C | 7 | 247 | 20424 | 94.5 | 881 | 884 | 206.8 |
| D | 12 | 227 | 377436 | 1717.19 | 893 | 868 | 219.3 |
| D | 1 | 239 | 343473 | 1562.31 | 893 | 868 | 219.3 |
| D | 1 | 52 | 217434 | 987.56 | 893 | 868 | 219.3 |
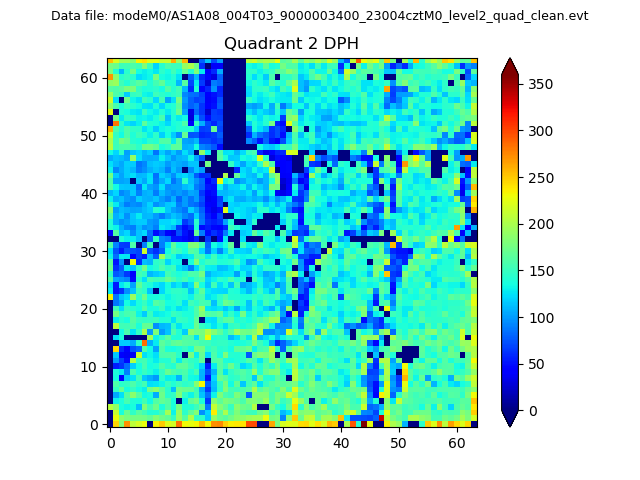
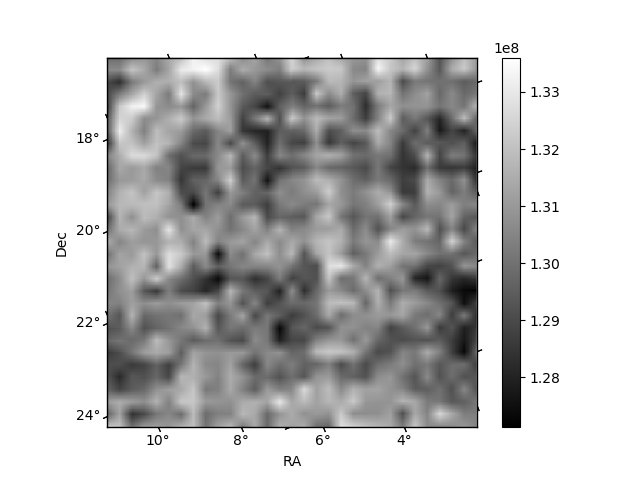
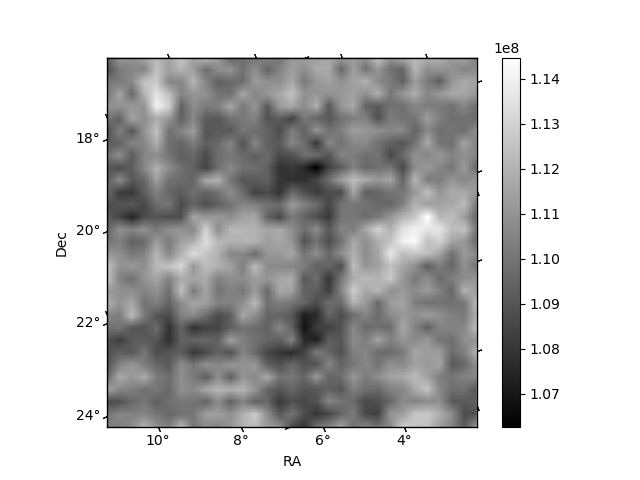
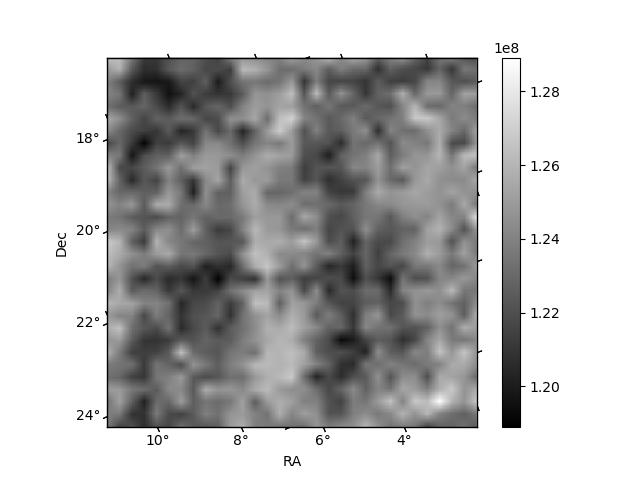
Histogram calculated using DETX and DETY for each event in the final _common_clean file
| Quadrant A | 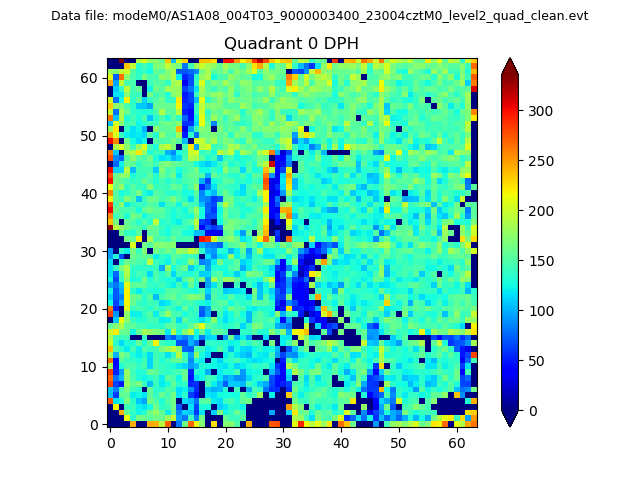 |
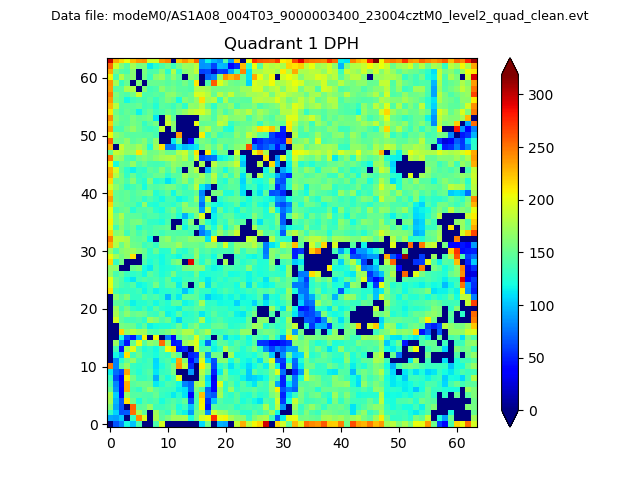 |
Quadrant B |
|---|---|---|---|
| Quadrant D | 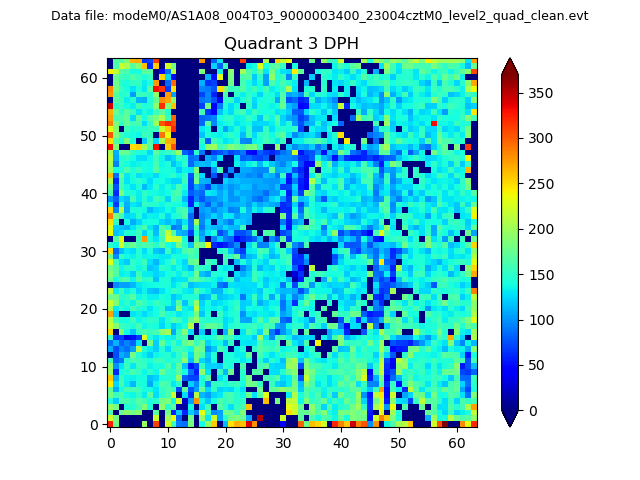 |
 |
Quadrant C |
| Plot type | Count rate plots | Images |
|---|---|---|
| Comparison with Poisson distribution Blue bars denote a histogram of data divided into 1 sec bins. Red curve is a Poisson curve with rate = median count rate of data. |
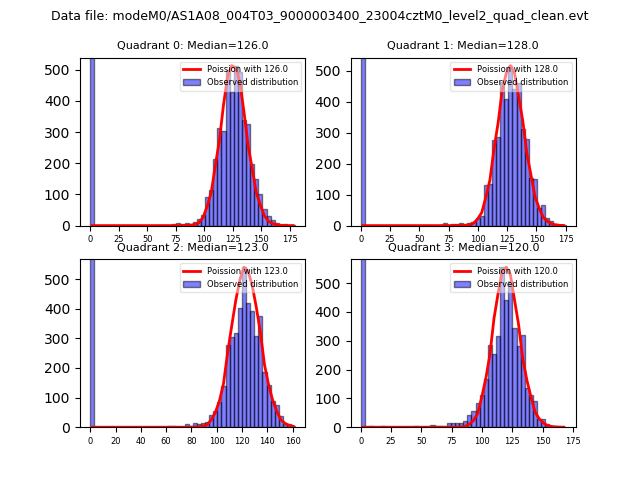 |
 |
| Quadrant-wise count rates Data is divided into 100 sec bins |
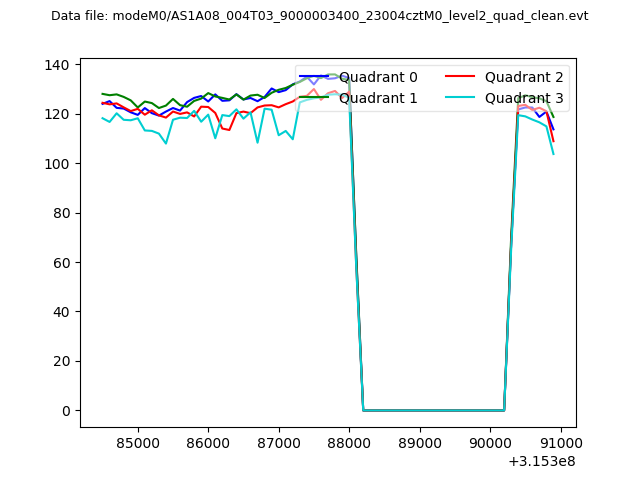 |
|
| Module-wise count rates for Quadrant A Data is divided into 100 sec bins |
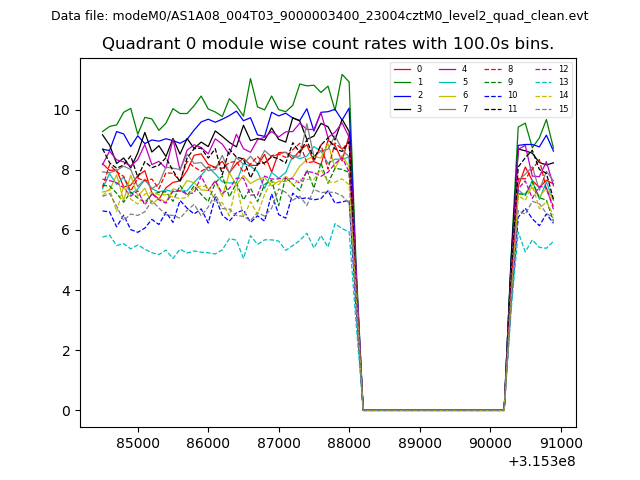 |
 |
| Module-wise count rates for Quadrant B Data is divided into 100 sec bins |
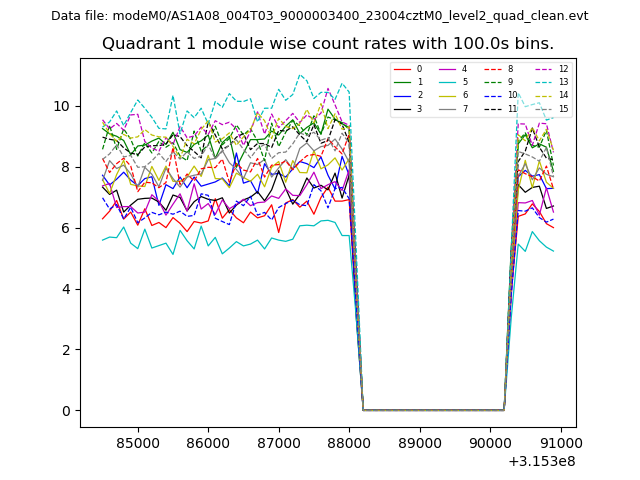 |
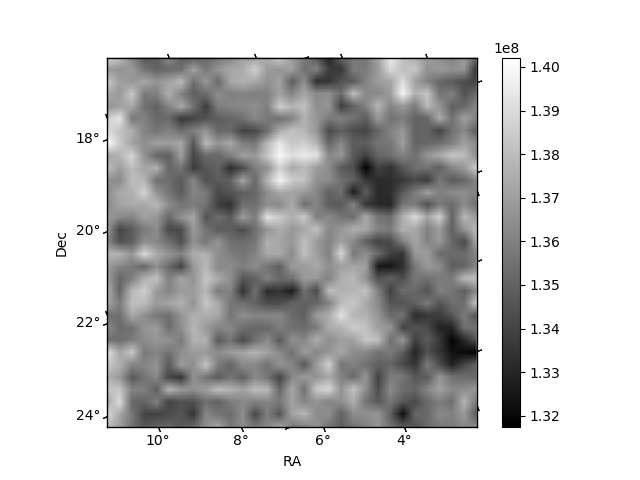 |
| Module-wise count rates for Quadrant C Data is divided into 100 sec bins |
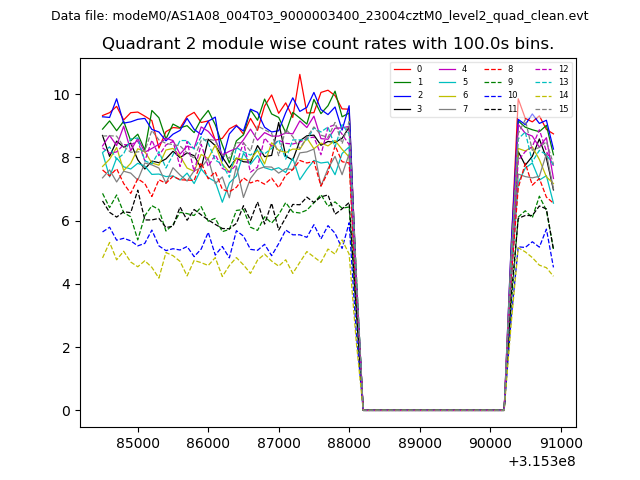 |
 |
| Module-wise count rates for Quadrant D Data is divided into 100 sec bins |
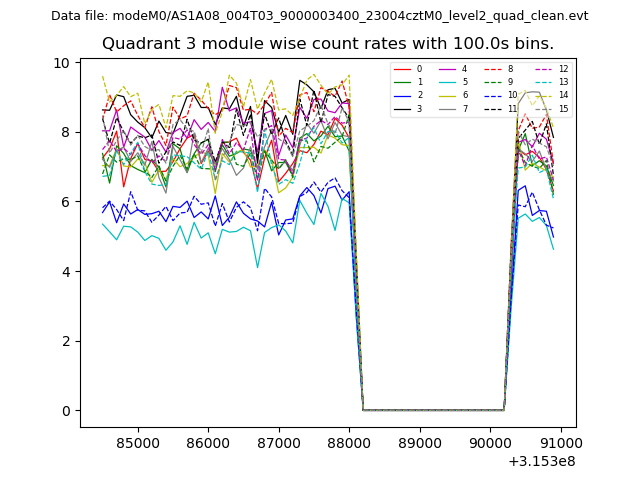 |
 |
| Parameter | Plot |
|---|---|
| CZT HV Monitor | 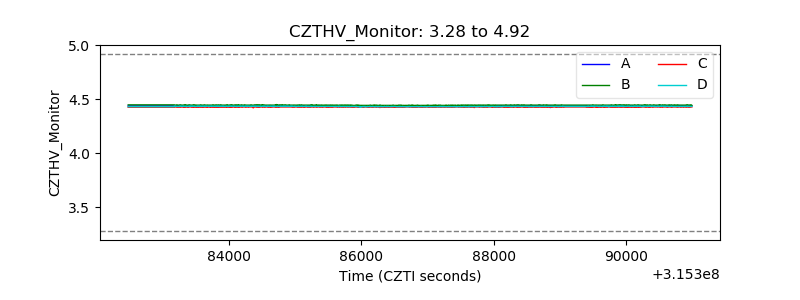 |
| D_VDD | 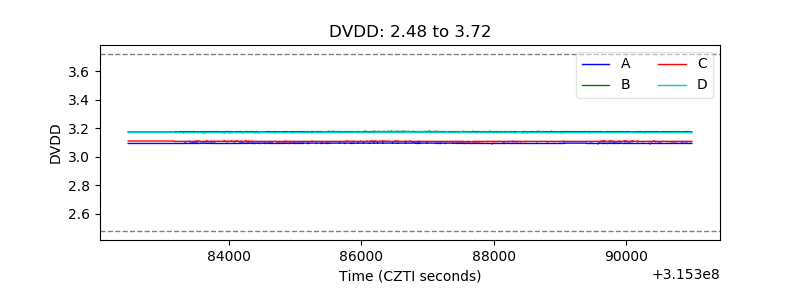 |
| Temperature 1 | 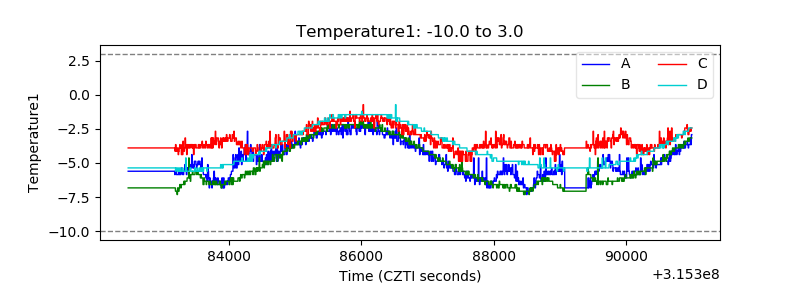 |
| Veto HV Monitor | 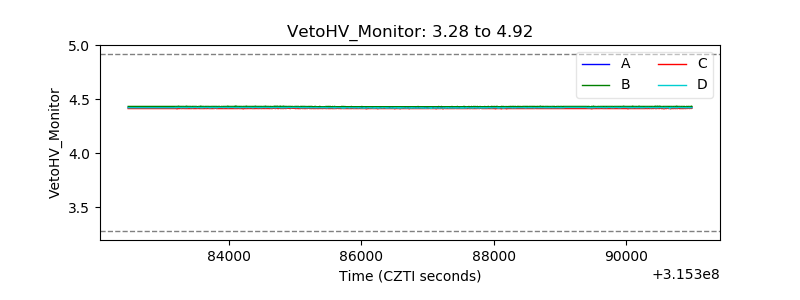 |
| Veto LLD | 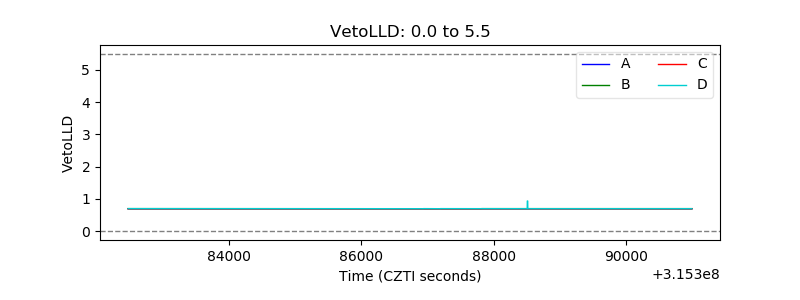 |
| Alpha Counter | 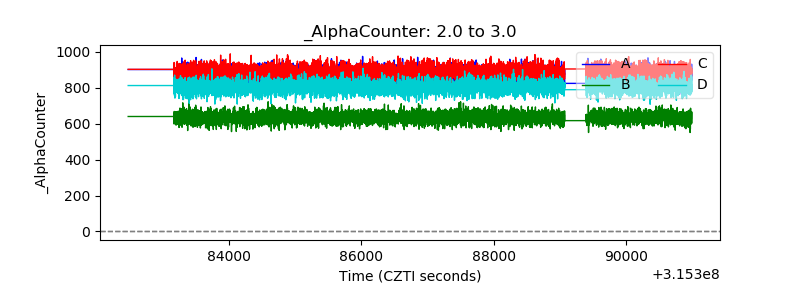 |
| _CPM_Rate | 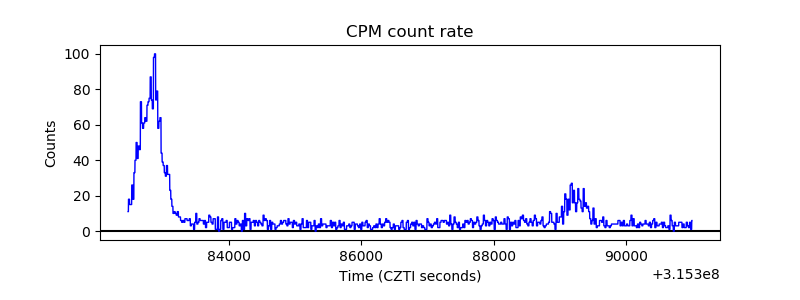 |
| CZT Counter | 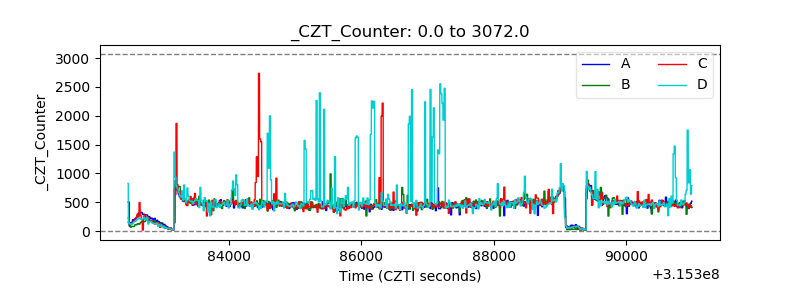 |
| +2.5 Volts monitor | 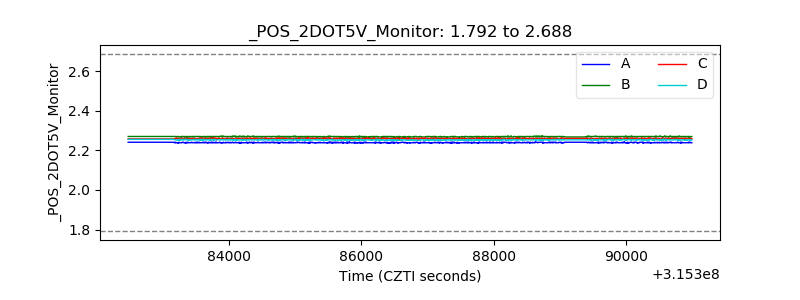 |
| +5 Volts monitor |  |
| _ROLL_ROT | 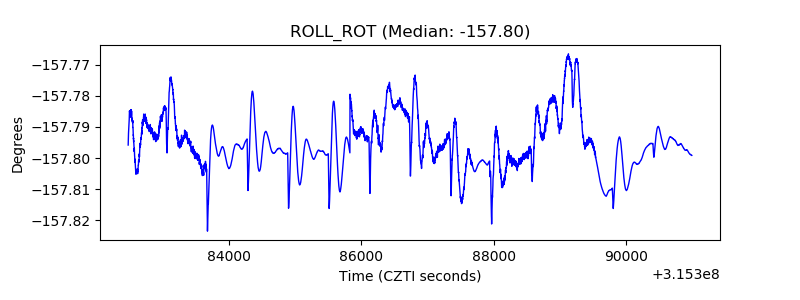 |
| _Roll_DEC | 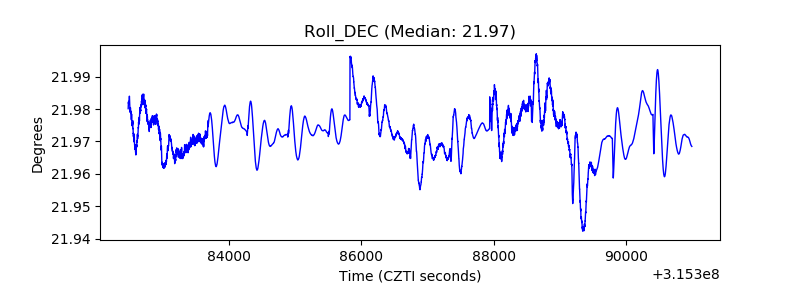 |
| _Roll_RA | 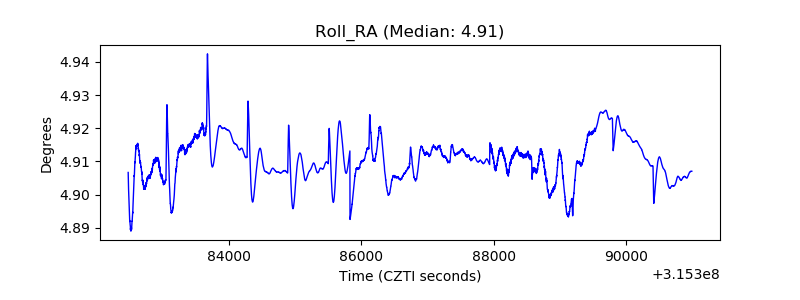 |
| Veto Counter | 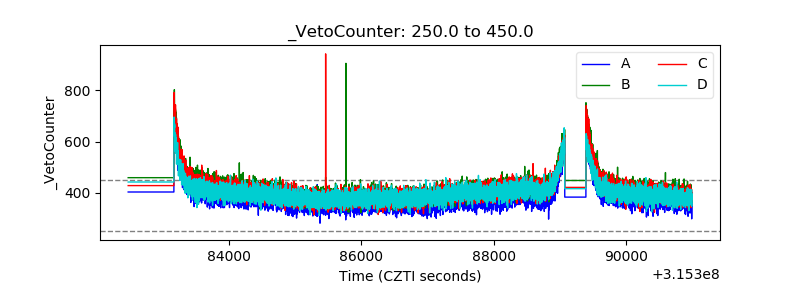 |