| Param | Original file | Final file |
|---|---|---|
| Filename | modeM0/AS1A08_004T03_9000003400_23005cztM0_level2.evt | modeM0/AS1A08_004T03_9000003400_23005cztM0_level2_quad_clean.evt |
| Size (bytes) | 486,578,880 | 92,404,800 |
| Size | 464.0 MB | 88.1 MB |
| Events in quadrant A | 3,259,364 | 588,898 |
| Events in quadrant B | 3,342,325 | 599,815 |
| Events in quadrant C | 3,390,981 | 572,589 |
| Events in quadrant D | 4,272,604 | 554,287 |
| Mode M0 | |||
|---|---|---|---|
| Quadrant | BADHDUFLAG | Total packets | Discarded packets |
| A | 0 | 14221 | 1 |
| B | 0 | 14360 | 1 |
| C | 0 | 14523 | 1 |
| D | 0 | 17046 | 1 |
| Mode SS | |||
|---|---|---|---|
| Quadrant | BADHDUFLAG | Total packets | Discarded packets |
| A | 0 | 142 | 0 |
| B | 0 | 142 | 0 |
| C | 0 | 142 | 0 |
| D | 0 | 142 | 0 |
| Mode M9 | |||
|---|---|---|---|
| Quadrant | BADHDUFLAG | Total packets | Discarded packets |
| A | 0 | 1 | 0 |
| B | 0 | 1 | 0 |
| C | 0 | 1 | 0 |
| D | 0 | 1 | 0 |
| Quadrant | Total seconds | Saturated seconds | Saturation percentage |
|---|---|---|---|
| A | 6925 | 123 | 1.776173% |
| B | 6924 | 165 | 2.383016% |
| C | 6925 | 128 | 1.848375% |
| D | 6925 | 222 | 3.205776% |
Noise dominated data is calculated using 1-second bins in cleaned event files. If a bin has >2000 counts, and if more than 50% of those come from <1% of pixels, then it is considered to be noise-dominated and hence unusable.
| Quadrant | # 1 sec bins | Bins with >0 counts | Bins with >2000 counts | High rate bins dominated by noise | Noise dominated (total time) | Noise dominated (detector-on time) | Marked lightcurve |
|---|---|---|---|---|---|---|---|
| A | 7100 | 6926 | 0 | 0 | 0.00% | 0.00% |  |
| B | 7099 | 6925 | 1 | 1 | 0.01% | 0.01% |  |
| C | 7100 | 6926 | 6 | 6 | 0.08% | 0.09% |  |
| D | 7100 | 6926 | 131 | 131 | 1.85% | 1.89% | 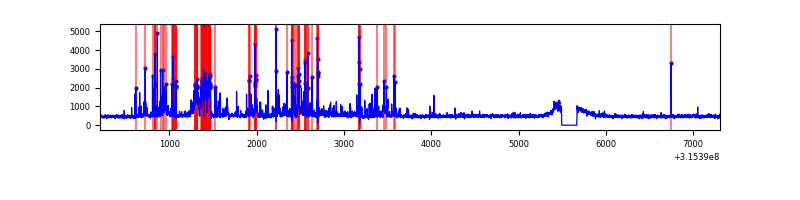 |
Top three noisy pixels from each quadrant. If the there are fewer than three noisy pixels in the level2.evt file, extra rows are filled as -1
| Pixel properties | Quadrant properties | ||||||
|---|---|---|---|---|---|---|---|
| Quadrant | DetID | PixID | Counts | Sigma | Mean | Median | Sigma |
| A | 13 | 254 | 10323 | 55.58 | 845 | 825 | 170.9 |
| A | 3 | 137 | 7782 | 40.71 | 845 | 825 | 170.9 |
| A | 0 | 226 | 7073 | 36.56 | 845 | 825 | 170.9 |
| B | 12 | 111 | 20282 | 118.94 | 839 | 818 | 163.7 |
| B | 0 | 189 | 18894 | 110.45 | 839 | 818 | 163.7 |
| B | 11 | 111 | 18298 | 106.81 | 839 | 818 | 163.7 |
| C | 14 | 238 | 126912 | 667.6 | 805 | 810 | 188.9 |
| C | 7 | 247 | 81628 | 427.86 | 805 | 810 | 188.9 |
| C | 10 | 223 | 17776 | 89.82 | 805 | 810 | 188.9 |
| D | 1 | 52 | 626528 | 3136.96 | 816 | 791 | 199.5 |
| D | 12 | 227 | 306481 | 1532.49 | 816 | 791 | 199.5 |
| D | 13 | 153 | 92300 | 458.76 | 816 | 791 | 199.5 |
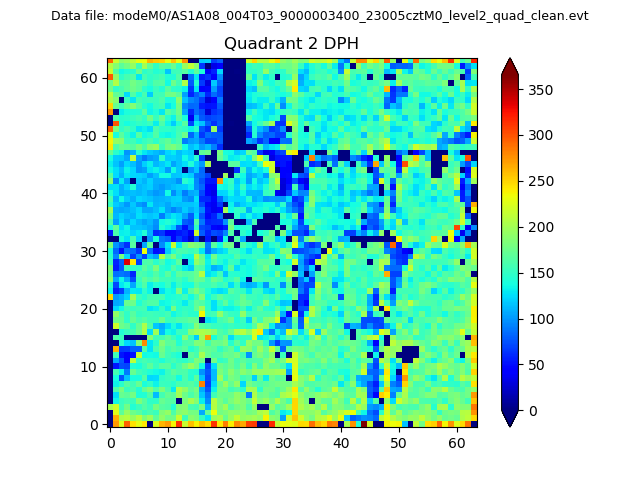
Histogram calculated using DETX and DETY for each event in the final _common_clean file
| Quadrant A | 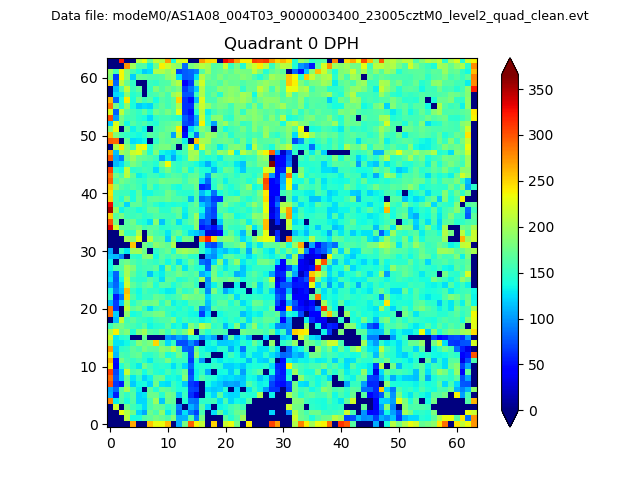 |
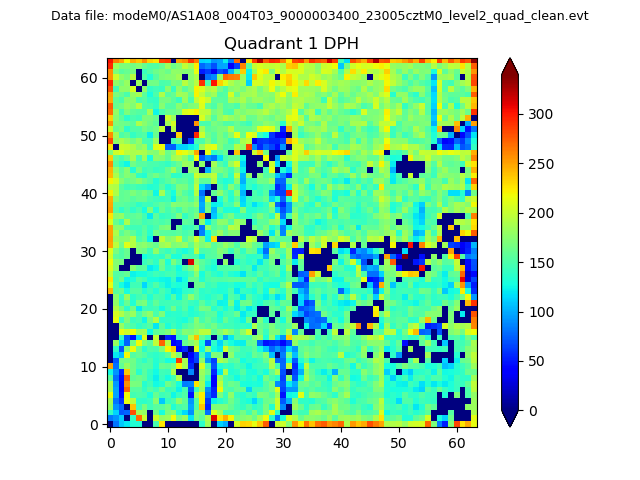 |
Quadrant B |
|---|---|---|---|
| Quadrant D | 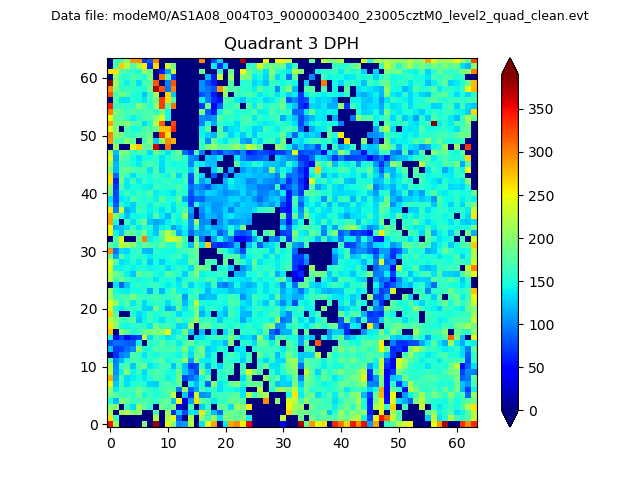 |
 |
Quadrant C |
| Plot type | Count rate plots | Images |
|---|---|---|
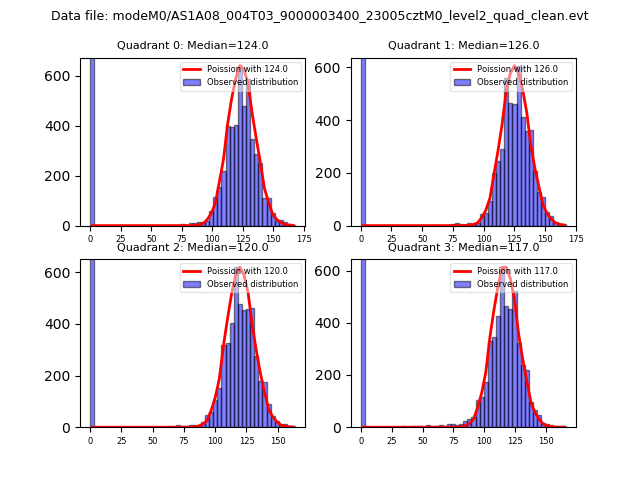
| Comparison with Poisson distribution Blue bars denote a histogram of data divided into 1 sec bins. Red curve is a Poisson curve with rate = median count rate of data. |
 |
 |
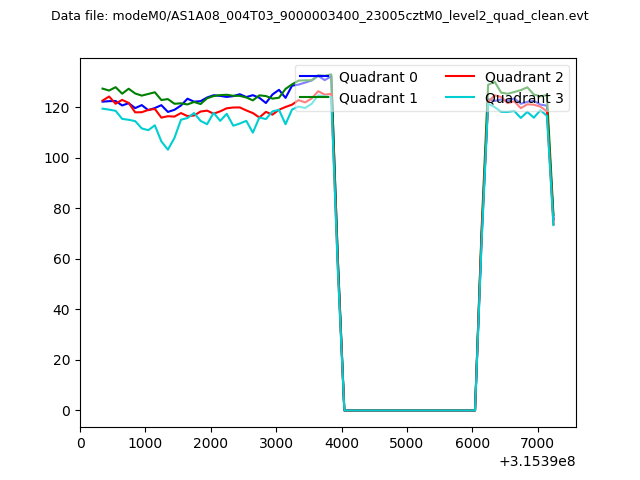
| Quadrant-wise count rates Data is divided into 100 sec bins |
 |
|
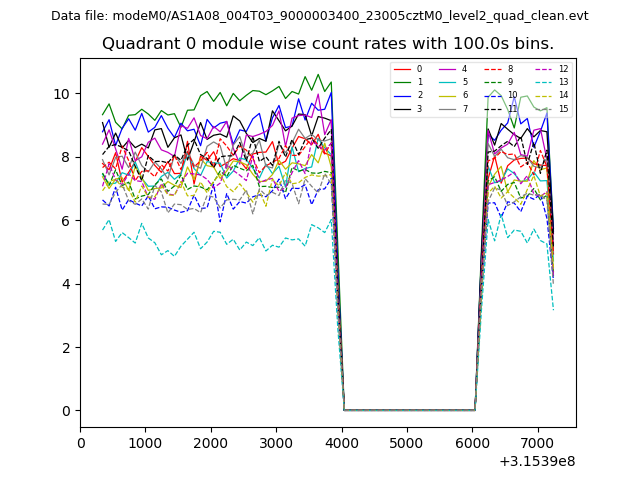
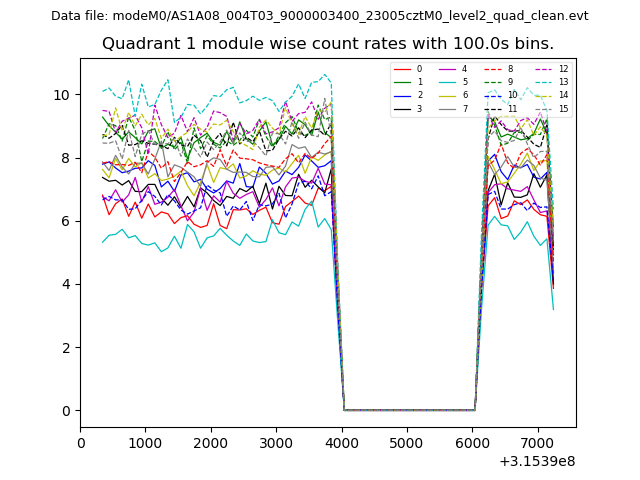
| Module-wise count rates for Quadrant A Data is divided into 100 sec bins |
 |
 |
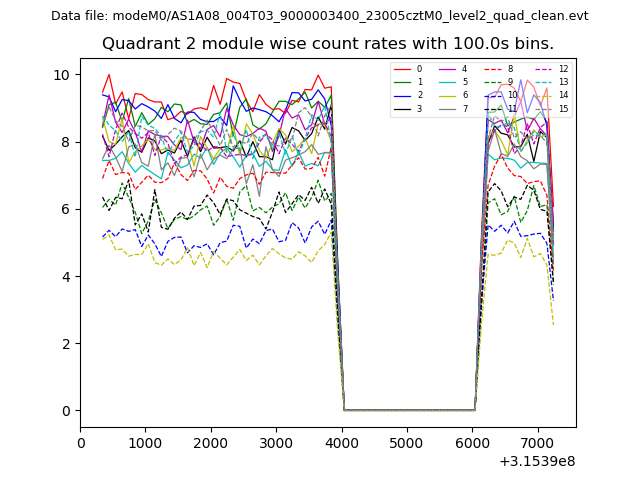
| Module-wise count rates for Quadrant B Data is divided into 100 sec bins |
 |
 |
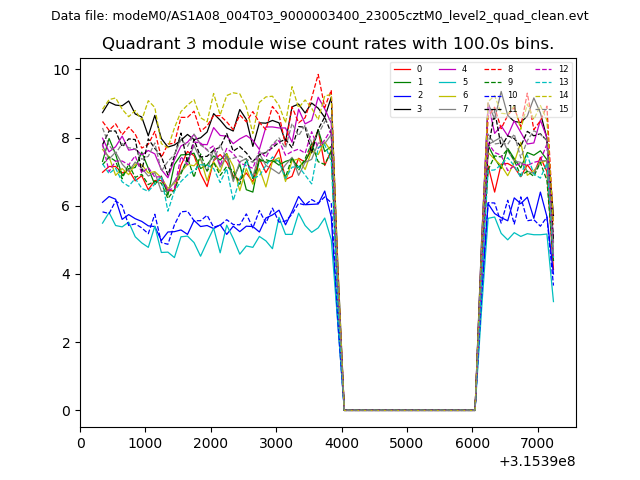
| Module-wise count rates for Quadrant C Data is divided into 100 sec bins |
 |
 |
| Module-wise count rates for Quadrant D Data is divided into 100 sec bins |
 |
 |
| Parameter | Plot |
|---|---|
| CZT HV Monitor | 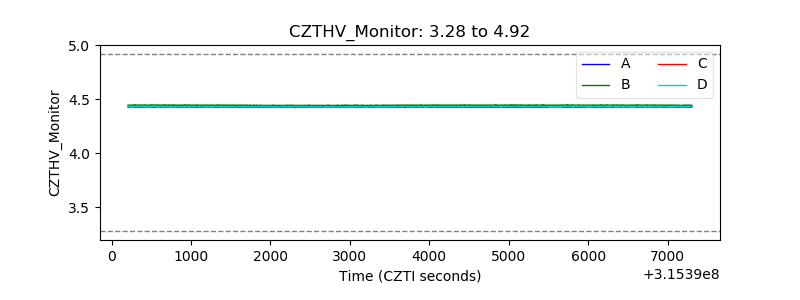 |
| D_VDD | 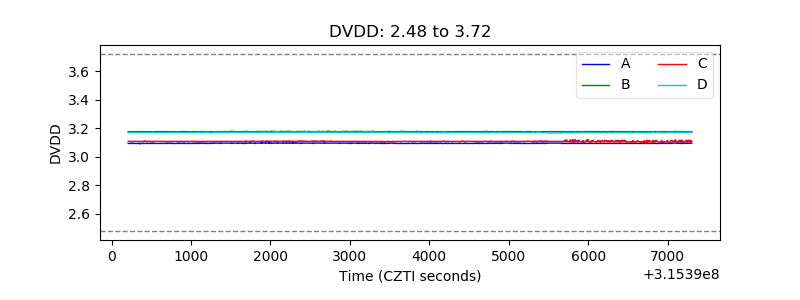 |
| Temperature 1 | 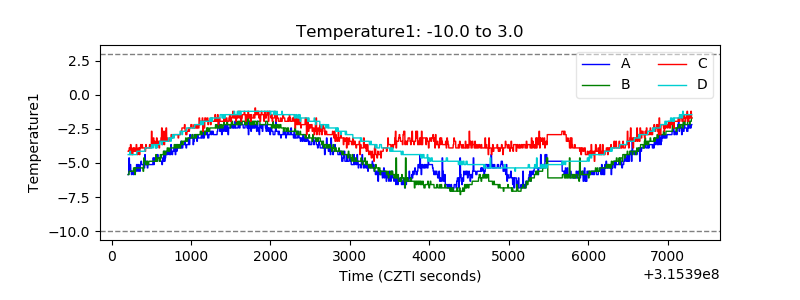 |
| Veto HV Monitor | 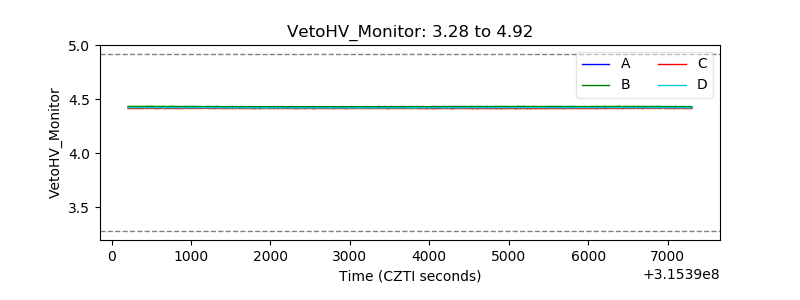 |
| Veto LLD | 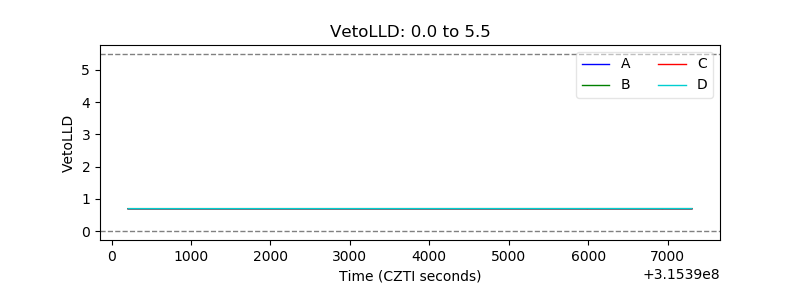 |
| Alpha Counter | 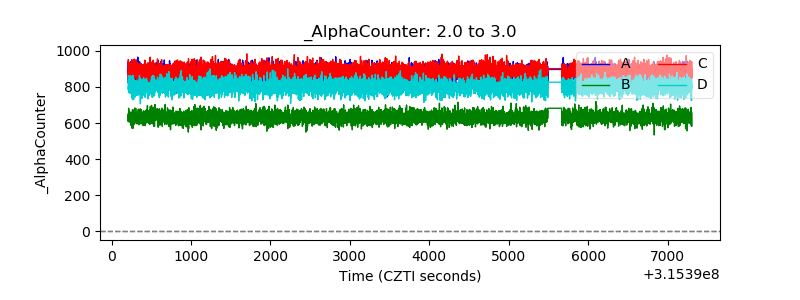 |
| _CPM_Rate | 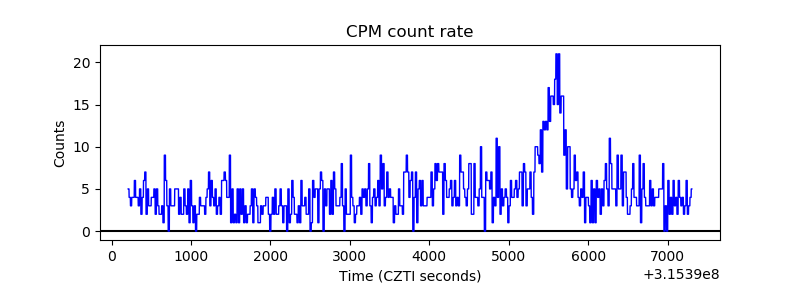 |
| CZT Counter | 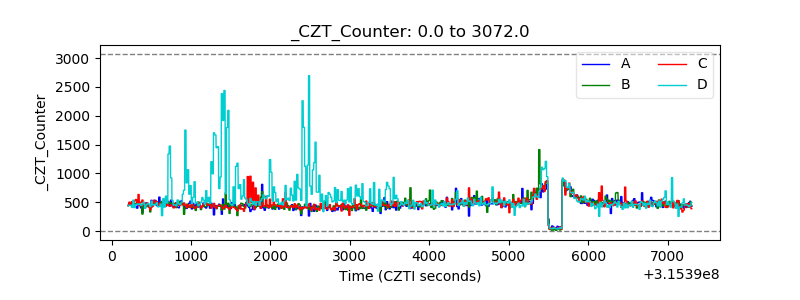 |
| +2.5 Volts monitor |  |
| +5 Volts monitor |  |
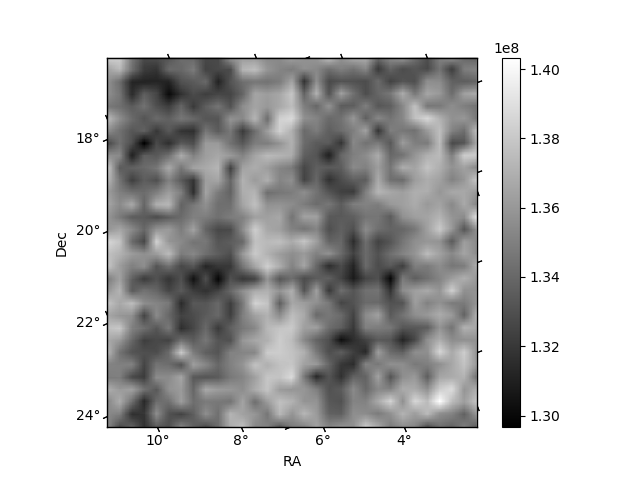
| _ROLL_ROT | 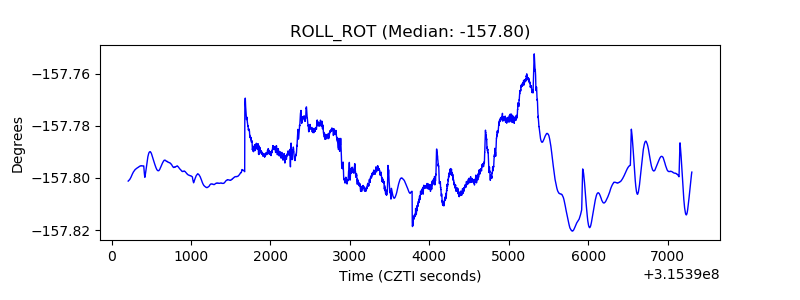 |
| _Roll_DEC | 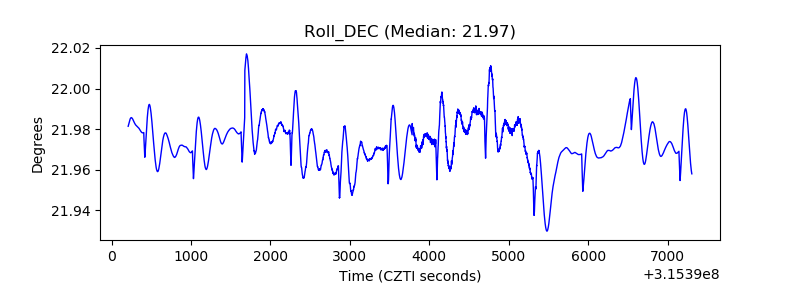 |
| _Roll_RA | 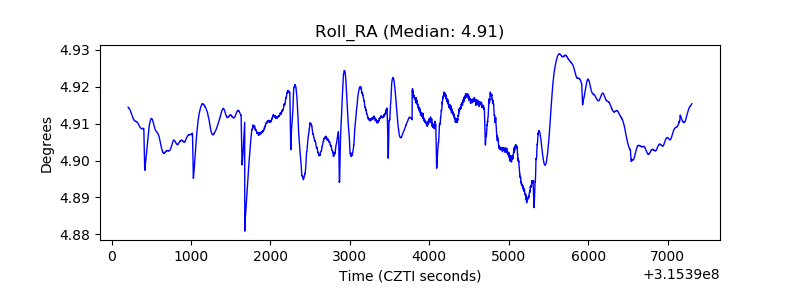 |
| Veto Counter | 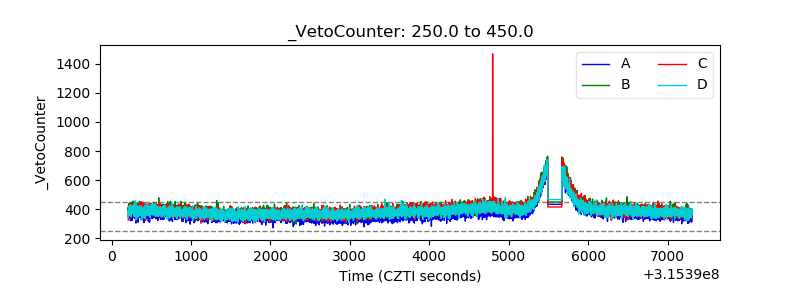 |