| Param | Original file | Final file |
|---|---|---|
| Filename | modeM0/AS1A08_004T03_9000003400_23006cztM0_level2.evt | modeM0/AS1A08_004T03_9000003400_23006cztM0_level2_quad_clean.evt |
| Size (bytes) | 504,599,040 | 99,564,480 |
| Size | 481.2 MB | 95.0 MB |
| Events in quadrant A | 3,327,746 | 643,882 |
| Events in quadrant B | 3,453,484 | 652,348 |
| Events in quadrant C | 3,393,654 | 622,886 |
| Events in quadrant D | 4,624,643 | 601,661 |
| Mode M0 | |||
|---|---|---|---|
| Quadrant | BADHDUFLAG | Total packets | Discarded packets |
| A | 0 | 14550 | 1 |
| B | 0 | 14738 | 1 |
| C | 0 | 14648 | 1 |
| D | 0 | 18301 | 1 |
| Mode SS | |||
|---|---|---|---|
| Quadrant | BADHDUFLAG | Total packets | Discarded packets |
| A | 0 | 146 | 0 |
| B | 0 | 146 | 0 |
| C | 0 | 146 | 0 |
| D | 0 | 146 | 0 |
| Mode M9 | |||
|---|---|---|---|
| Quadrant | BADHDUFLAG | Total packets | Discarded packets |
| A | 0 | 3 | 0 |
| B | 0 | 3 | 0 |
| C | 0 | 3 | 0 |
| D | 0 | 3 | 0 |
| Quadrant | Total seconds | Saturated seconds | Saturation percentage |
|---|---|---|---|
| A | 7091 | 114 | 1.607672% |
| B | 7092 | 132 | 1.861252% |
| C | 7092 | 141 | 1.988156% |
| D | 7092 | 265 | 3.736605% |
Noise dominated data is calculated using 1-second bins in cleaned event files. If a bin has >2000 counts, and if more than 50% of those come from <1% of pixels, then it is considered to be noise-dominated and hence unusable.
| Quadrant | # 1 sec bins | Bins with >0 counts | Bins with >2000 counts | High rate bins dominated by noise | Noise dominated (total time) | Noise dominated (detector-on time) | Marked lightcurve |
|---|---|---|---|---|---|---|---|
| A | 7431 | 7092 | 0 | 0 | 0.00% | 0.00% |  |
| B | 7432 | 7093 | 2 | 2 | 0.03% | 0.03% |  |
| C | 7432 | 7093 | 6 | 6 | 0.08% | 0.08% |  |
| D | 7432 | 7093 | 157 | 157 | 2.11% | 2.21% |  |
Top three noisy pixels from each quadrant. If the there are fewer than three noisy pixels in the level2.evt file, extra rows are filled as -1
| Pixel properties | Quadrant properties | ||||||
|---|---|---|---|---|---|---|---|
| Quadrant | DetID | PixID | Counts | Sigma | Mean | Median | Sigma |
| A | 13 | 254 | 9269 | 48.34 | 861 | 843 | 174.3 |
| A | 3 | 137 | 7813 | 39.99 | 861 | 843 | 174.3 |
| A | 0 | 226 | 7399 | 37.61 | 861 | 843 | 174.3 |
| B | 0 | 189 | 43358 | 256.6 | 853 | 831 | 165.7 |
| B | 0 | 190 | 40468 | 239.16 | 853 | 831 | 165.7 |
| B | 12 | 111 | 20691 | 119.83 | 853 | 831 | 165.7 |
| C | 14 | 238 | 130624 | 670.79 | 821 | 826 | 193.5 |
| C | 10 | 223 | 15497 | 75.82 | 821 | 826 | 193.5 |
| C | 10 | 22 | 14097 | 68.58 | 821 | 826 | 193.5 |
| D | 12 | 227 | 672282 | 3329.07 | 829 | 803 | 201.7 |
| D | 1 | 52 | 472991 | 2341.02 | 829 | 803 | 201.7 |
| D | 13 | 153 | 128972 | 635.44 | 829 | 803 | 201.7 |
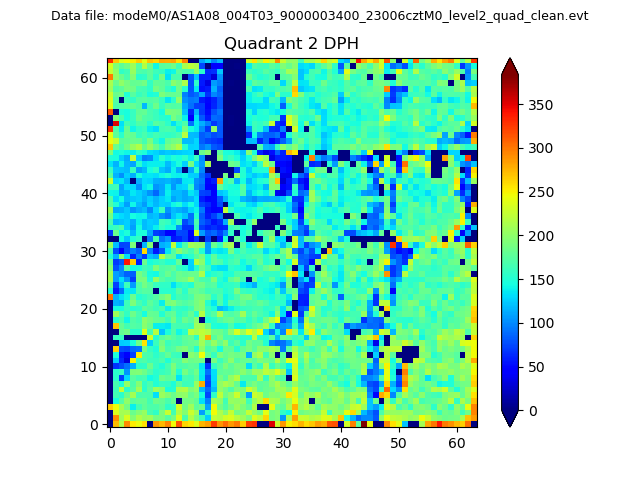
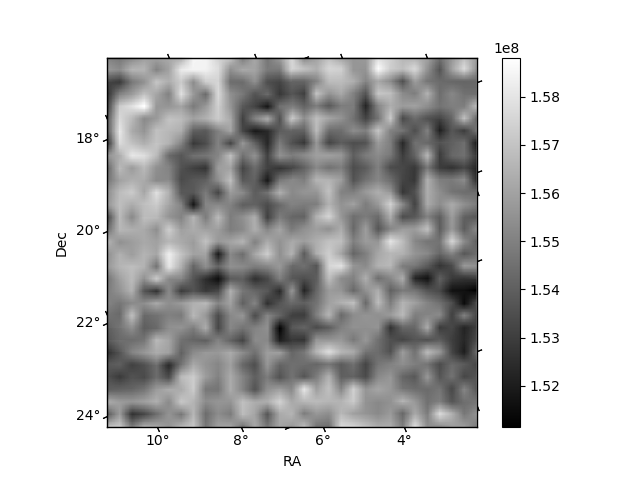
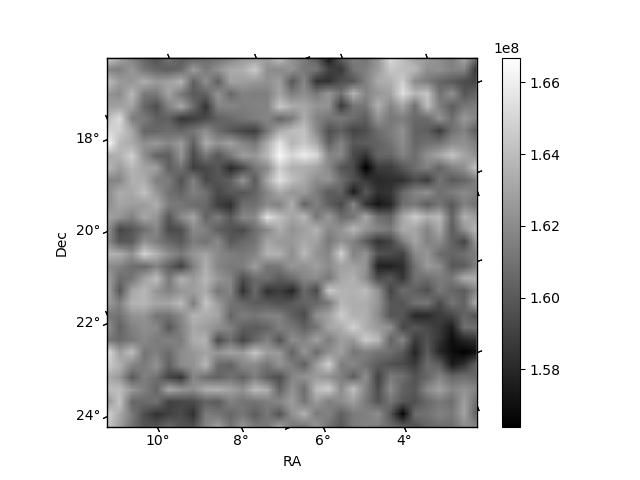
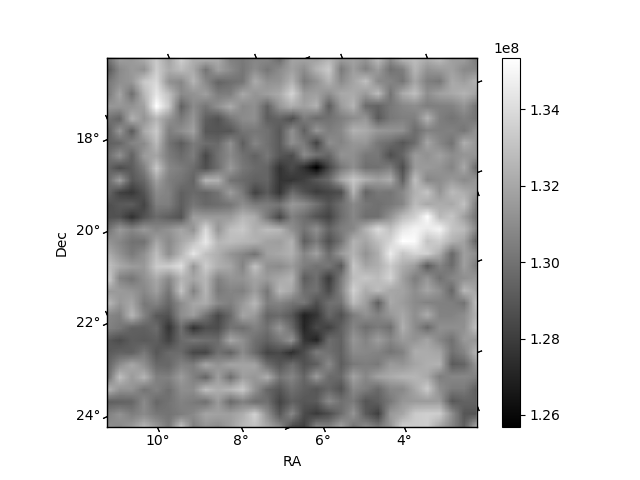
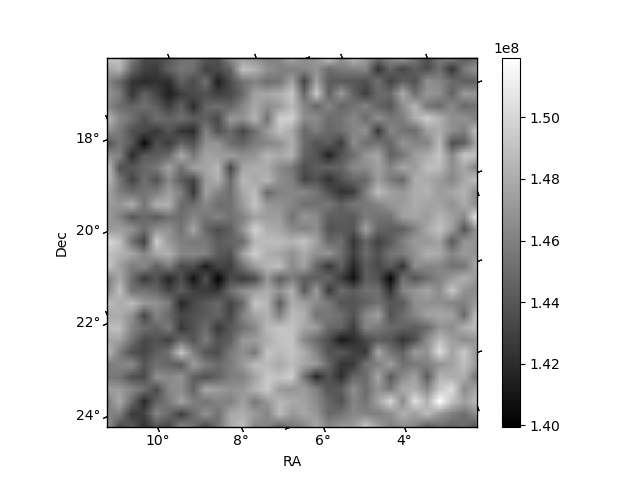
Histogram calculated using DETX and DETY for each event in the final _common_clean file
| Quadrant A | 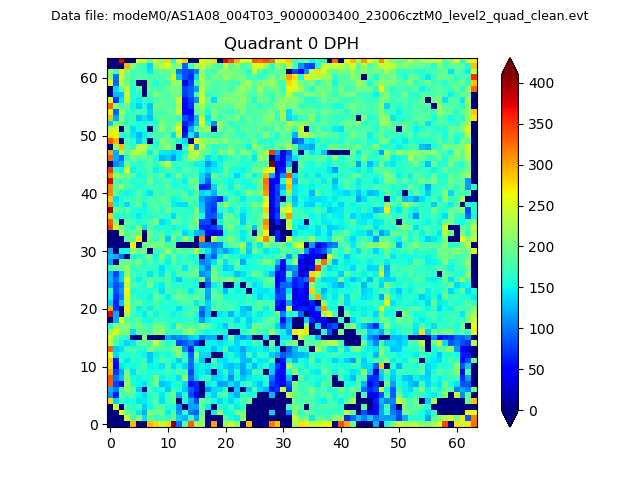 |
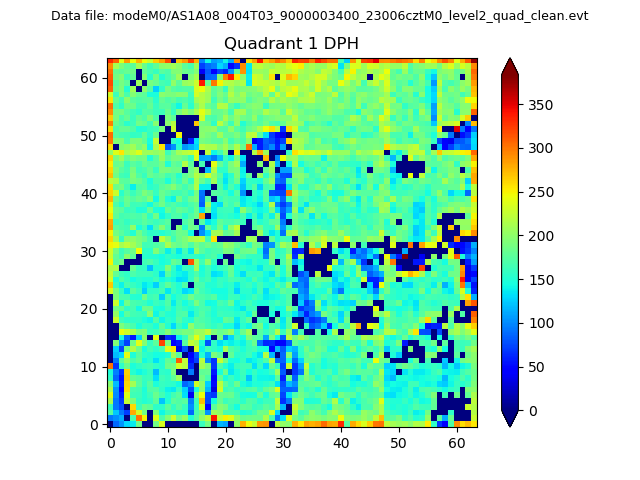 |
Quadrant B |
|---|---|---|---|
| Quadrant D | 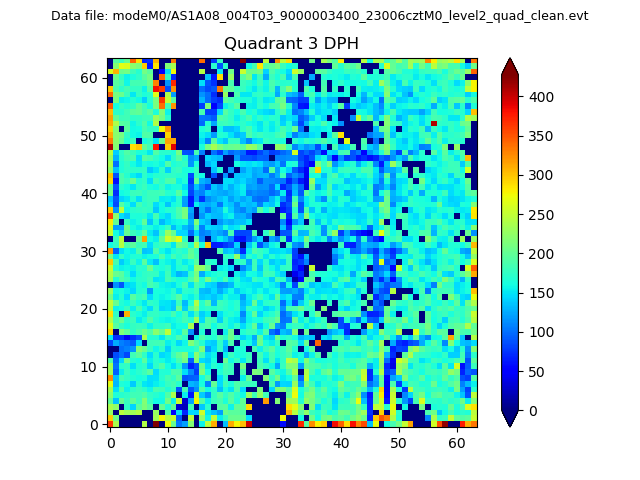 |
 |
Quadrant C |
| Plot type | Count rate plots | Images |
|---|---|---|
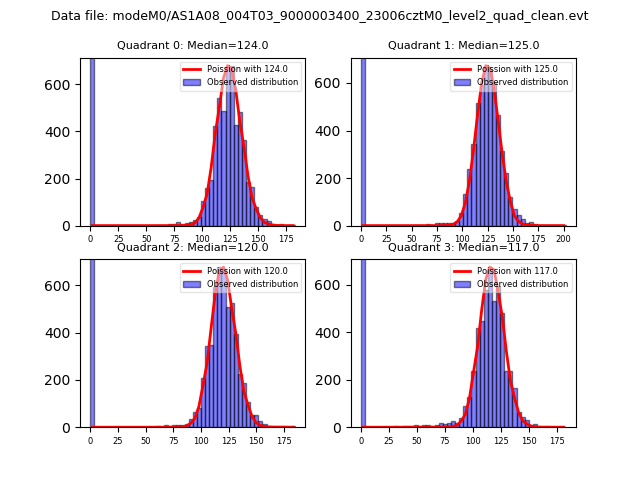
| Comparison with Poisson distribution Blue bars denote a histogram of data divided into 1 sec bins. Red curve is a Poisson curve with rate = median count rate of data. |
 |
 |
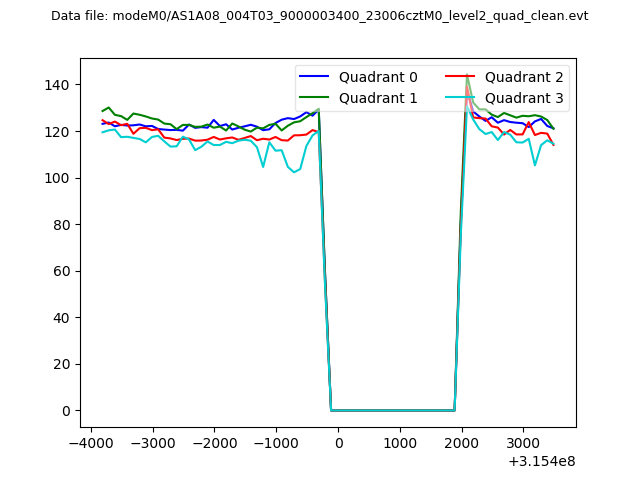
| Quadrant-wise count rates Data is divided into 100 sec bins |
 |
|
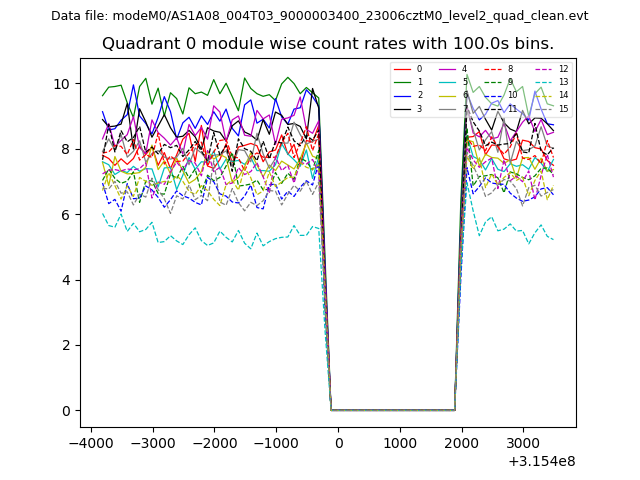
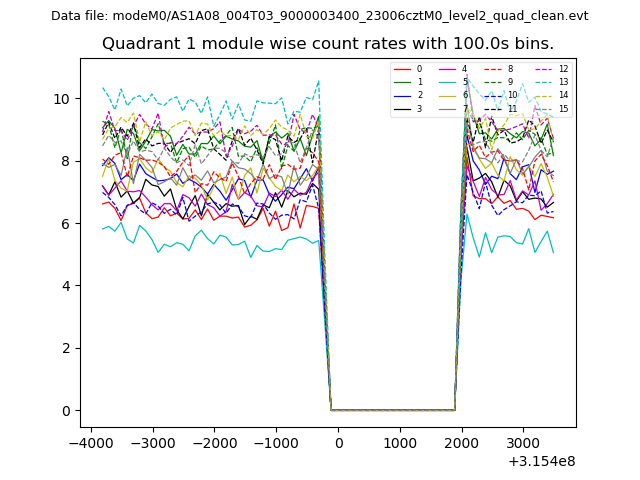
| Module-wise count rates for Quadrant A Data is divided into 100 sec bins |
 |
 |
| Module-wise count rates for Quadrant B Data is divided into 100 sec bins |
 |
 |
| Module-wise count rates for Quadrant C Data is divided into 100 sec bins |
 |
 |
| Module-wise count rates for Quadrant D Data is divided into 100 sec bins |
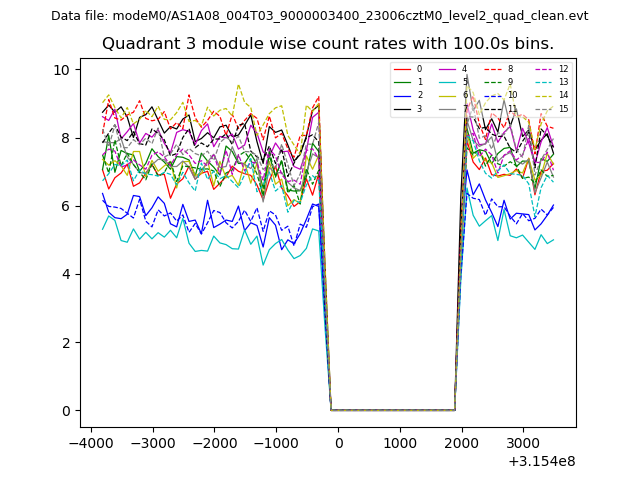 |
 |
| Parameter | Plot |
|---|---|
| CZT HV Monitor | 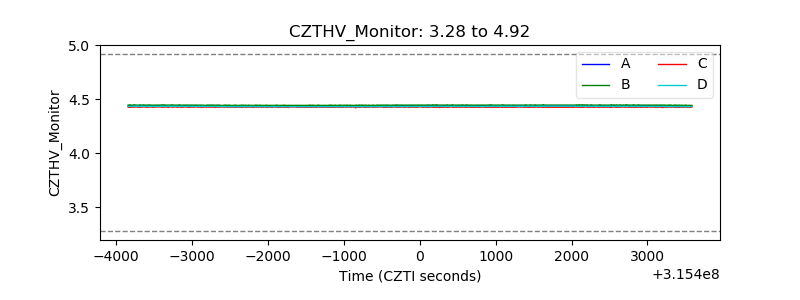 |
| D_VDD | 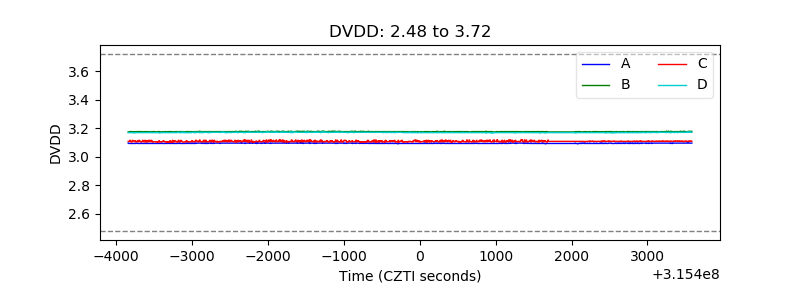 |
| Temperature 1 | 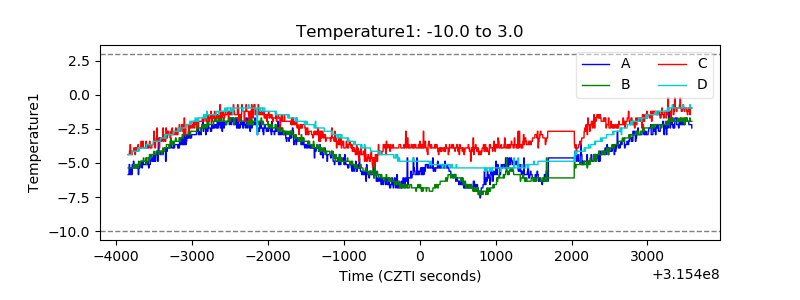 |
| Veto HV Monitor | 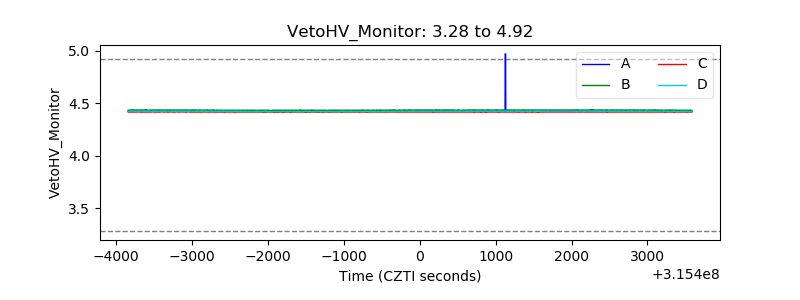 |
| Veto LLD | 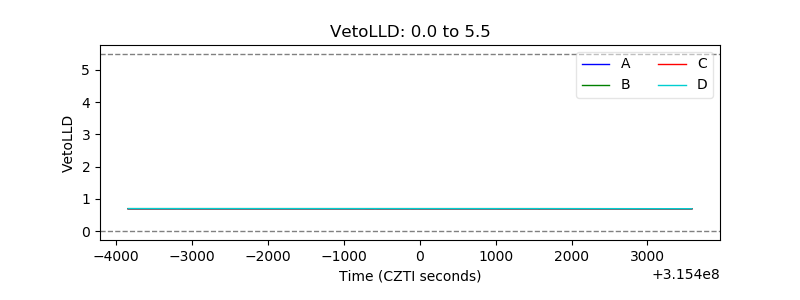 |
| Alpha Counter | 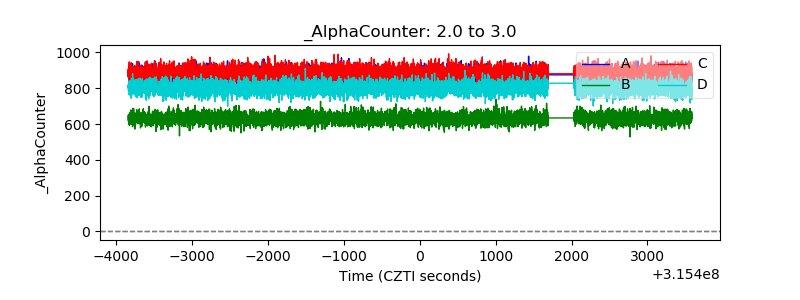 |
| _CPM_Rate | 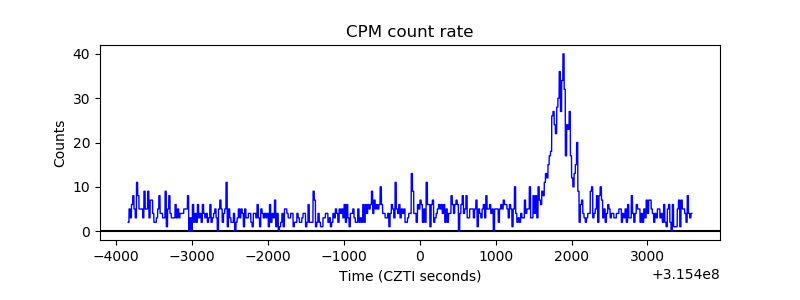 |
| CZT Counter | 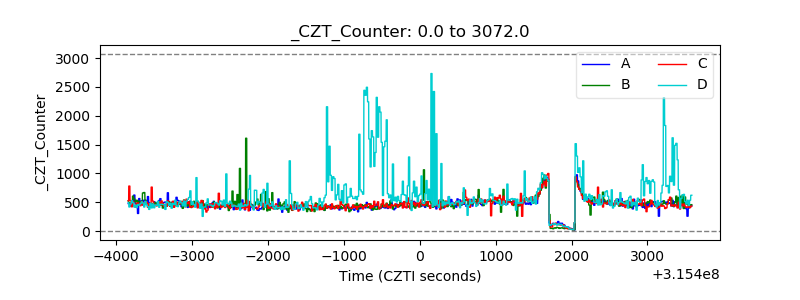 |
| +2.5 Volts monitor |  |
| +5 Volts monitor |  |
| _ROLL_ROT | 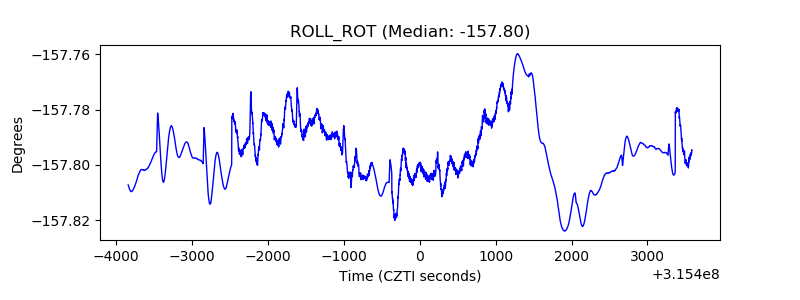 |
| _Roll_DEC | 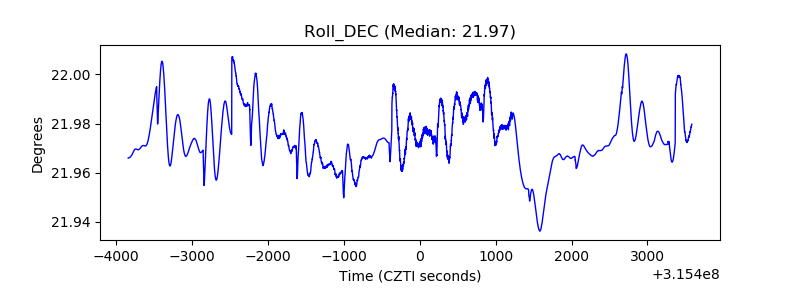 |
| _Roll_RA | 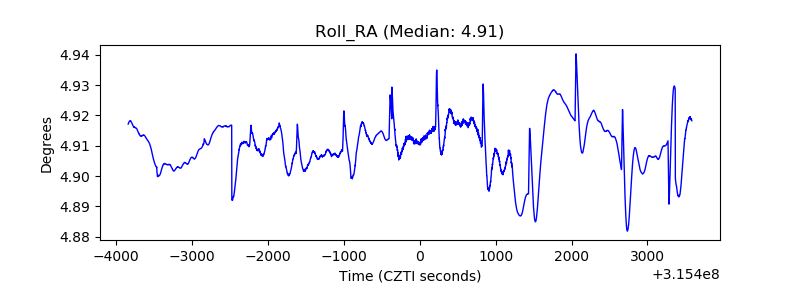 |
| Veto Counter | 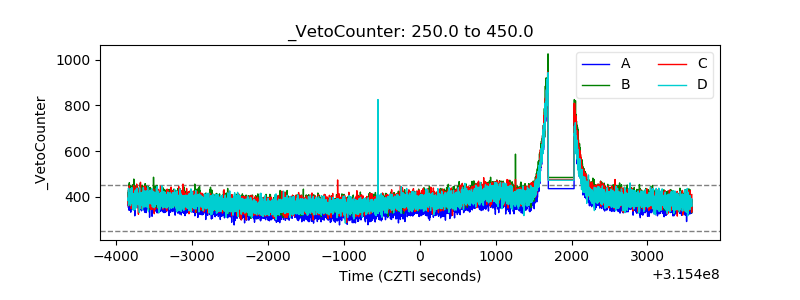 |