| Param | Original file | Final file |
|---|---|---|
| Filename | modeM0/AS1A08_004T03_9000003400_23009cztM0_level2.evt | modeM0/AS1A08_004T03_9000003400_23009cztM0_level2_quad_clean.evt |
| Size (bytes) | 692,591,040 | 129,248,640 |
| Size | 660.5 MB | 123.3 MB |
| Events in quadrant A | 4,223,901 | 846,198 |
| Events in quadrant B | 4,718,337 | 853,934 |
| Events in quadrant C | 4,839,273 | 810,757 |
| Events in quadrant D | 6,585,420 | 780,445 |
| Mode M0 | |||
|---|---|---|---|
| Quadrant | BADHDUFLAG | Total packets | Discarded packets |
| A | 0 | 20319 | 1853 |
| B | 0 | 21678 | 1917 |
| C | 0 | 22174 | 1927 |
| D | 0 | 28140 | 2585 |
| Mode SS | |||
|---|---|---|---|
| Quadrant | BADHDUFLAG | Total packets | Discarded packets |
| A | 0 | 198 | 14 |
| B | 0 | 203 | 21 |
| C | 0 | 200 | 18 |
| D | 0 | 198 | 18 |
| Mode M9 | |||
|---|---|---|---|
| Quadrant | BADHDUFLAG | Total packets | Discarded packets |
| A | 0 | 16 | 0 |
| B | 0 | 19 | 3 |
| C | 0 | 18 | 2 |
| D | 0 | 17 | 1 |
| Quadrant | Total seconds | Saturated seconds | Saturation percentage |
|---|---|---|---|
| A | 8982 | 98 | 1.091071% |
| B | 9002 | 215 | 2.388358% |
| C | 8986 | 222 | 2.470510% |
| D | 8954 | 445 | 4.969846% |
Noise dominated data is calculated using 1-second bins in cleaned event files. If a bin has >2000 counts, and if more than 50% of those come from <1% of pixels, then it is considered to be noise-dominated and hence unusable.
| Quadrant | # 1 sec bins | Bins with >0 counts | Bins with >2000 counts | High rate bins dominated by noise | Noise dominated (total time) | Noise dominated (detector-on time) | Marked lightcurve |
|---|---|---|---|---|---|---|---|
| A | 19534 | 9091 | 0 | 0 | 0.00% | 0.00% | 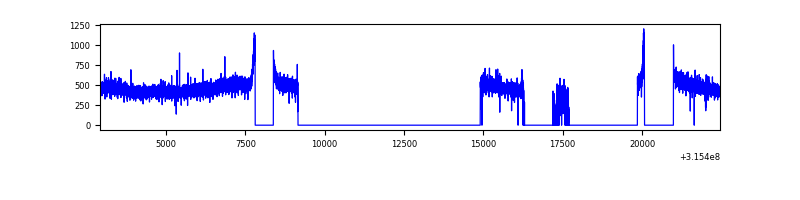 |
| B | 19534 | 9106 | 66 | 66 | 0.34% | 0.72% | 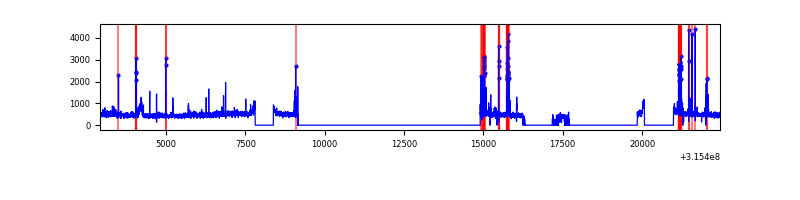 |
| C | 19533 | 9092 | 28 | 28 | 0.14% | 0.31% | 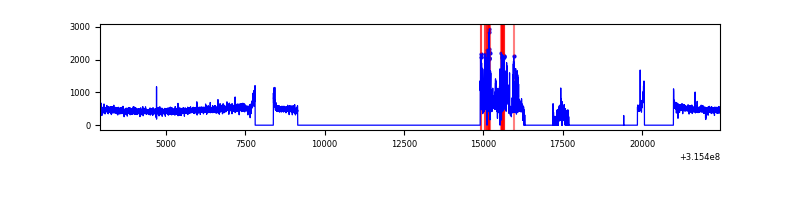 |
| D | 19533 | 9066 | 242 | 242 | 1.24% | 2.67% | 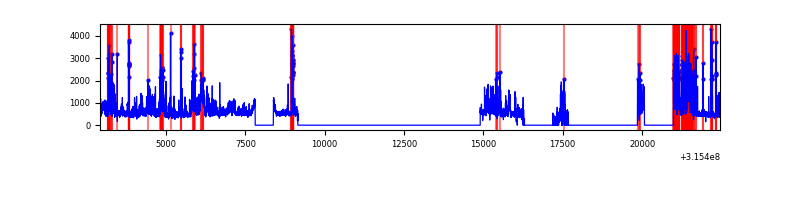 |
Top three noisy pixels from each quadrant. If the there are fewer than three noisy pixels in the level2.evt file, extra rows are filled as -1
| Pixel properties | Quadrant properties | ||||||
|---|---|---|---|---|---|---|---|
| Quadrant | DetID | PixID | Counts | Sigma | Mean | Median | Sigma |
| A | 11 | 47 | 12865 | 53.53 | 1092 | 1067 | 220.4 |
| A | 13 | 254 | 12174 | 50.39 | 1092 | 1067 | 220.4 |
| A | 3 | 137 | 9677 | 39.06 | 1092 | 1067 | 220.4 |
| B | 4 | 216 | 272835 | 1307.19 | 1081 | 1051 | 207.9 |
| B | 5 | 172 | 83030 | 394.29 | 1081 | 1051 | 207.9 |
| B | 0 | 189 | 46335 | 217.8 | 1081 | 1051 | 207.9 |
| C | 9 | 15 | 597852 | 2423.81 | 1041 | 1043 | 246.2 |
| C | 14 | 238 | 163535 | 659.93 | 1041 | 1043 | 246.2 |
| C | 7 | 247 | 13204 | 49.39 | 1041 | 1043 | 246.2 |
| D | 1 | 52 | 1112575 | 4350.42 | 1048 | 1020 | 255.5 |
| D | 12 | 227 | 880312 | 3441.38 | 1048 | 1020 | 255.5 |
| D | 13 | 153 | 307697 | 1200.28 | 1048 | 1020 | 255.5 |
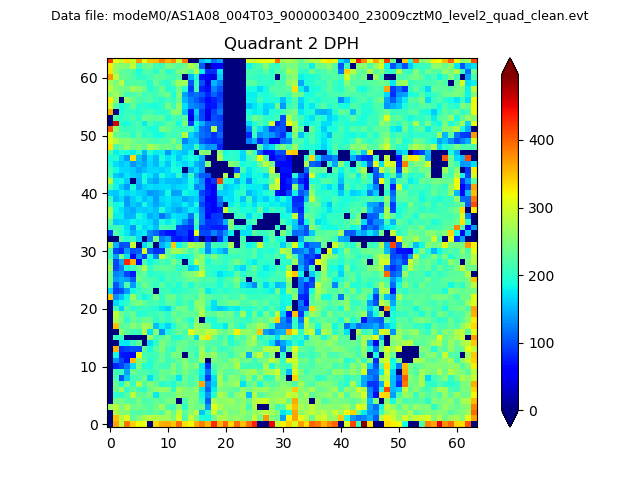
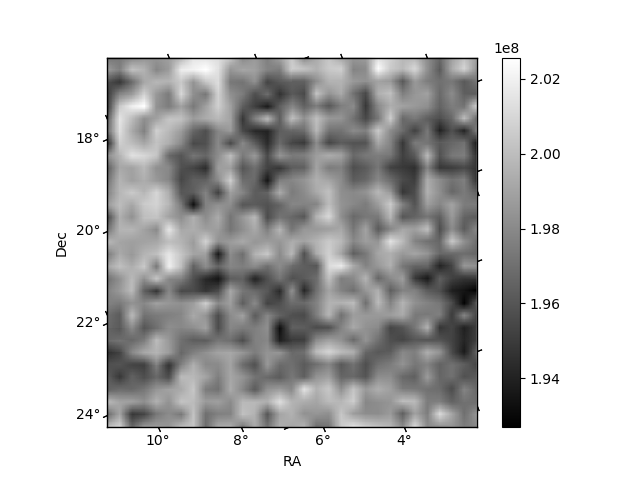
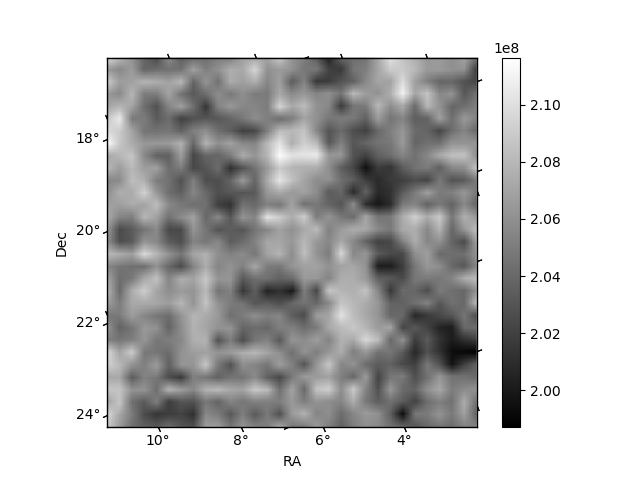
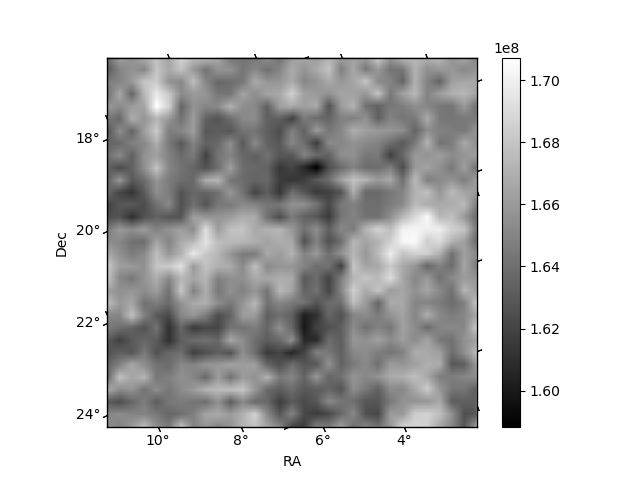
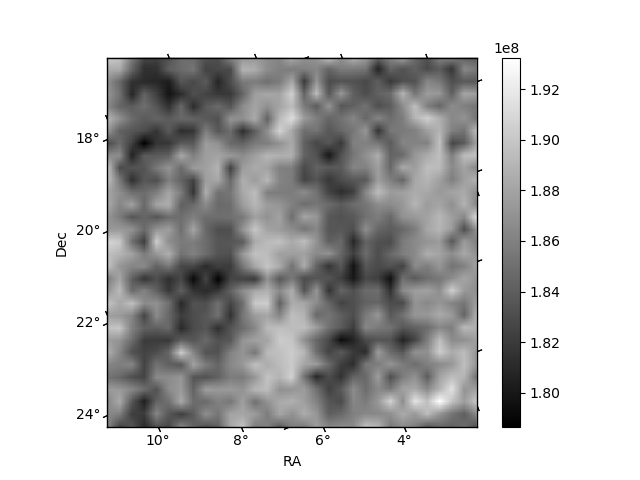
Histogram calculated using DETX and DETY for each event in the final _common_clean file
| Quadrant A | 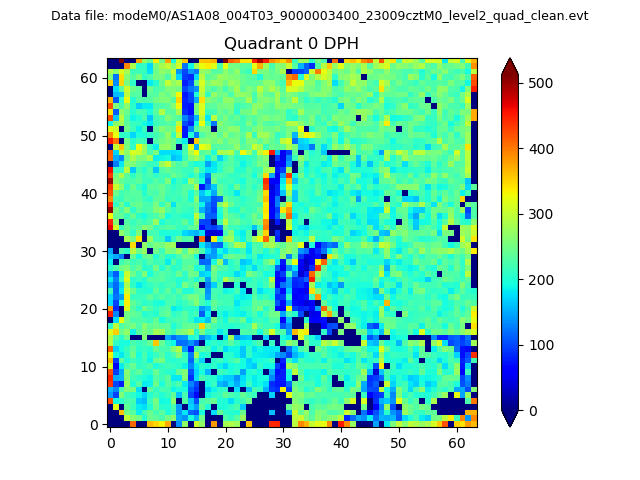 |
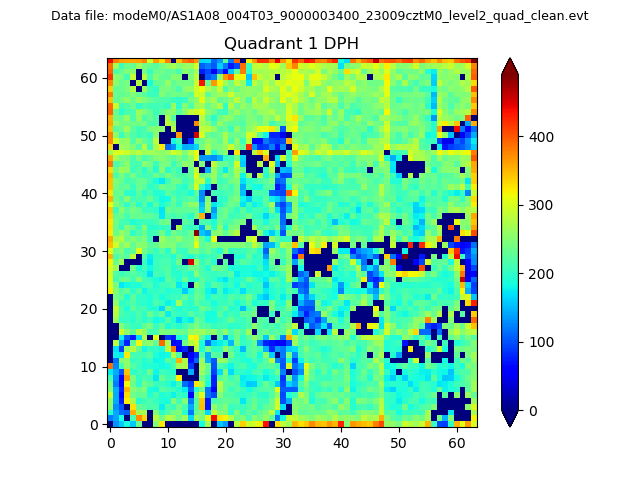 |
Quadrant B |
|---|---|---|---|
| Quadrant D | 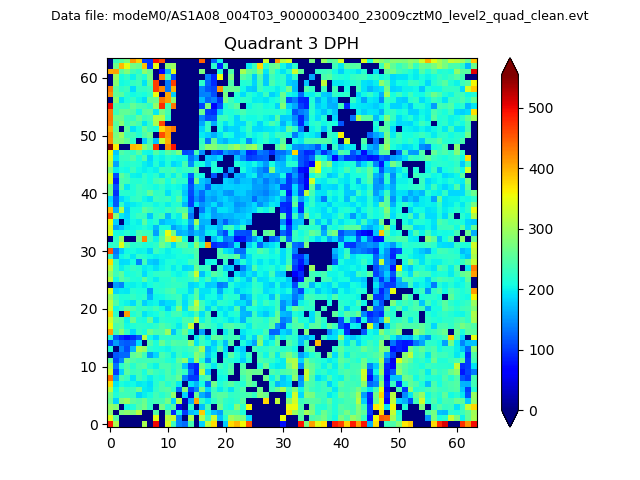 |
 |
Quadrant C |
| Plot type | Count rate plots | Images |
|---|---|---|
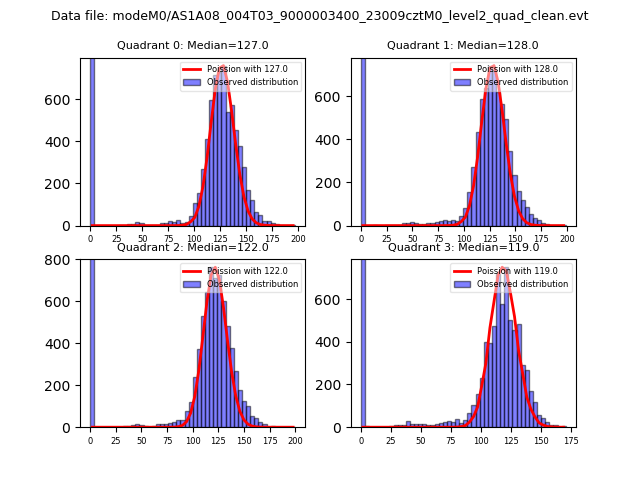
| Comparison with Poisson distribution Blue bars denote a histogram of data divided into 1 sec bins. Red curve is a Poisson curve with rate = median count rate of data. |
 |
 |
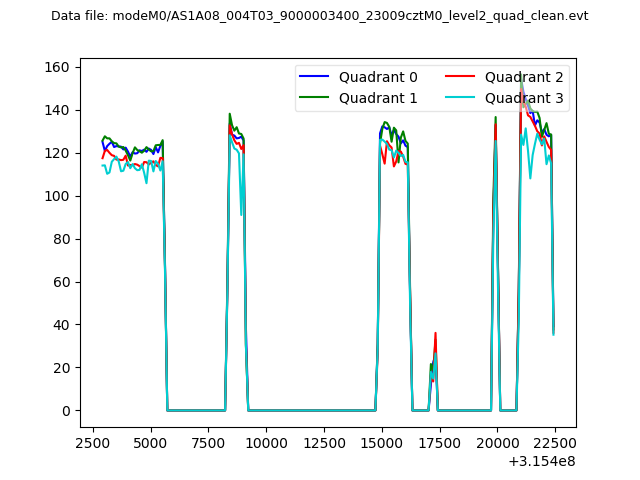
| Quadrant-wise count rates Data is divided into 100 sec bins |
 |
|
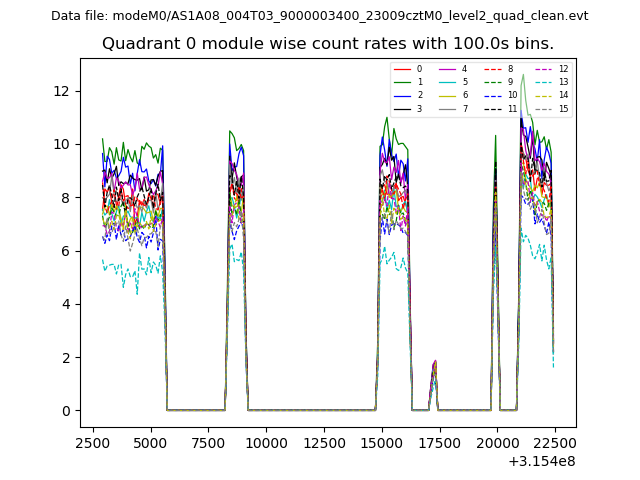
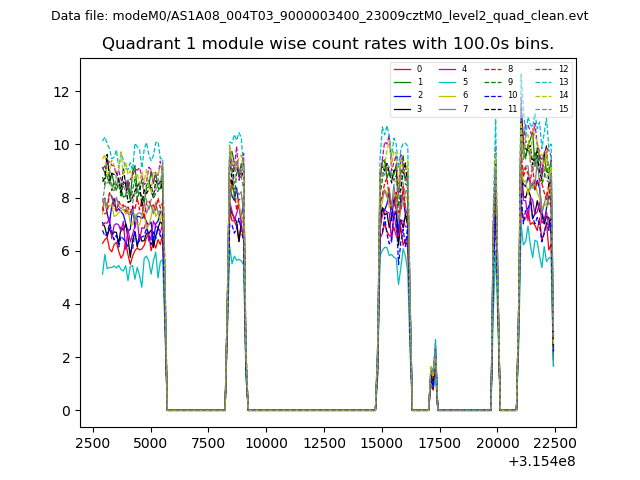
| Module-wise count rates for Quadrant A Data is divided into 100 sec bins |
 |
 |
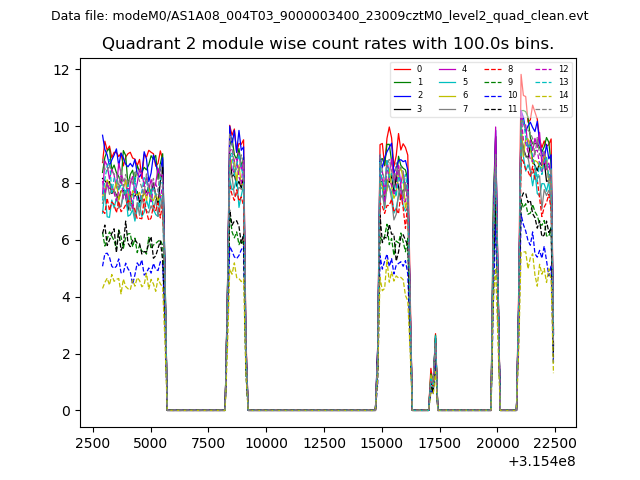
| Module-wise count rates for Quadrant B Data is divided into 100 sec bins |
 |
 |
| Module-wise count rates for Quadrant C Data is divided into 100 sec bins |
 |
 |
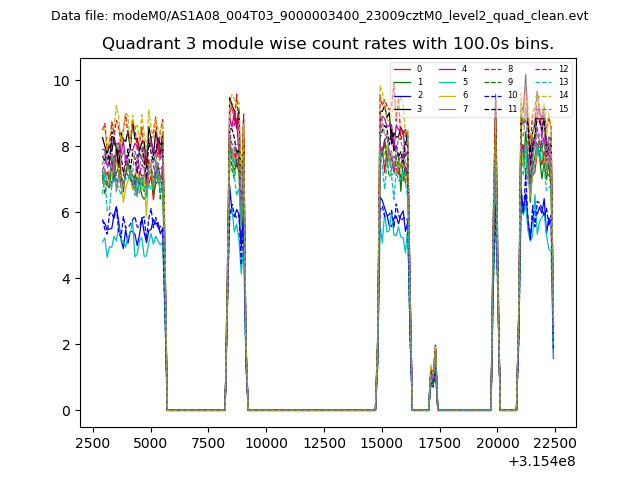
| Module-wise count rates for Quadrant D Data is divided into 100 sec bins |
 |
 |
| Parameter | Plot |
|---|---|
| CZT HV Monitor | 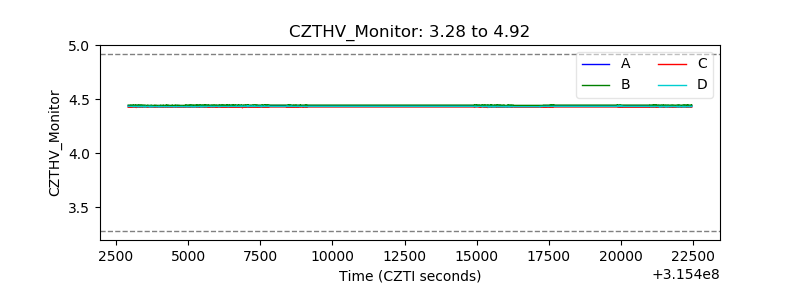 |
| D_VDD | 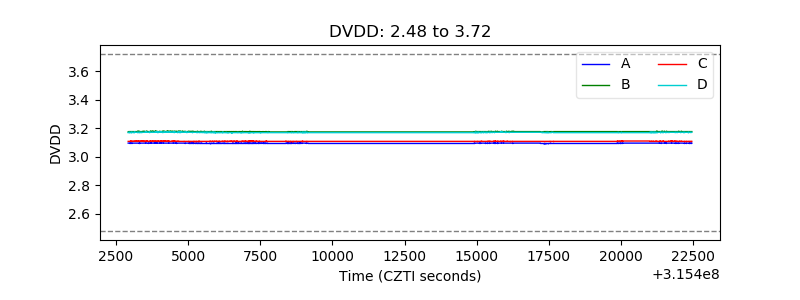 |
| Temperature 1 | 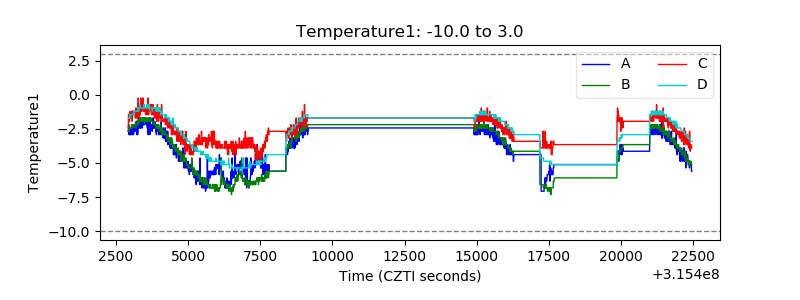 |
| Veto HV Monitor | 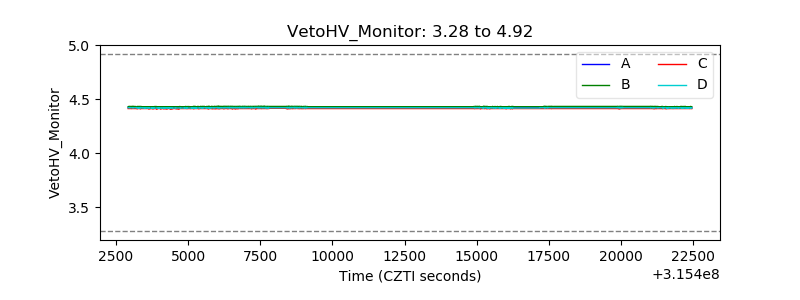 |
| Veto LLD | 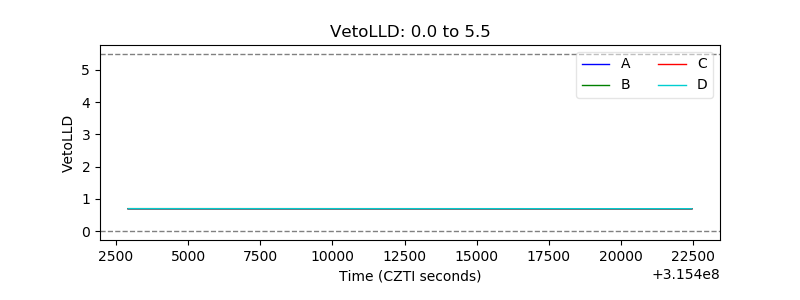 |
| Alpha Counter | 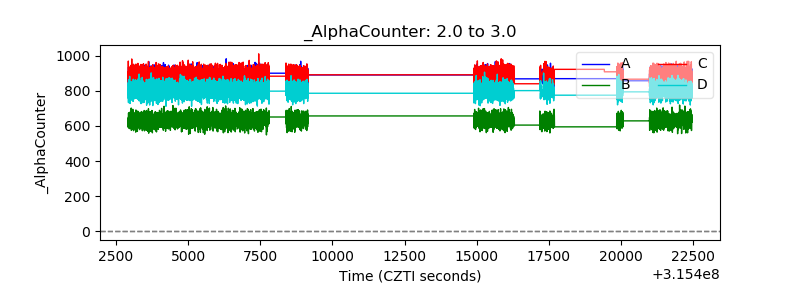 |
| _CPM_Rate | 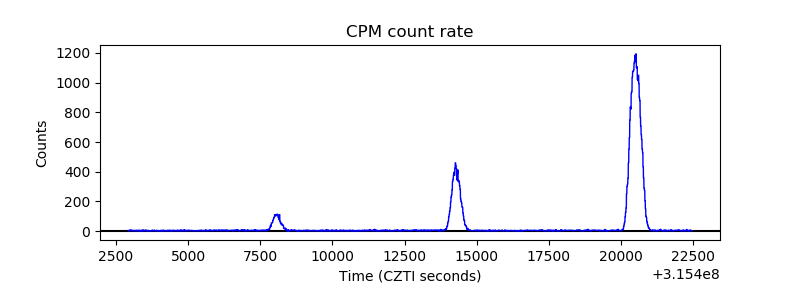 |
| CZT Counter | 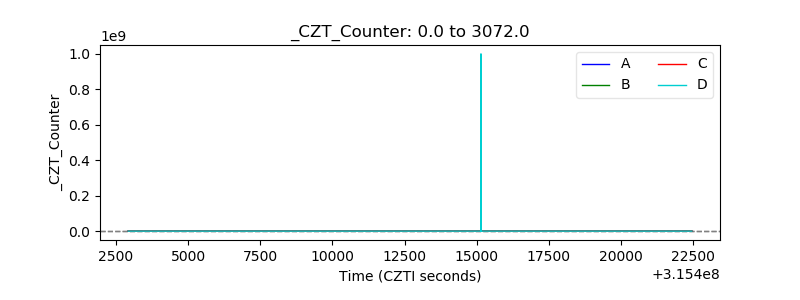 |
| +2.5 Volts monitor |  |
| +5 Volts monitor | 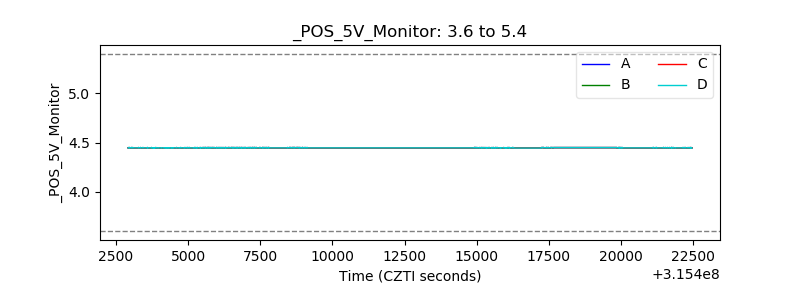 |
| _ROLL_ROT | 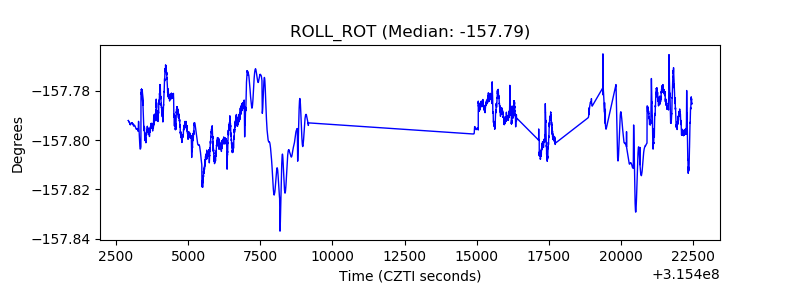 |
| _Roll_DEC | 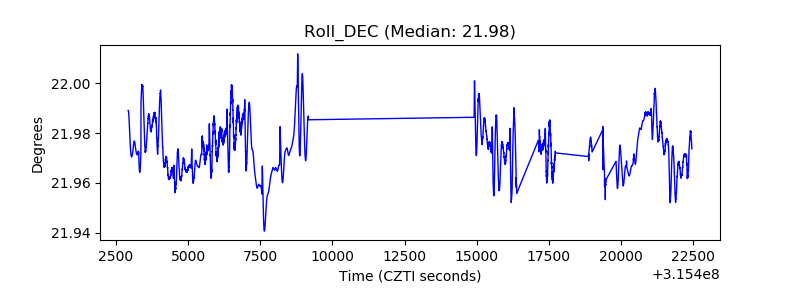 |
| _Roll_RA | 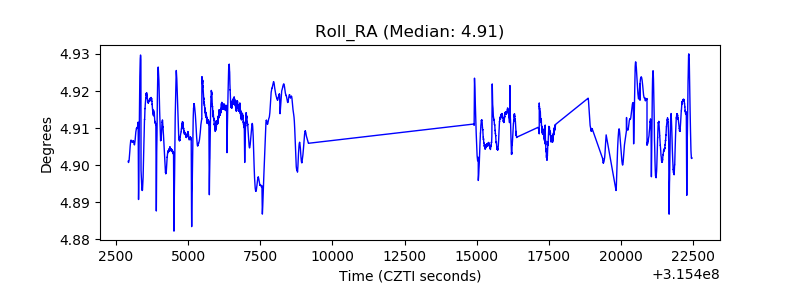 |
| Veto Counter | 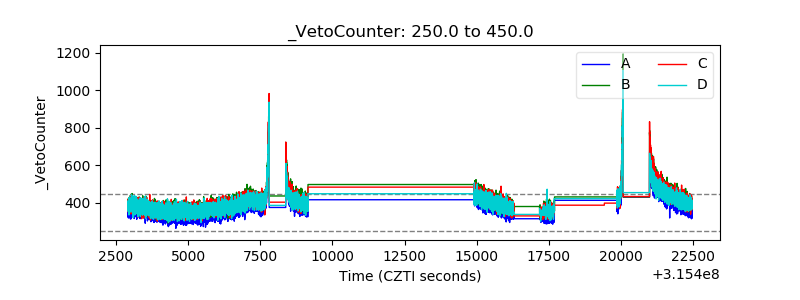 |