| Param | Original file | Final file |
|---|---|---|
| Filename | modeM0/AS1A08_004T03_9000003400_23013cztM0_level2.evt | modeM0/AS1A08_004T03_9000003400_23013cztM0_level2_quad_clean.evt |
| Size (bytes) | 523,503,360 | 92,041,920 |
| Size | 499.3 MB | 87.8 MB |
| Events in quadrant A | 3,064,492 | 605,221 |
| Events in quadrant B | 3,235,863 | 623,352 |
| Events in quadrant C | 3,546,855 | 581,233 |
| Events in quadrant D | 5,578,988 | 536,929 |
| Mode M0 | |||
|---|---|---|---|
| Quadrant | BADHDUFLAG | Total packets | Discarded packets |
| A | 0 | 13079 | 2 |
| B | 0 | 13554 | 2 |
| C | 0 | 14451 | 2 |
| D | 0 | 20869 | 2 |
| Mode SS | |||
|---|---|---|---|
| Quadrant | BADHDUFLAG | Total packets | Discarded packets |
| A | 0 | 130 | 0 |
| B | 0 | 130 | 0 |
| C | 0 | 130 | 0 |
| D | 0 | 130 | 0 |
| Mode M9 | |||
|---|---|---|---|
| Quadrant | BADHDUFLAG | Total packets | Discarded packets |
| A | 0 | 13 | 0 |
| B | 0 | 14 | 0 |
| C | 0 | 14 | 0 |
| D | 0 | 14 | 0 |
| Quadrant | Total seconds | Saturated seconds | Saturation percentage |
|---|---|---|---|
| A | 6307 | 12 | 0.190265% |
| B | 6307 | 54 | 0.856192% |
| C | 6307 | 188 | 2.980815% |
| D | 6307 | 617 | 9.782781% |
Noise dominated data is calculated using 1-second bins in cleaned event files. If a bin has >2000 counts, and if more than 50% of those come from <1% of pixels, then it is considered to be noise-dominated and hence unusable.
| Quadrant | # 1 sec bins | Bins with >0 counts | Bins with >2000 counts | High rate bins dominated by noise | Noise dominated (total time) | Noise dominated (detector-on time) | Marked lightcurve |
|---|---|---|---|---|---|---|---|
| A | 7527 | 6308 | 1 | 1 | 0.01% | 0.02% | 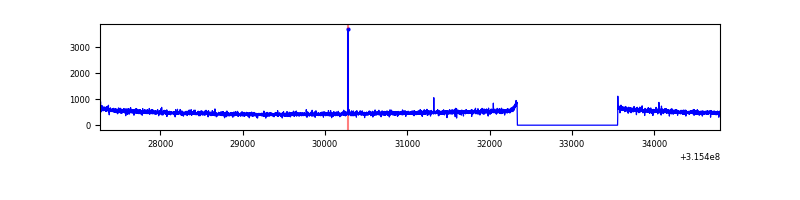 |
| B | 7527 | 6308 | 23 | 23 | 0.31% | 0.36% | 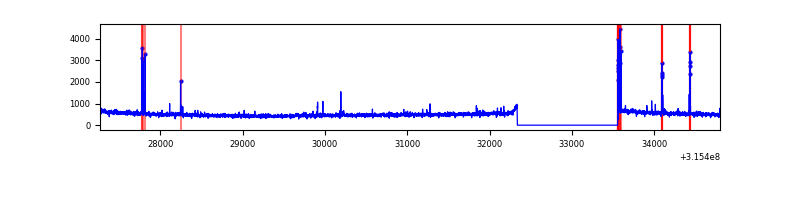 |
| C | 7527 | 6308 | 92 | 92 | 1.22% | 1.46% | 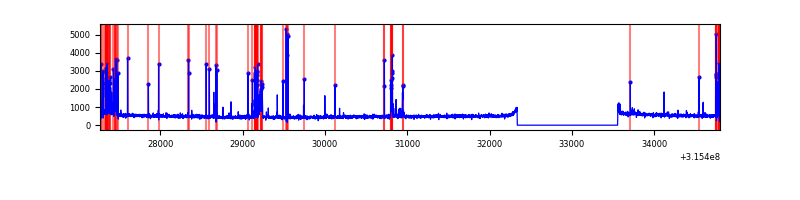 |
| D | 7527 | 6308 | 514 | 514 | 6.83% | 8.15% | 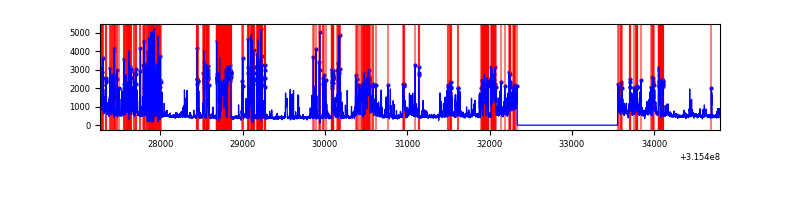 |
Top three noisy pixels from each quadrant. If the there are fewer than three noisy pixels in the level2.evt file, extra rows are filled as -1
| Pixel properties | Quadrant properties | ||||||
|---|---|---|---|---|---|---|---|
| Quadrant | DetID | PixID | Counts | Sigma | Mean | Median | Sigma |
| A | 13 | 254 | 8764 | 49.87 | 793 | 775 | 160.2 |
| A | 0 | 226 | 6804 | 37.64 | 793 | 775 | 160.2 |
| A | 3 | 137 | 6662 | 36.75 | 793 | 775 | 160.2 |
| B | 4 | 216 | 93131 | 614.43 | 794 | 775 | 150.3 |
| B | 0 | 189 | 22727 | 146.04 | 794 | 775 | 150.3 |
| B | 12 | 111 | 18049 | 114.92 | 794 | 775 | 150.3 |
| C | 10 | 9 | 430550 | 2424.24 | 761 | 768 | 177.3 |
| C | 14 | 238 | 121664 | 681.93 | 761 | 768 | 177.3 |
| C | 0 | 10 | 17154 | 92.43 | 761 | 768 | 177.3 |
| D | 1 | 52 | 2495840 | 13721.12 | 747 | 729 | 181.8 |
| D | 13 | 153 | 106372 | 580.95 | 747 | 729 | 181.8 |
| D | 2 | 152 | 66717 | 362.88 | 747 | 729 | 181.8 |
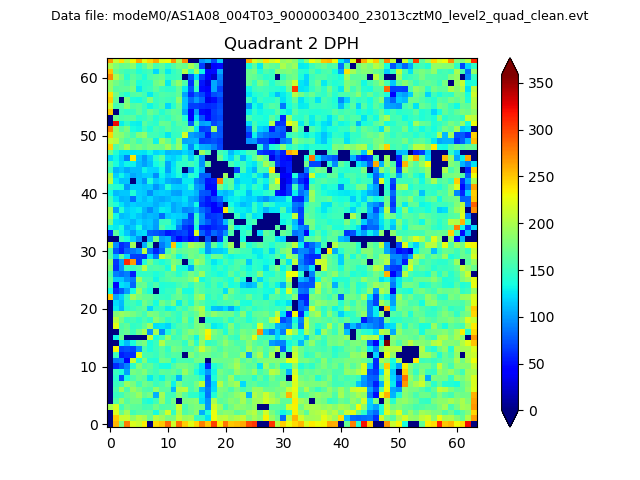
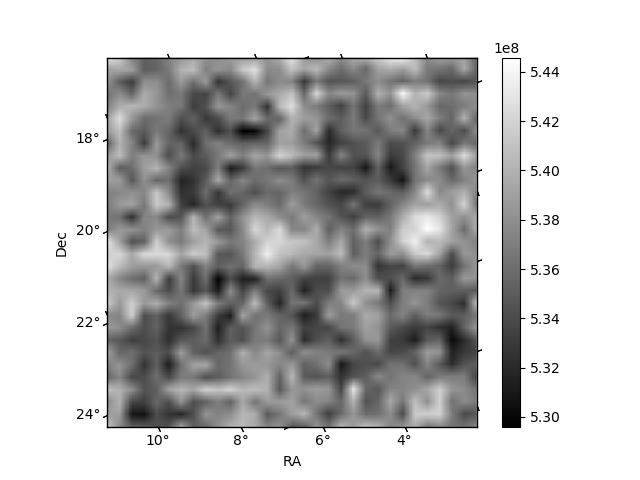
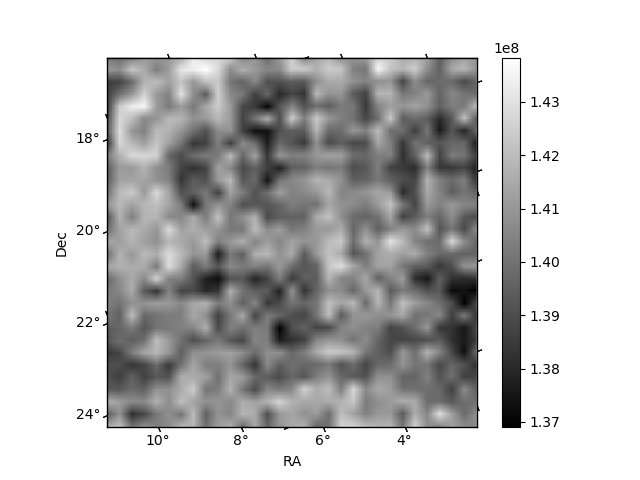
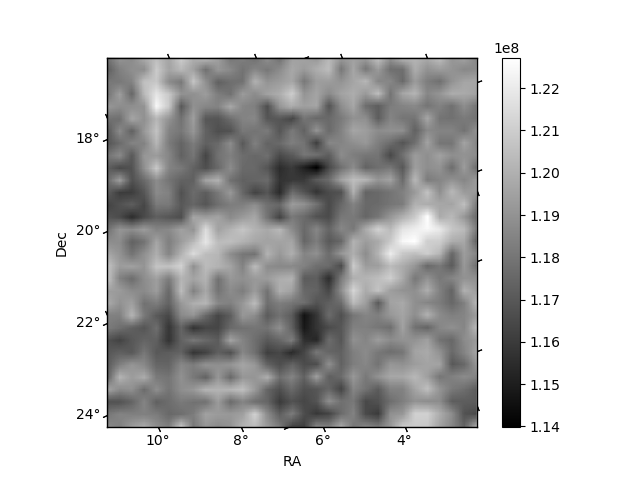
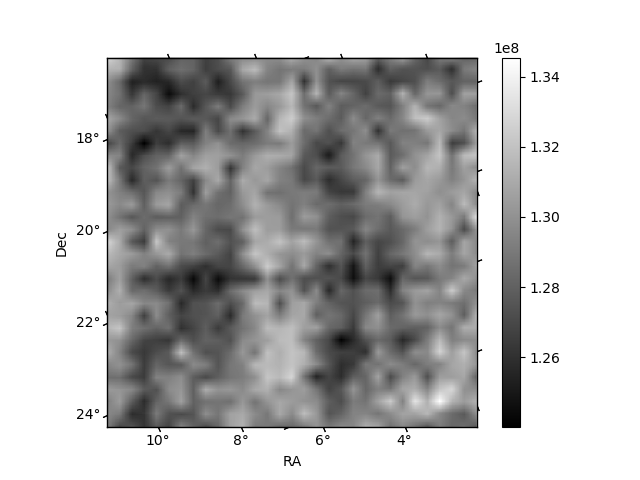
Histogram calculated using DETX and DETY for each event in the final _common_clean file
| Quadrant A | 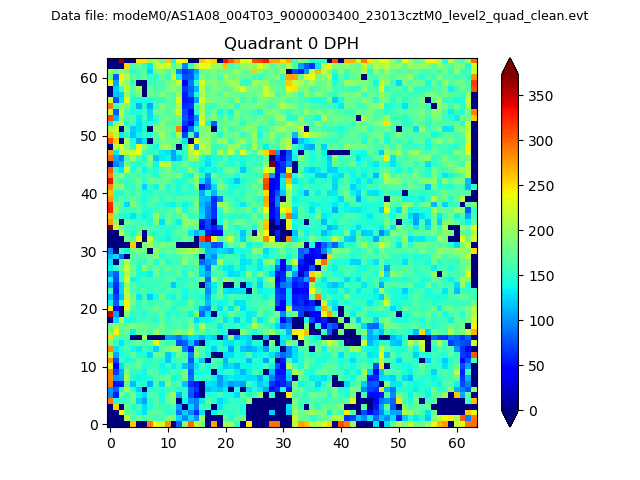 |
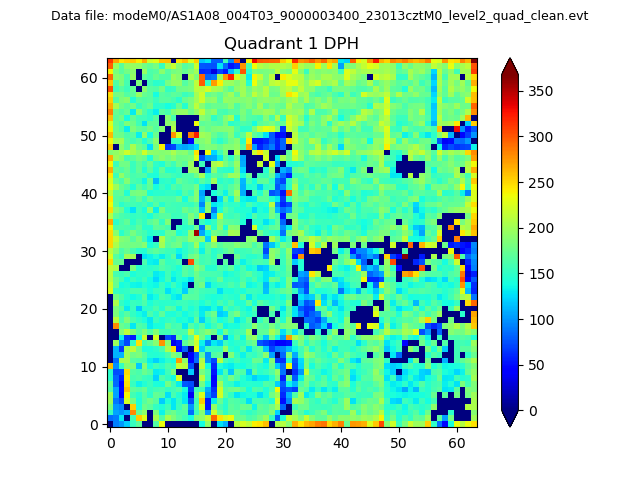 |
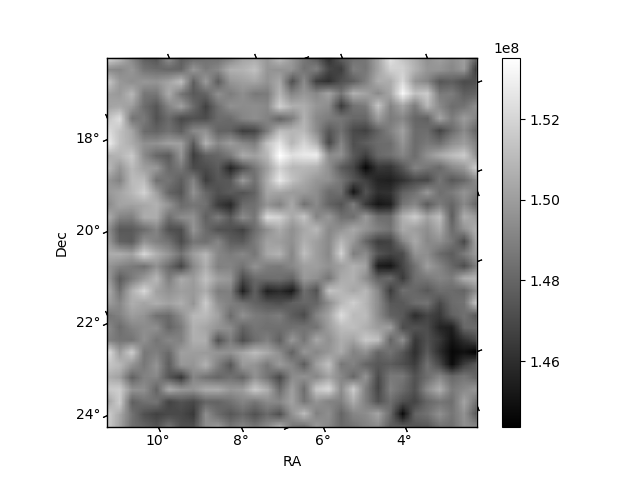
Quadrant B |
|---|---|---|---|
| Quadrant D | 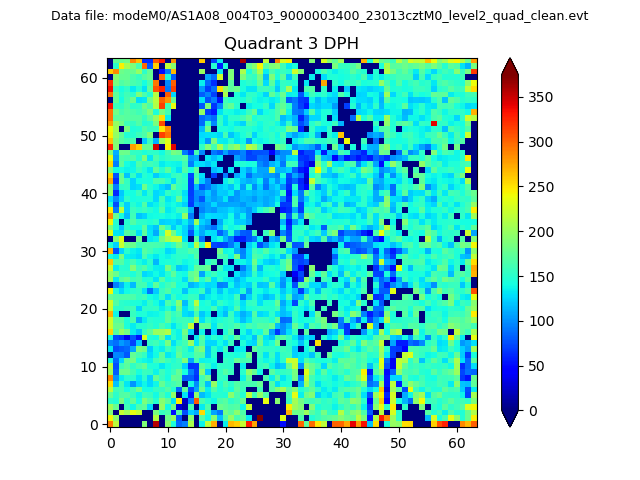 |
 |
Quadrant C |
| Plot type | Count rate plots | Images |
|---|---|---|
| Comparison with Poisson distribution Blue bars denote a histogram of data divided into 1 sec bins. Red curve is a Poisson curve with rate = median count rate of data. |
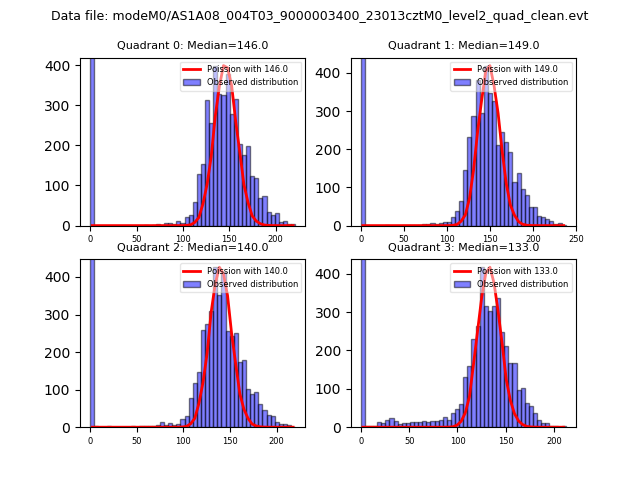 |
 |
| Quadrant-wise count rates Data is divided into 100 sec bins |
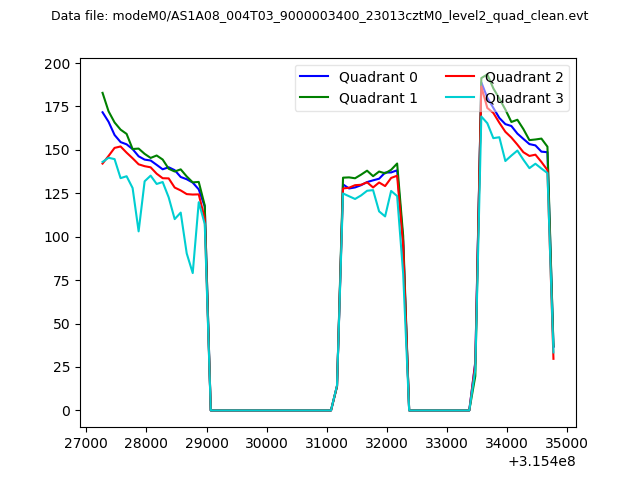 |
|
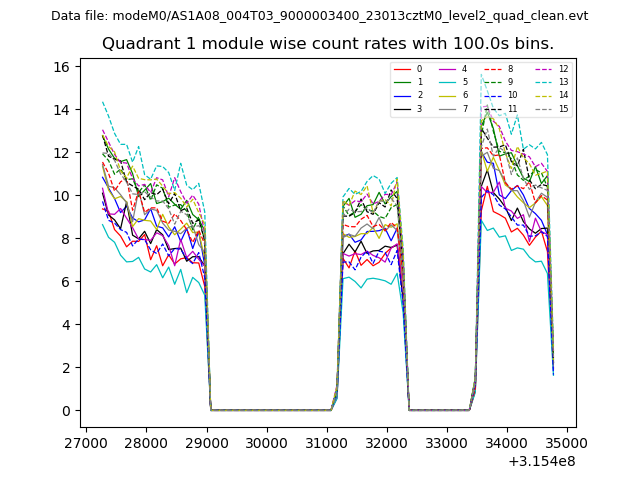
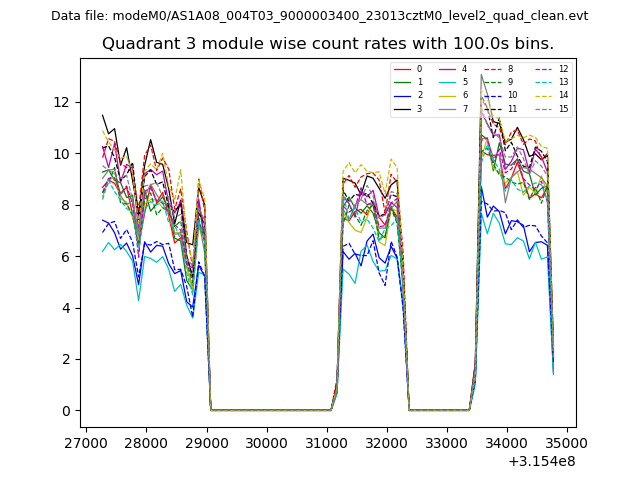
| Module-wise count rates for Quadrant A Data is divided into 100 sec bins |
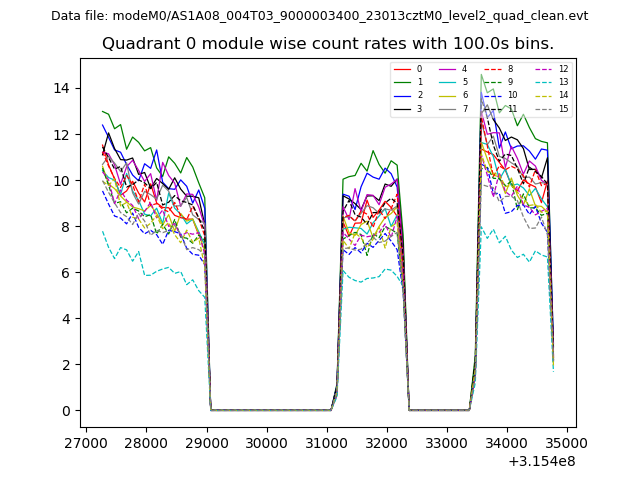 |
 |
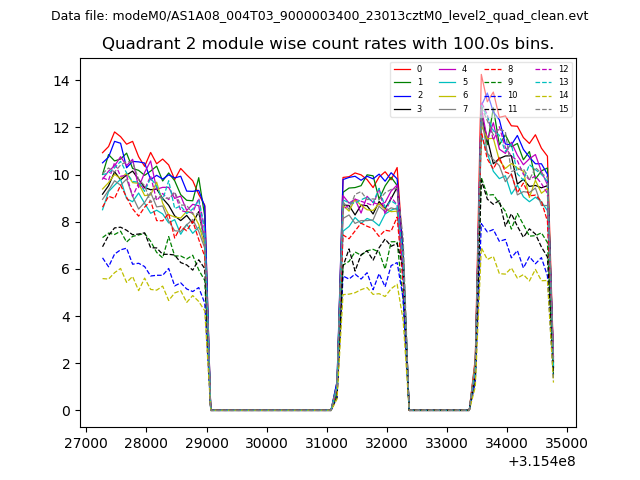
| Module-wise count rates for Quadrant B Data is divided into 100 sec bins |
 |
 |
| Module-wise count rates for Quadrant C Data is divided into 100 sec bins |
 |
 |
| Module-wise count rates for Quadrant D Data is divided into 100 sec bins |
 |
 |
| Parameter | Plot |
|---|---|
| CZT HV Monitor | 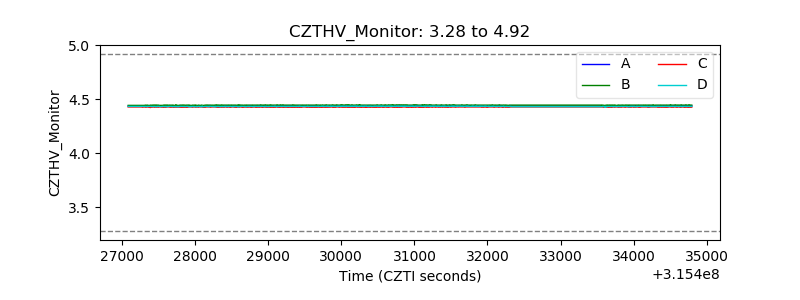 |
| D_VDD | 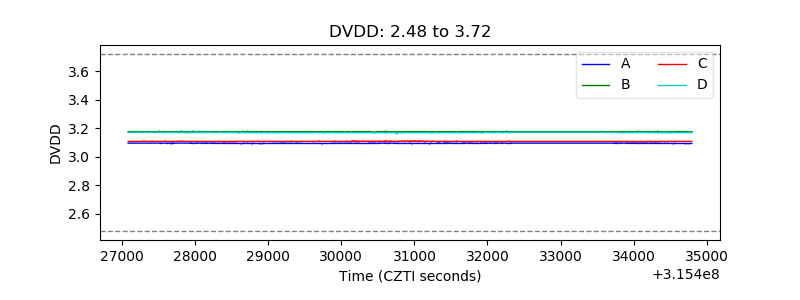 |
| Temperature 1 | 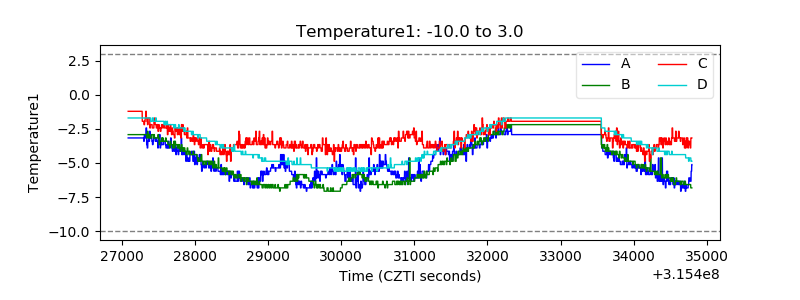 |
| Veto HV Monitor | 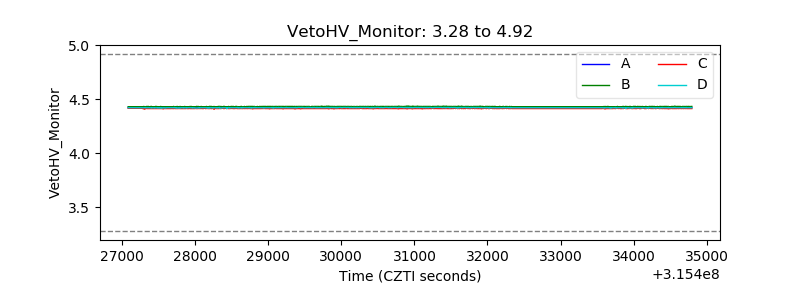 |
| Veto LLD | 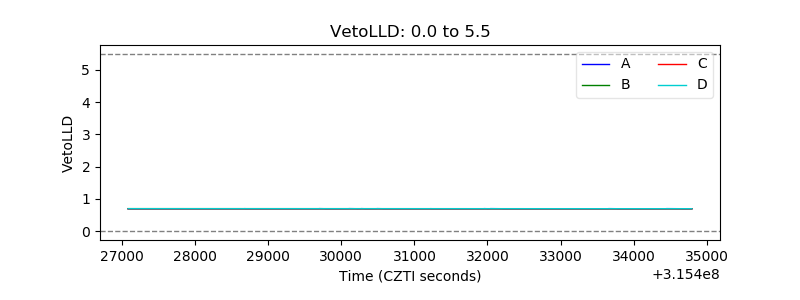 |
| Alpha Counter | 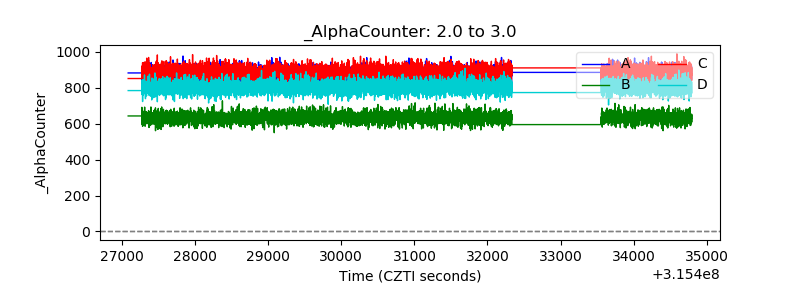 |
| _CPM_Rate | 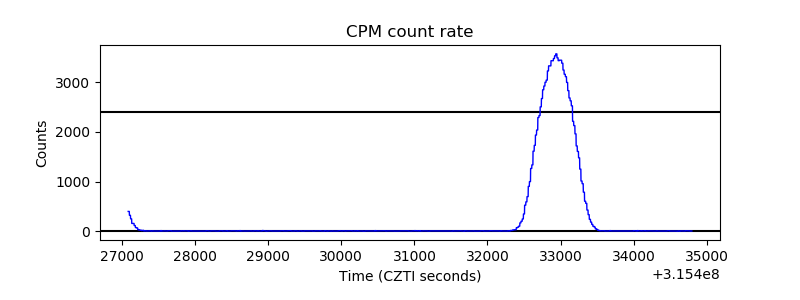 |
| CZT Counter | 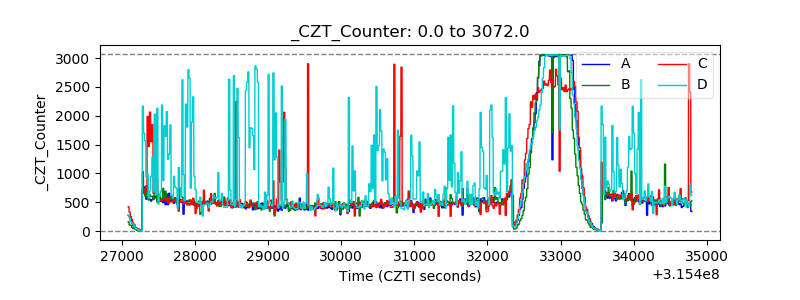 |
| +2.5 Volts monitor |  |
| +5 Volts monitor |  |
| _ROLL_ROT | 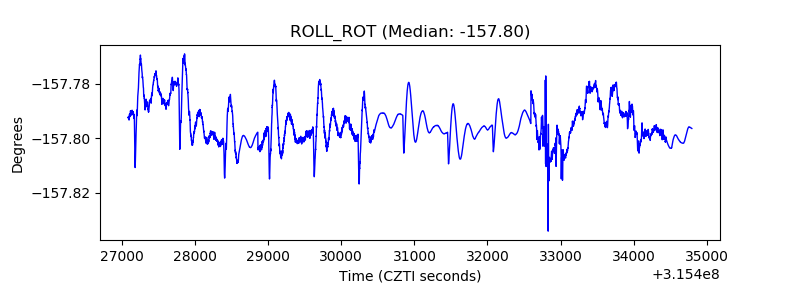 |
| _Roll_DEC | 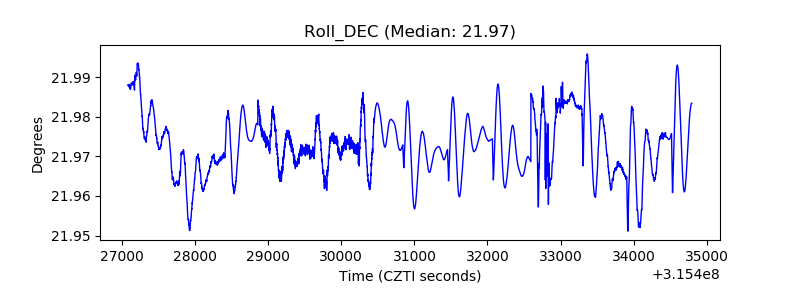 |
| _Roll_RA | 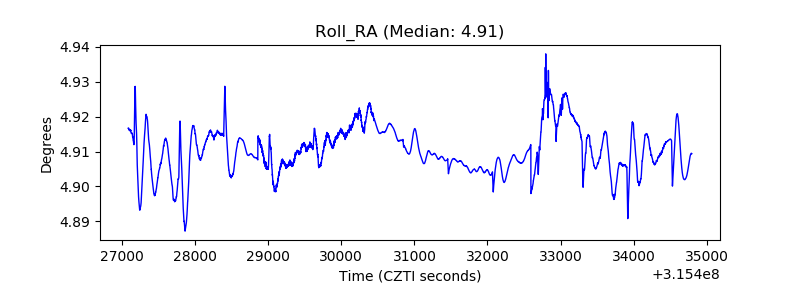 |
| Veto Counter | 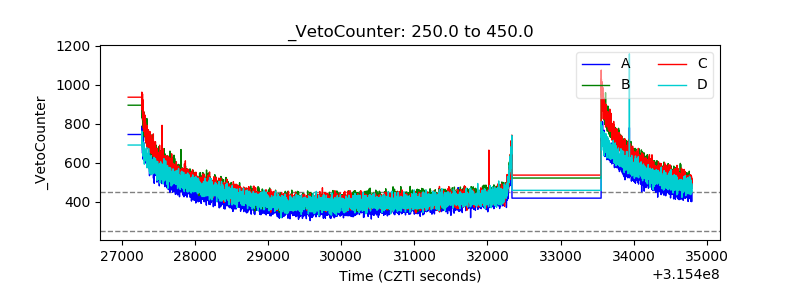 |