| Param | Original file | Final file |
|---|---|---|
| Filename | modeM0/AS1A08_004T03_9000003400_23015cztM0_level2.evt | modeM0/AS1A08_004T03_9000003400_23015cztM0_level2_quad_clean.evt |
| Size (bytes) | 2,102,791,680 | 339,226,560 |
| Size | 2.0 GB | 323.5 MB |
| Events in quadrant A | 12,919,015 | 2,158,734 |
| Events in quadrant B | 13,636,915 | 2,186,706 |
| Events in quadrant C | 14,968,996 | 2,067,086 |
| Events in quadrant D | 20,314,608 | 1,982,147 |
| Mode M0 | |||
|---|---|---|---|
| Quadrant | BADHDUFLAG | Total packets | Discarded packets |
| A | 0 | 56504 | 5 |
| B | 0 | 58160 | 5 |
| C | 0 | 62399 | 5 |
| D | 0 | 78706 | 5 |
| Mode SS | |||
|---|---|---|---|
| Quadrant | BADHDUFLAG | Total packets | Discarded packets |
| A | 0 | 556 | 0 |
| B | 0 | 556 | 0 |
| C | 0 | 556 | 0 |
| D | 0 | 556 | 0 |
| Mode M9 | |||
|---|---|---|---|
| Quadrant | BADHDUFLAG | Total packets | Discarded packets |
| A | 0 | 46 | 0 |
| B | 0 | 46 | 0 |
| C | 0 | 46 | 0 |
| D | 0 | 46 | 0 |
| Quadrant | Total seconds | Saturated seconds | Saturation percentage |
|---|---|---|---|
| A | 27333 | 177 | 0.647569% |
| B | 27334 | 375 | 1.371918% |
| C | 27334 | 851 | 3.113339% |
| D | 27334 | 1543 | 5.644984% |
Noise dominated data is calculated using 1-second bins in cleaned event files. If a bin has >2000 counts, and if more than 50% of those come from <1% of pixels, then it is considered to be noise-dominated and hence unusable.
| Quadrant | # 1 sec bins | Bins with >0 counts | Bins with >2000 counts | High rate bins dominated by noise | Noise dominated (total time) | Noise dominated (detector-on time) | Marked lightcurve |
|---|---|---|---|---|---|---|---|
| A | 31873 | 27338 | 1 | 1 | 0.00% | 0.00% | 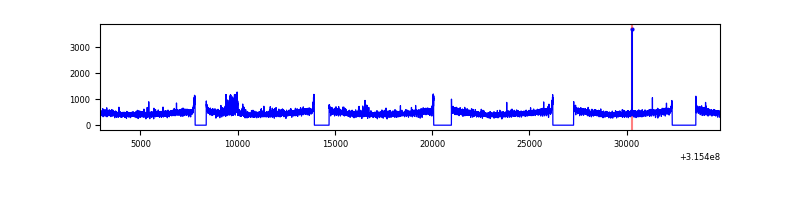 |
| B | 31874 | 27339 | 110 | 110 | 0.35% | 0.40% | 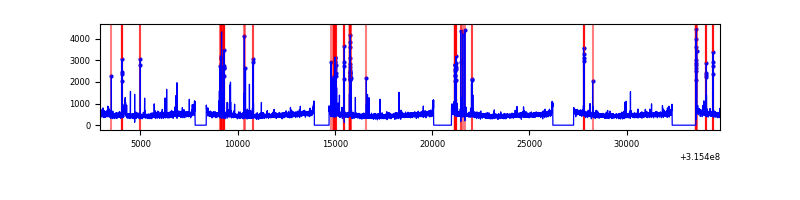 |
| C | 31874 | 27338 | 296 | 296 | 0.93% | 1.08% | 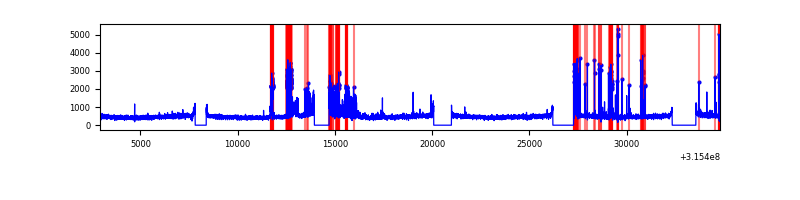 |
| D | 31874 | 27339 | 1114 | 1114 | 3.50% | 4.07% | 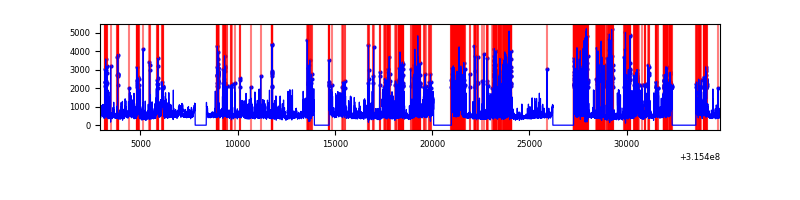 |
Top three noisy pixels from each quadrant. If the there are fewer than three noisy pixels in the level2.evt file, extra rows are filled as -1
| Pixel properties | Quadrant properties | ||||||
|---|---|---|---|---|---|---|---|
| Quadrant | DetID | PixID | Counts | Sigma | Mean | Median | Sigma |
| A | 11 | 47 | 228040 | 341.21 | 3293 | 3217 | 658.9 |
| A | 13 | 254 | 37183 | 51.55 | 3293 | 3217 | 658.9 |
| A | 3 | 137 | 29216 | 39.46 | 3293 | 3217 | 658.9 |
| B | 4 | 216 | 473910 | 757.15 | 3279 | 3190 | 621.7 |
| B | 0 | 189 | 101087 | 157.47 | 3279 | 3190 | 621.7 |
| B | 5 | 172 | 85627 | 132.6 | 3279 | 3190 | 621.7 |
| C | 9 | 15 | 1693259 | 2304.14 | 3150 | 3169 | 733.5 |
| C | 14 | 238 | 499027 | 676.02 | 3150 | 3169 | 733.5 |
| C | 10 | 9 | 447423 | 605.66 | 3150 | 3169 | 733.5 |
| D | 1 | 52 | 4877145 | 6350.56 | 3156 | 3069 | 767.5 |
| D | 12 | 227 | 1171313 | 1522.14 | 3156 | 3069 | 767.5 |
| D | 13 | 153 | 955439 | 1240.87 | 3156 | 3069 | 767.5 |
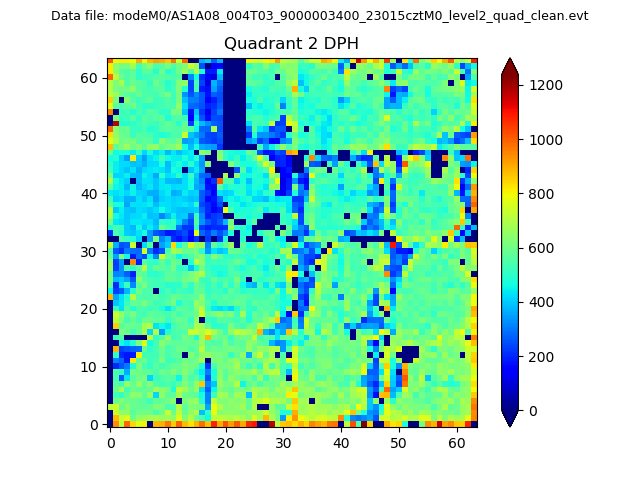
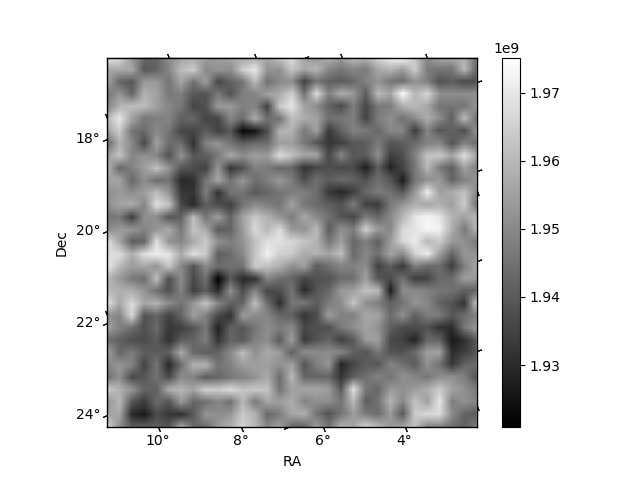
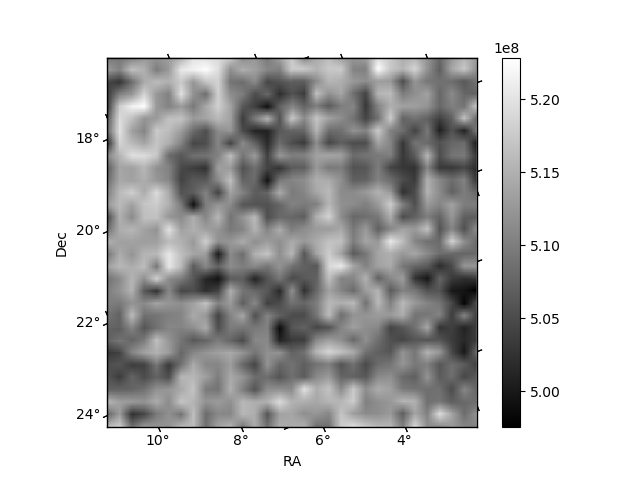
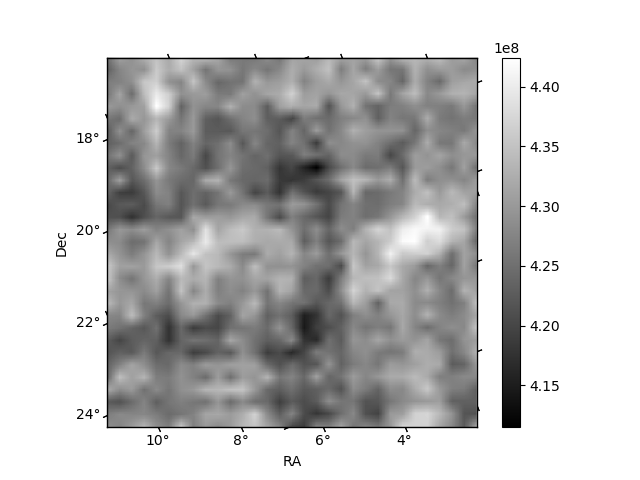
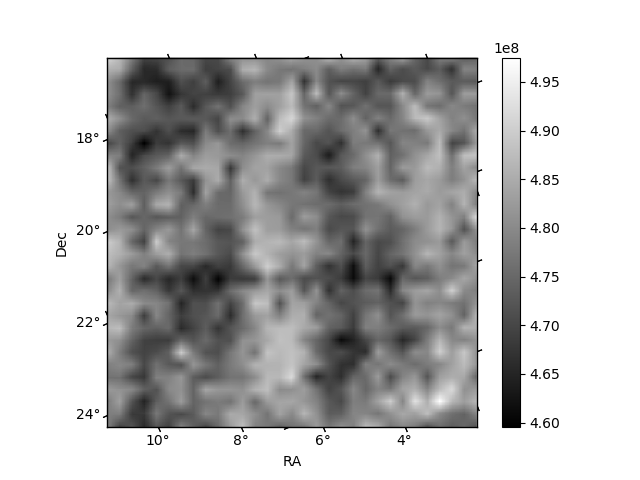
Histogram calculated using DETX and DETY for each event in the final _common_clean file
| Quadrant A | 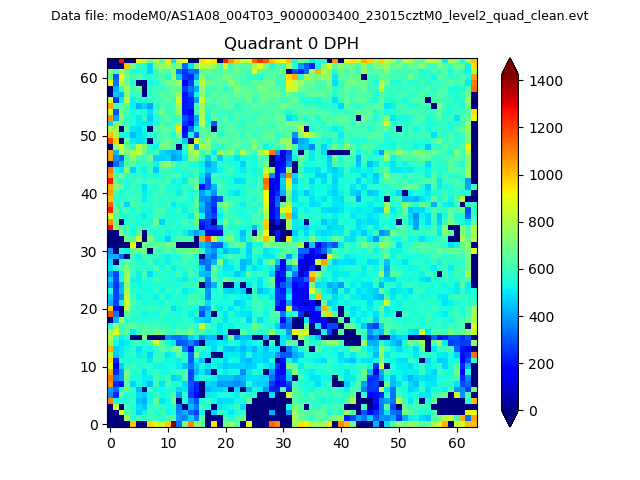 |
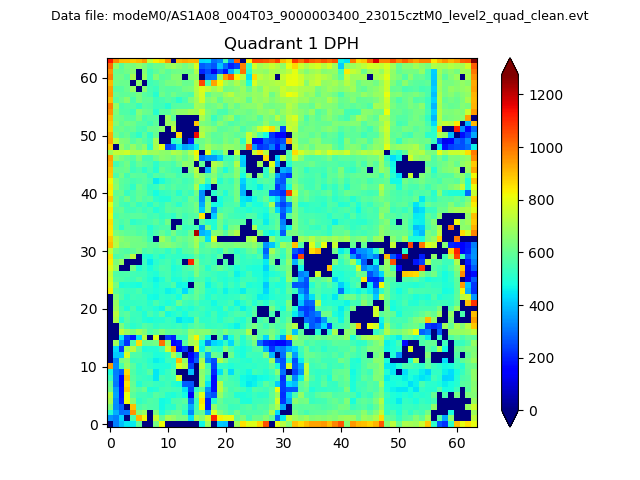 |
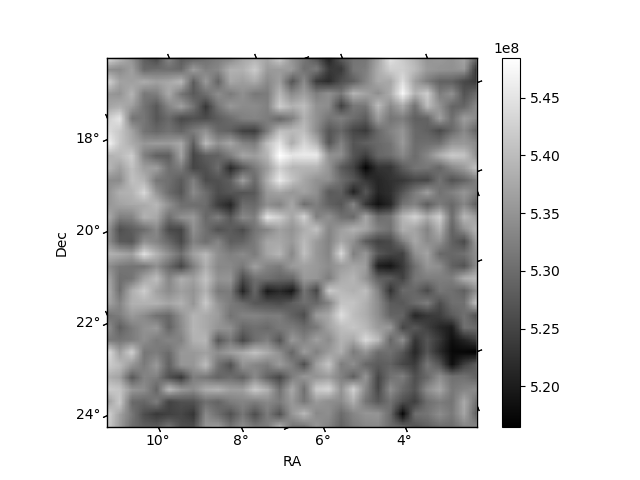
Quadrant B |
|---|---|---|---|
| Quadrant D | 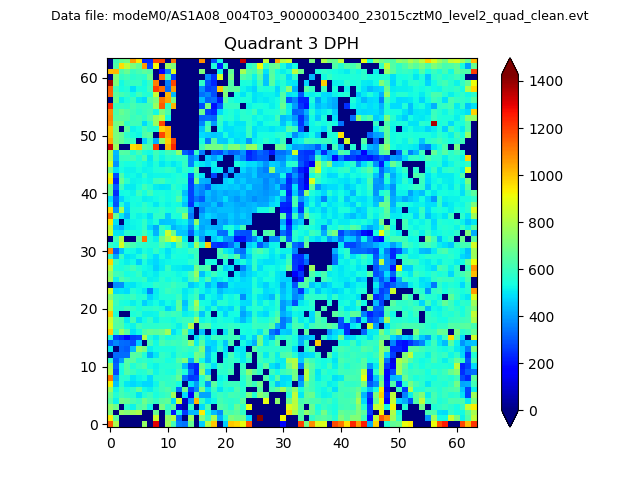 |
 |
Quadrant C |
| Plot type | Count rate plots | Images |
|---|---|---|
| Comparison with Poisson distribution Blue bars denote a histogram of data divided into 1 sec bins. Red curve is a Poisson curve with rate = median count rate of data. |
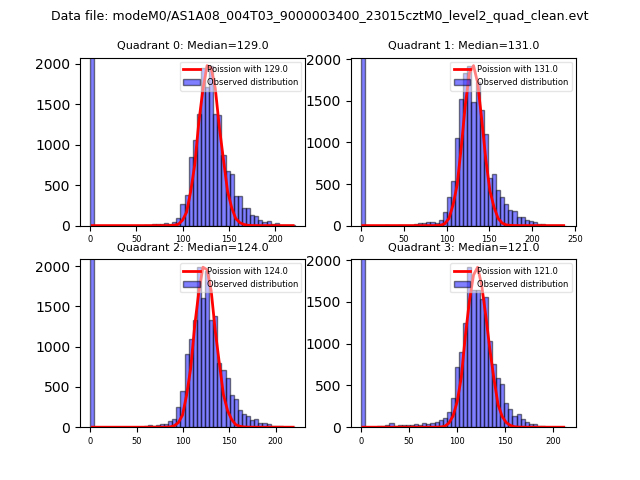 |
 |
| Quadrant-wise count rates Data is divided into 100 sec bins |
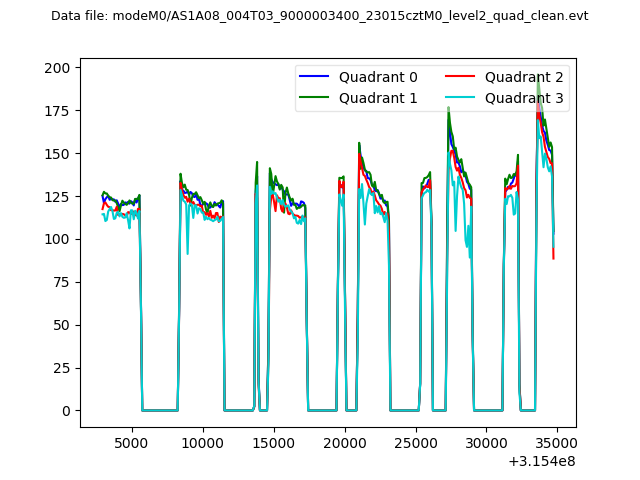 |
|
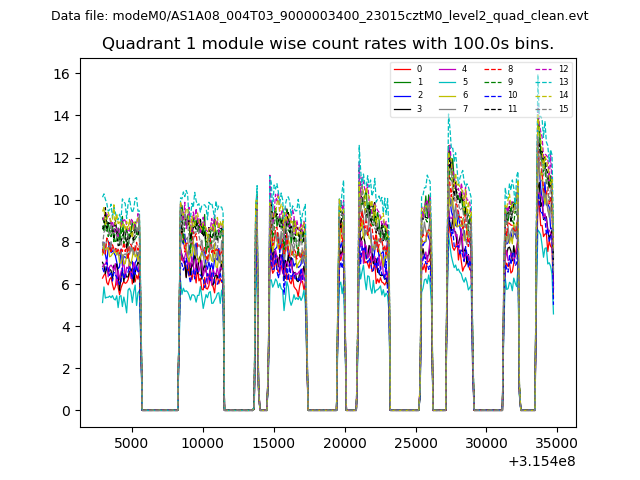
| Module-wise count rates for Quadrant A Data is divided into 100 sec bins |
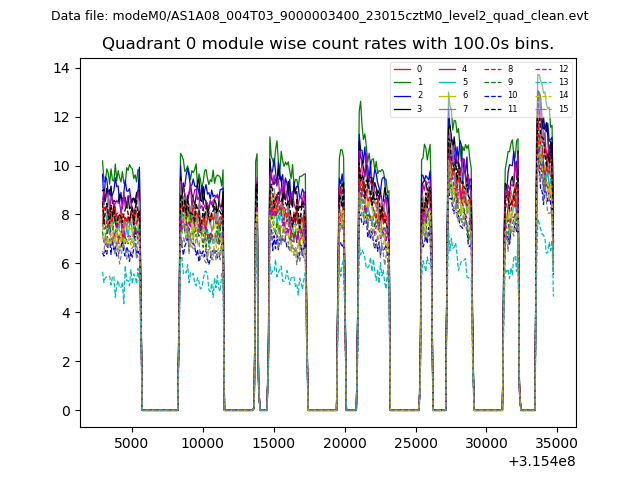 |
 |
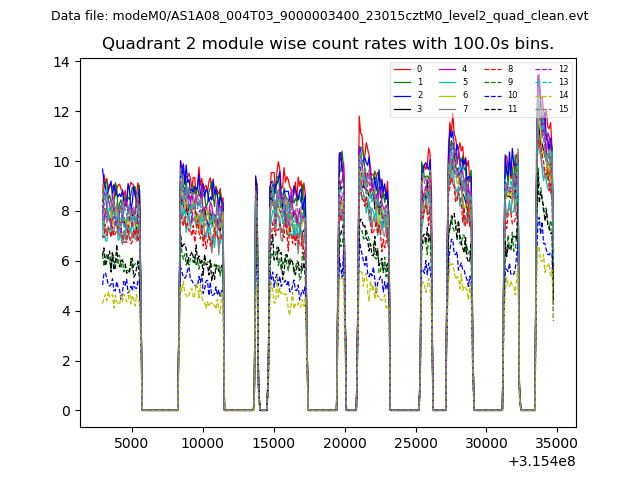
| Module-wise count rates for Quadrant B Data is divided into 100 sec bins |
 |
 |
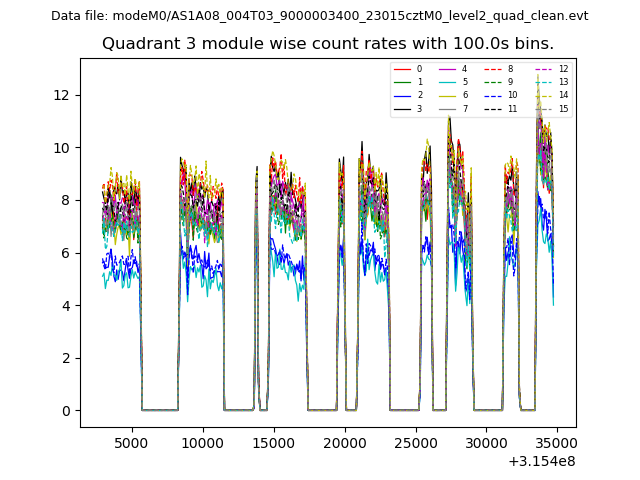
| Module-wise count rates for Quadrant C Data is divided into 100 sec bins |
 |
 |
| Module-wise count rates for Quadrant D Data is divided into 100 sec bins |
 |
 |
| Parameter | Plot |
|---|---|
| CZT HV Monitor | 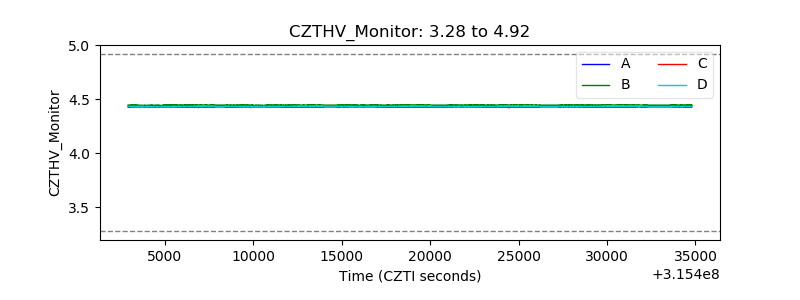 |
| D_VDD | 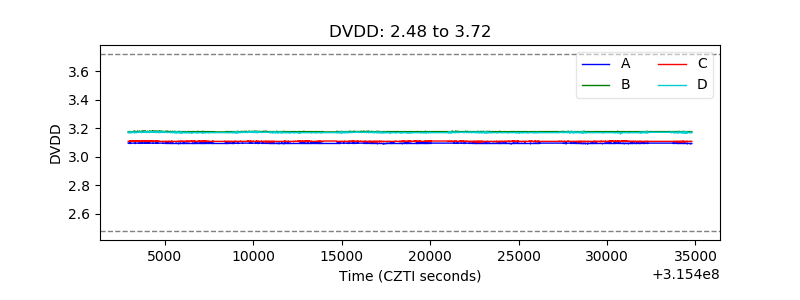 |
| Temperature 1 | 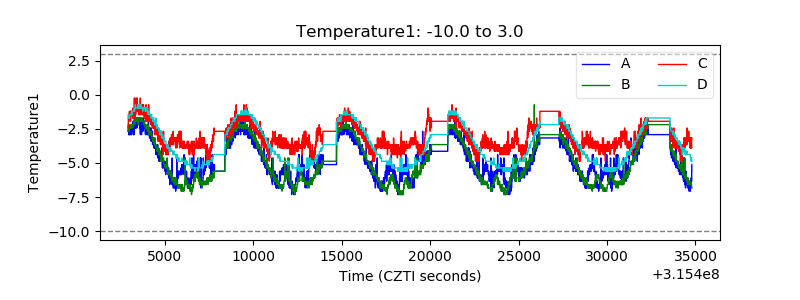 |
| Veto HV Monitor | 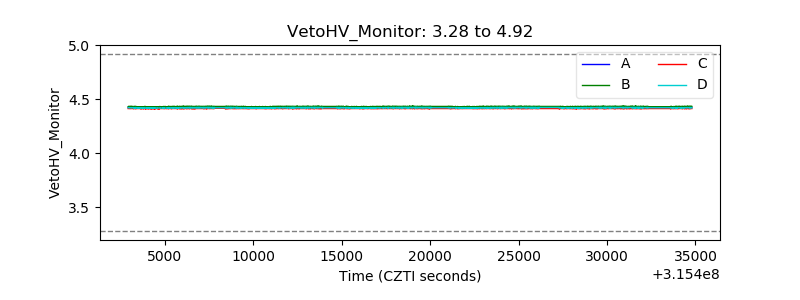 |
| Veto LLD | 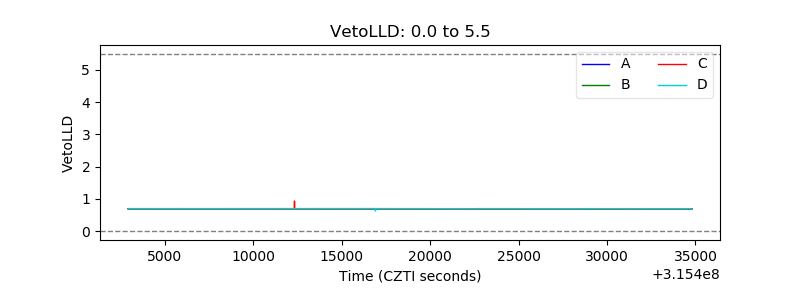 |
| Alpha Counter | 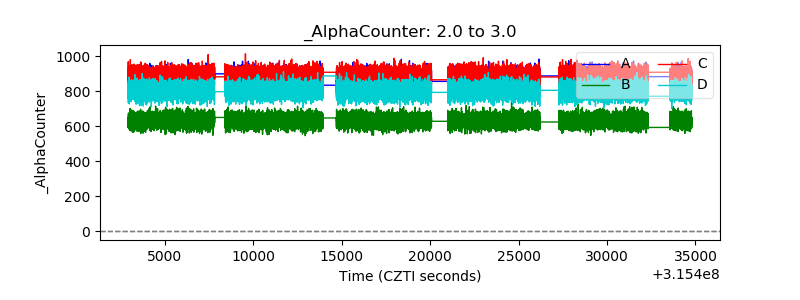 |
| _CPM_Rate | 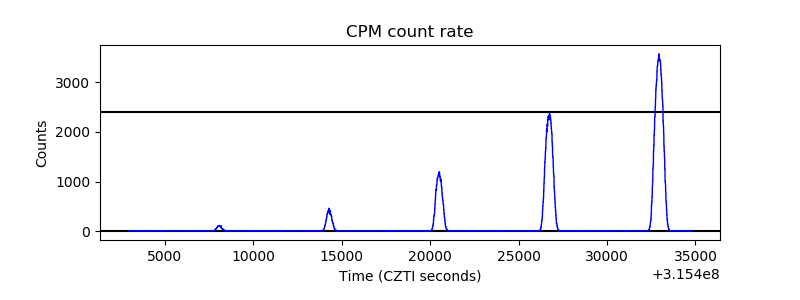 |
| CZT Counter | 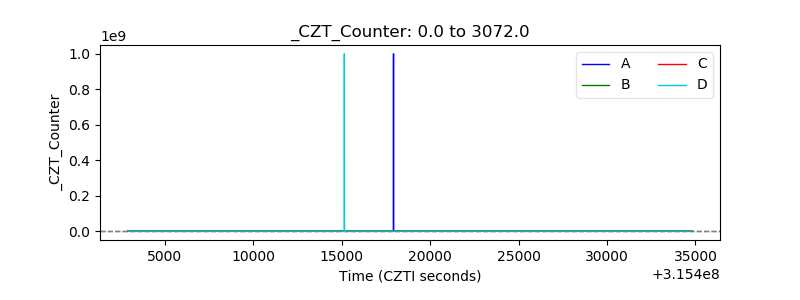 |
| +2.5 Volts monitor |  |
| +5 Volts monitor |  |
| _ROLL_ROT | 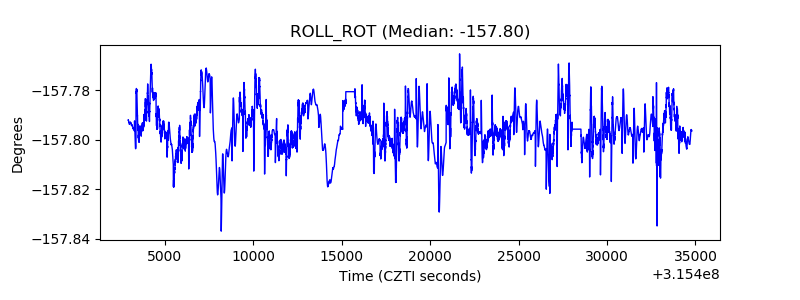 |
| _Roll_DEC | 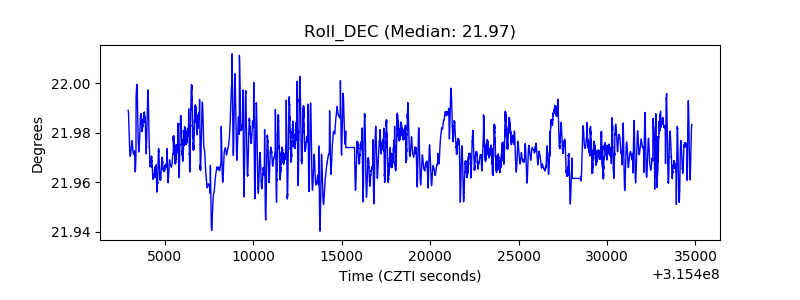 |
| _Roll_RA | 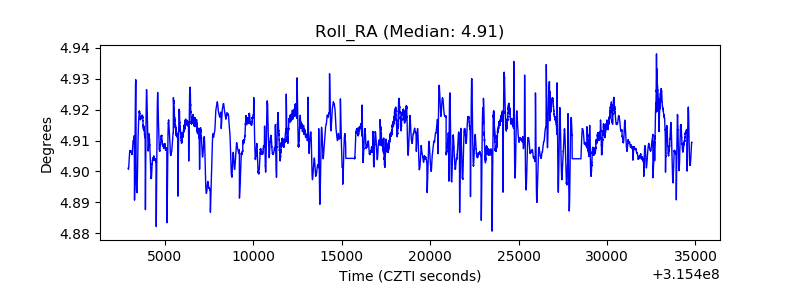 |
| Veto Counter | 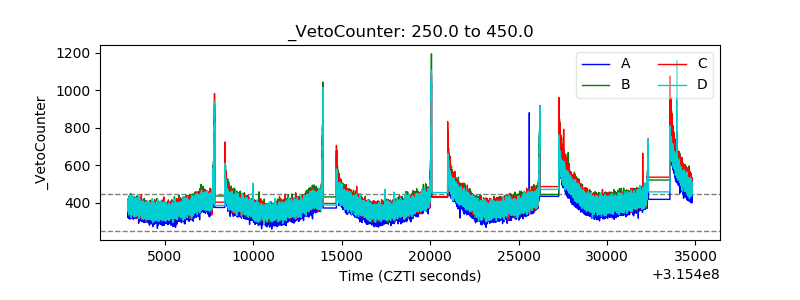 |