| Param | Original file | Final file |
|---|---|---|
| Filename | modeM0/AS1C05_013T01_9000003398_22988cztM0_level2.evt | modeM0/AS1C05_013T01_9000003398_22988cztM0_level2_quad_clean.evt |
| Size (bytes) | 101,563,200 | 28,785,600 |
| Size | 96.9 MB | 27.5 MB |
| Events in quadrant A | 672,142 | 191,307 |
| Events in quadrant B | 688,246 | 196,590 |
| Events in quadrant C | 683,644 | 190,533 |
| Events in quadrant D | 928,726 | 183,502 |
| Mode M9 | |||
|---|---|---|---|
| Quadrant | BADHDUFLAG | Total packets | Discarded packets |
| A | 0 | 1 | 0 |
| B | 0 | 1 | 0 |
| C | 0 | 1 | 0 |
| D | 0 | 1 | 0 |
| Mode M0 | |||
|---|---|---|---|
| Quadrant | BADHDUFLAG | Total packets | Discarded packets |
| A | 0 | 3017 | 1 |
| B | 0 | 3036 | 1 |
| C | 0 | 3031 | 1 |
| D | 0 | 3789 | 1 |
| Mode SS | |||
|---|---|---|---|
| Quadrant | BADHDUFLAG | Total packets | Discarded packets |
| A | 0 | 30 | 0 |
| B | 0 | 30 | 0 |
| C | 0 | 30 | 0 |
| D | 0 | 30 | 0 |
| Quadrant | Total seconds | Saturated seconds | Saturation percentage |
|---|---|---|---|
| A | 1470 | 14 | 0.952381% |
| B | 1470 | 22 | 1.496599% |
| C | 1470 | 24 | 1.632653% |
| D | 1470 | 55 | 3.741497% |
Noise dominated data is calculated using 1-second bins in cleaned event files. If a bin has >2000 counts, and if more than 50% of those come from <1% of pixels, then it is considered to be noise-dominated and hence unusable.
| Quadrant | # 1 sec bins | Bins with >0 counts | Bins with >2000 counts | High rate bins dominated by noise | Noise dominated (total time) | Noise dominated (detector-on time) | Marked lightcurve |
|---|---|---|---|---|---|---|---|
| A | 1470 | 1470 | 0 | 0 | 0.00% | 0.00% | 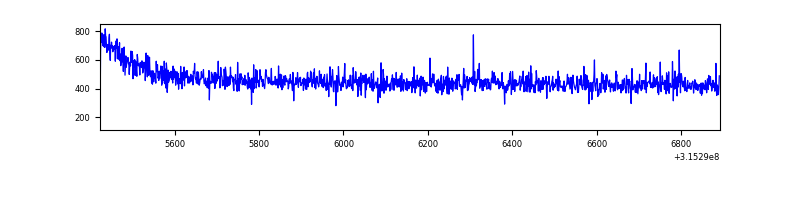 |
| B | 1470 | 1470 | 0 | 0 | 0.00% | 0.00% | 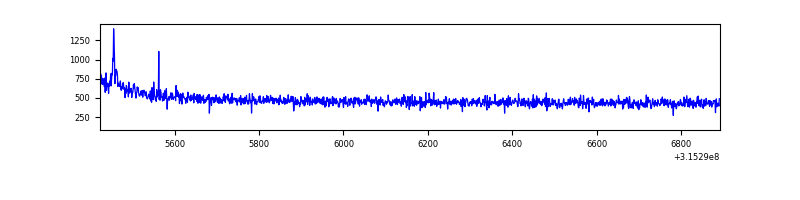 |
| C | 1470 | 1470 | 0 | 0 | 0.00% | 0.00% |  |
| D | 1470 | 1470 | 32 | 32 | 2.18% | 2.18% | 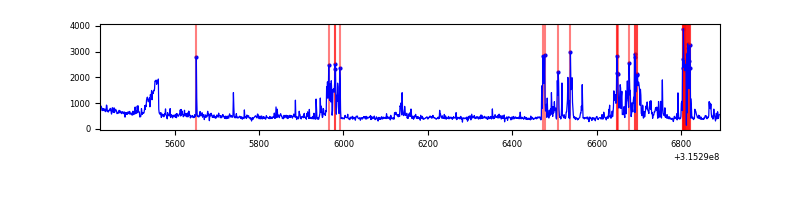 |
Top three noisy pixels from each quadrant. If the there are fewer than three noisy pixels in the level2.evt file, extra rows are filled as -1
| Pixel properties | Quadrant properties | ||||||
|---|---|---|---|---|---|---|---|
| Quadrant | DetID | PixID | Counts | Sigma | Mean | Median | Sigma |
| A | 13 | 254 | 2188 | 54.79 | 173 | 170 | 36.8 |
| A | 0 | 226 | 1511 | 36.41 | 173 | 170 | 36.8 |
| A | 3 | 137 | 1451 | 34.78 | 173 | 170 | 36.8 |
| B | 5 | 172 | 5790 | 160.53 | 174 | 169 | 35.0 |
| B | 12 | 111 | 4059 | 111.09 | 174 | 169 | 35.0 |
| B | 11 | 111 | 3593 | 97.79 | 174 | 169 | 35.0 |
| C | 14 | 238 | 26637 | 655.44 | 165 | 165 | 40.4 |
| C | 0 | 10 | 10565 | 257.5 | 165 | 165 | 40.4 |
| C | 13 | 61 | 1135 | 24.02 | 165 | 165 | 40.4 |
| D | 13 | 104 | 184290 | 4422.19 | 163 | 157 | 41.6 |
| D | 1 | 239 | 38947 | 931.59 | 163 | 157 | 41.6 |
| D | 1 | 52 | 34172 | 816.91 | 163 | 157 | 41.6 |
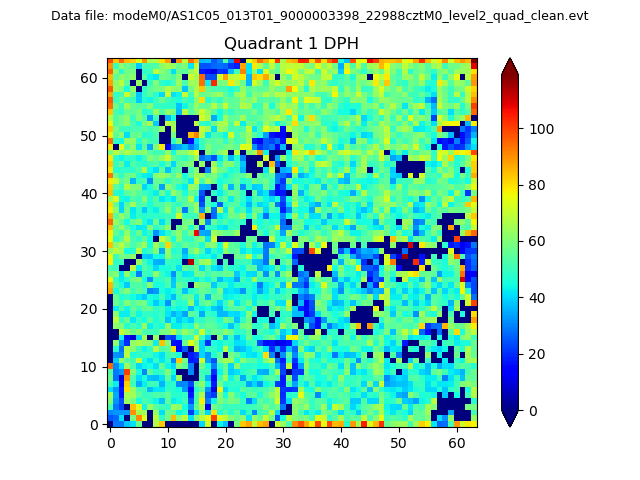
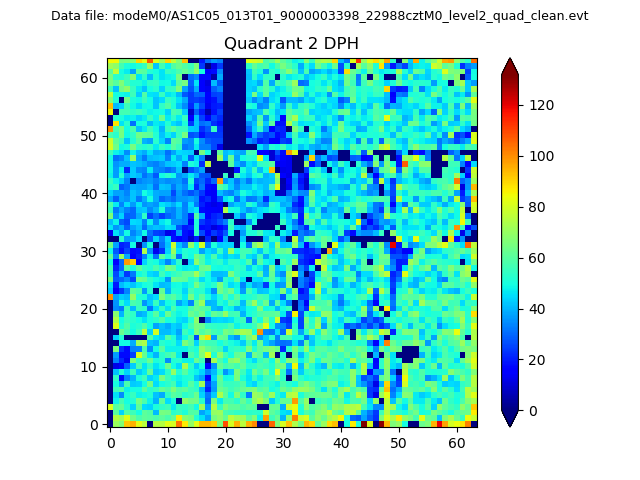
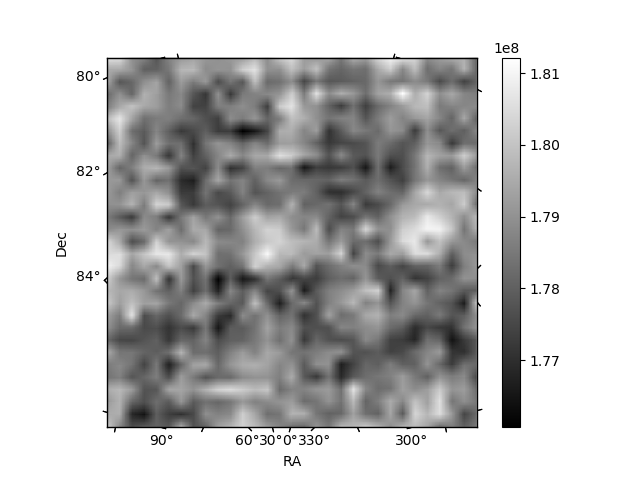
Histogram calculated using DETX and DETY for each event in the final _common_clean file
| Quadrant A | 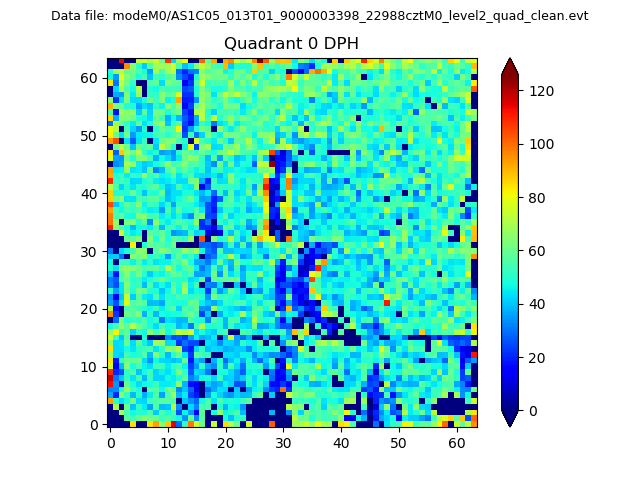 |
 |
Quadrant B |
|---|---|---|---|
| Quadrant D | 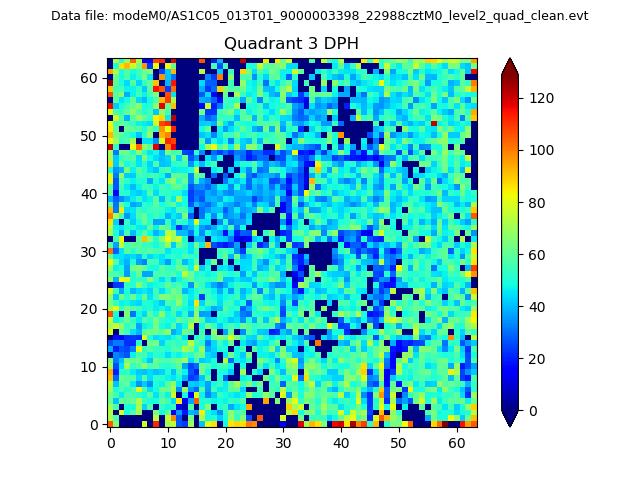 |
 |
Quadrant C |
| Plot type | Count rate plots | Images |
|---|---|---|
| Comparison with Poisson distribution Blue bars denote a histogram of data divided into 1 sec bins. Red curve is a Poisson curve with rate = median count rate of data. |
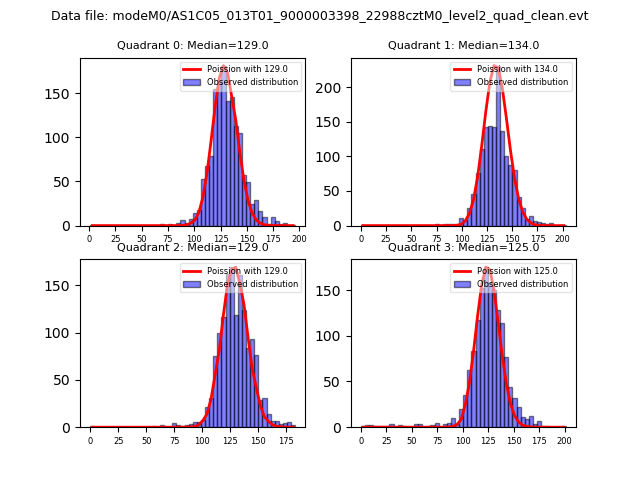 |
 |
| Quadrant-wise count rates Data is divided into 100 sec bins |
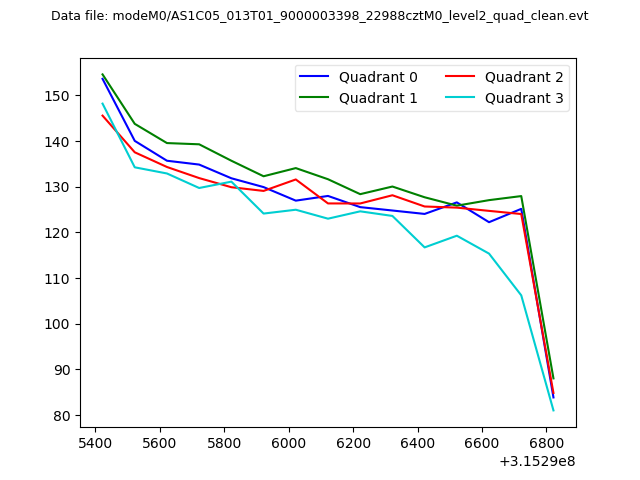 |
|
| Module-wise count rates for Quadrant A Data is divided into 100 sec bins |
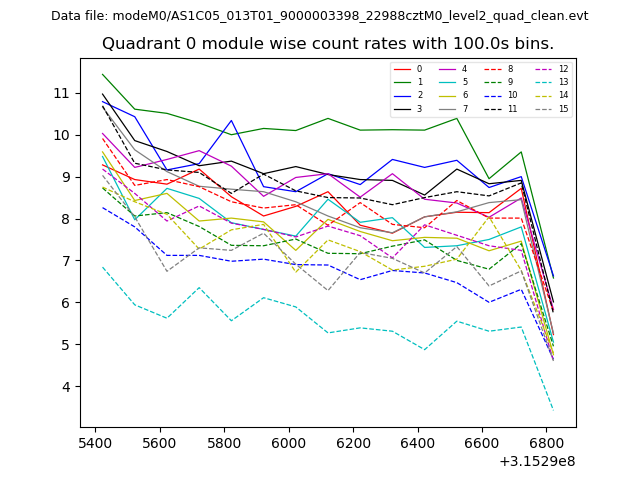 |
 |
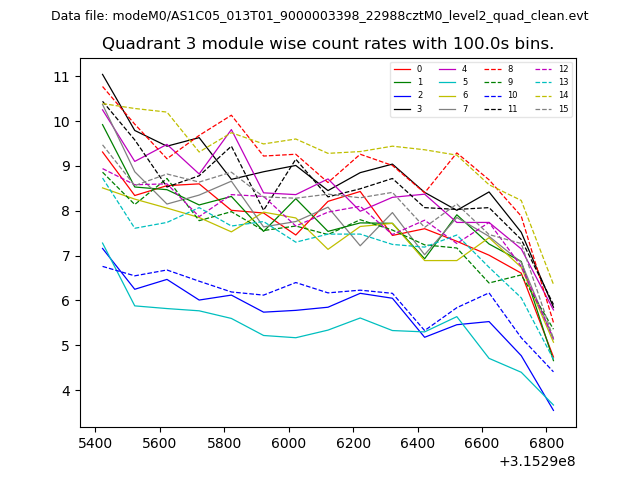
| Module-wise count rates for Quadrant B Data is divided into 100 sec bins |
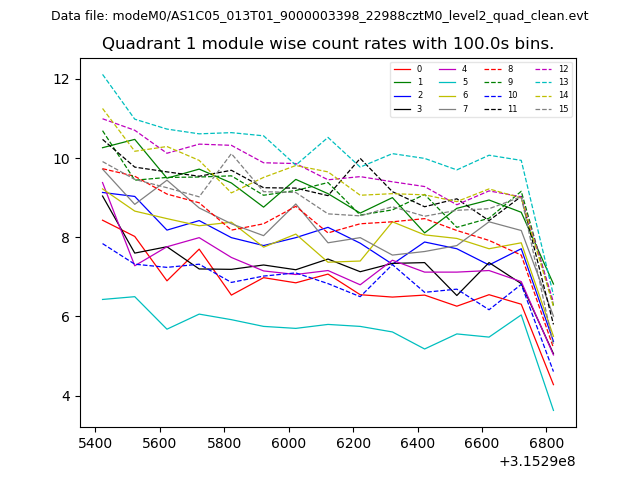 |
 |
| Module-wise count rates for Quadrant C Data is divided into 100 sec bins |
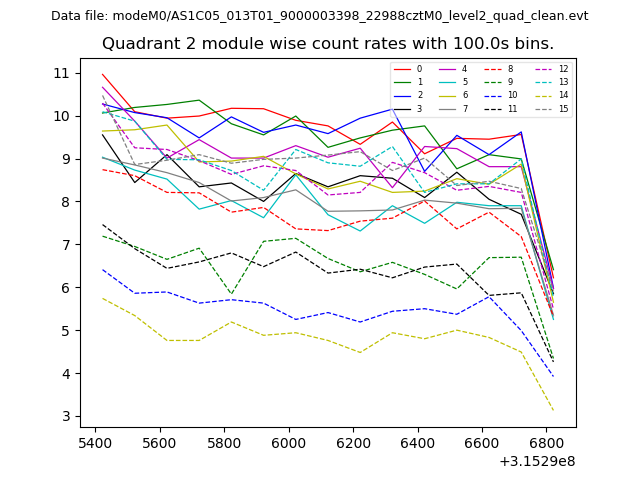 |
 |
| Module-wise count rates for Quadrant D Data is divided into 100 sec bins |
 |
 |
| Parameter | Plot |
|---|---|
| CZT HV Monitor | 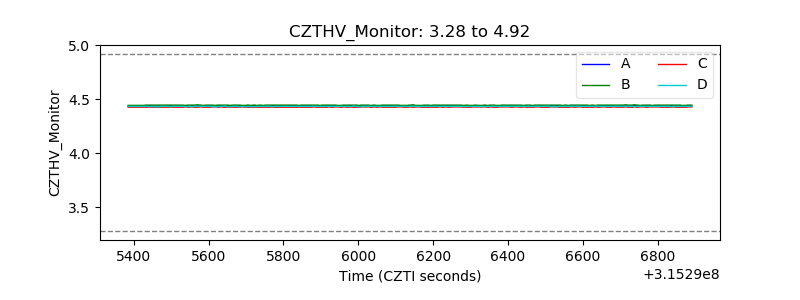 |
| D_VDD | 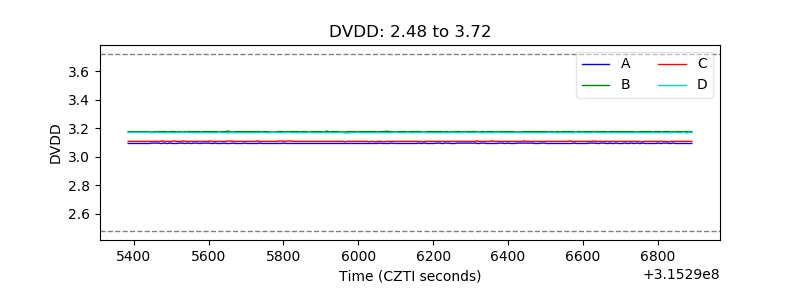 |
| Temperature 1 | 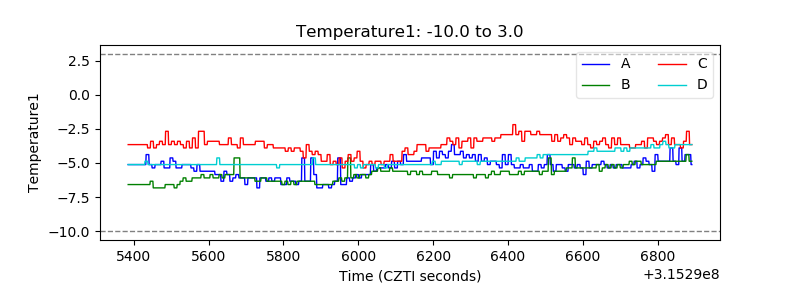 |
| Veto HV Monitor | 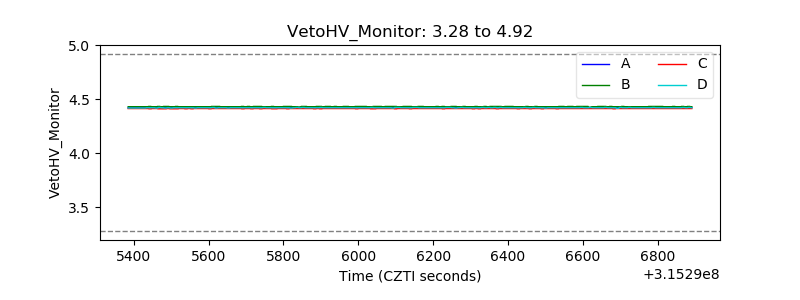 |
| Veto LLD | 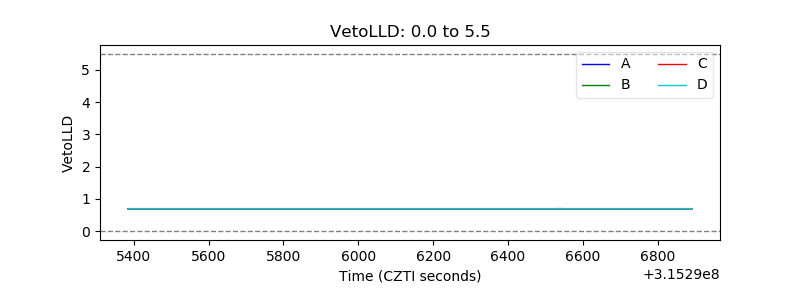 |
| Alpha Counter | 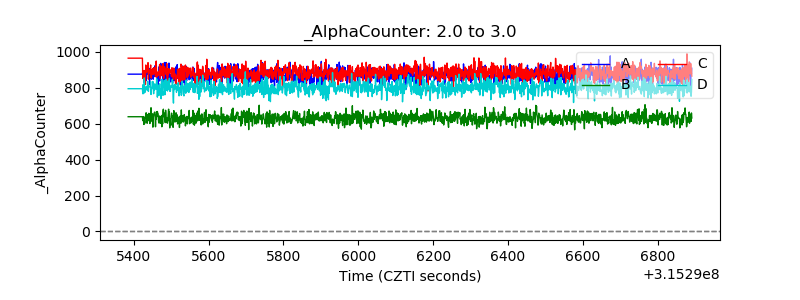 |
| _CPM_Rate | 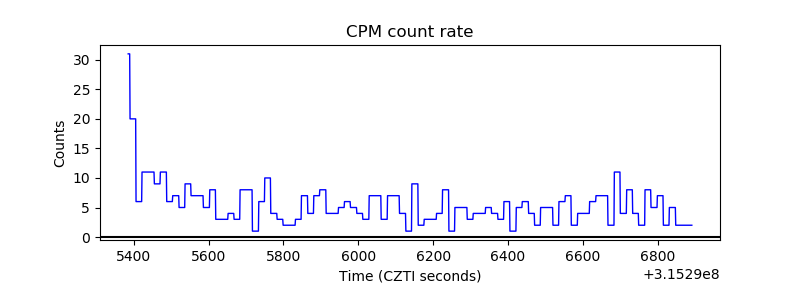 |
| CZT Counter | 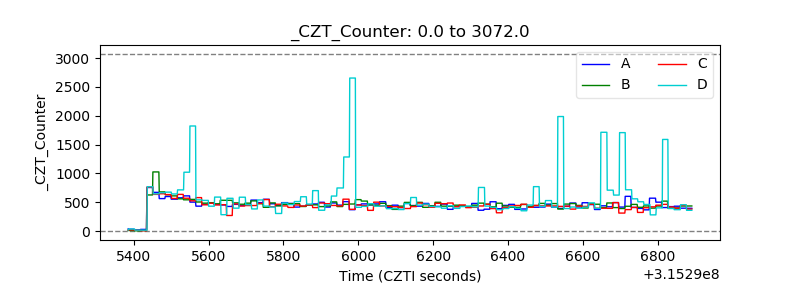 |
| +2.5 Volts monitor |  |
| +5 Volts monitor | 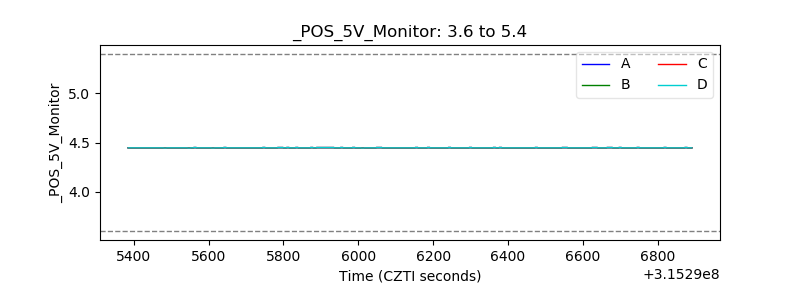 |
| _ROLL_ROT | 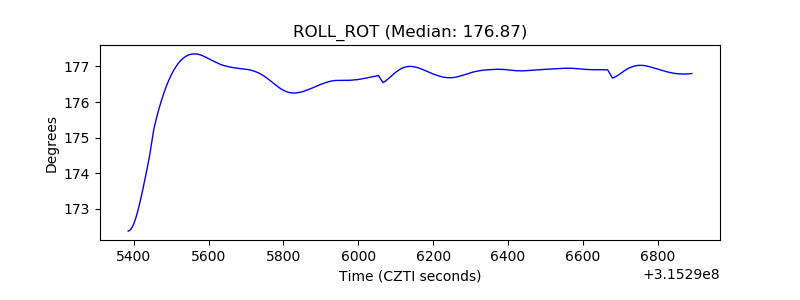 |
| _Roll_DEC | 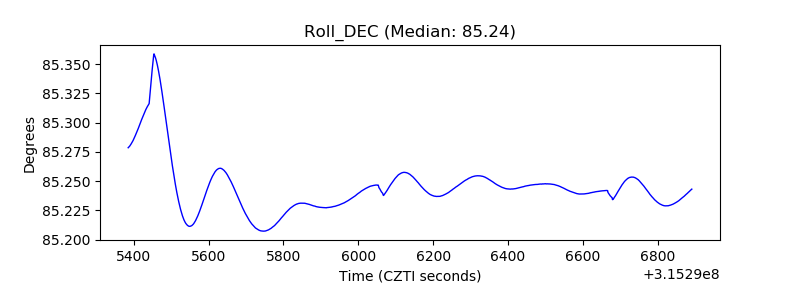 |
| _Roll_RA | 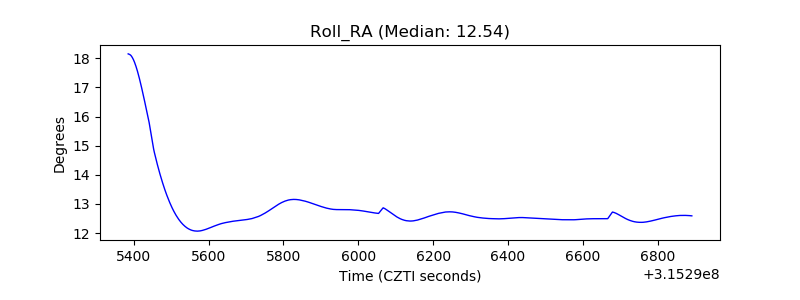 |
| Veto Counter | 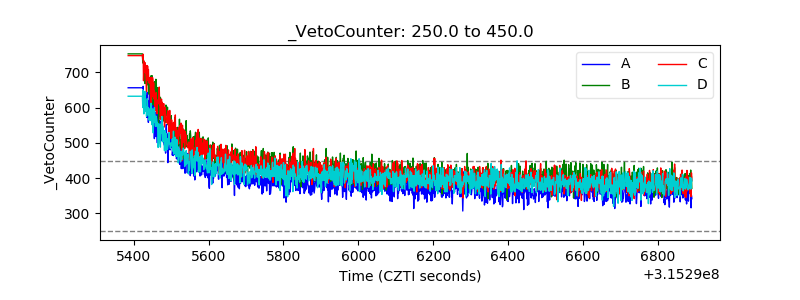 |