| Param | Original file | Final file |
|---|---|---|
| Filename | modeM0/AS1C05_013T01_9000003398_22990cztM0_level2.evt | modeM0/AS1C05_013T01_9000003398_22990cztM0_level2_quad_clean.evt |
| Size (bytes) | 285,782,400 | 79,816,320 |
| Size | 272.5 MB | 76.1 MB |
| Events in quadrant A | 1,881,491 | 541,063 |
| Events in quadrant B | 2,011,539 | 546,775 |
| Events in quadrant C | 1,901,409 | 521,372 |
| Events in quadrant D | 2,565,408 | 503,701 |
| Mode M0 | |||
|---|---|---|---|
| Quadrant | BADHDUFLAG | Total packets | Discarded packets |
| A | 0 | 8665 | 0 |
| B | 0 | 8853 | 0 |
| C | 0 | 8666 | 0 |
| D | 0 | 10727 | 0 |
| Mode SS | |||
|---|---|---|---|
| Quadrant | BADHDUFLAG | Total packets | Discarded packets |
| A | 0 | 86 | 0 |
| B | 0 | 86 | 0 |
| C | 0 | 86 | 0 |
| D | 0 | 86 | 0 |
| Quadrant | Total seconds | Saturated seconds | Saturation percentage |
|---|---|---|---|
| A | 4324 | 2 | 0.046253% |
| B | 4324 | 4 | 0.092507% |
| C | 4324 | 8 | 0.185014% |
| D | 4324 | 102 | 2.358927% |
Noise dominated data is calculated using 1-second bins in cleaned event files. If a bin has >2000 counts, and if more than 50% of those come from <1% of pixels, then it is considered to be noise-dominated and hence unusable.
| Quadrant | # 1 sec bins | Bins with >0 counts | Bins with >2000 counts | High rate bins dominated by noise | Noise dominated (total time) | Noise dominated (detector-on time) | Marked lightcurve |
|---|---|---|---|---|---|---|---|
| A | 4324 | 4324 | 0 | 0 | 0.00% | 0.00% | 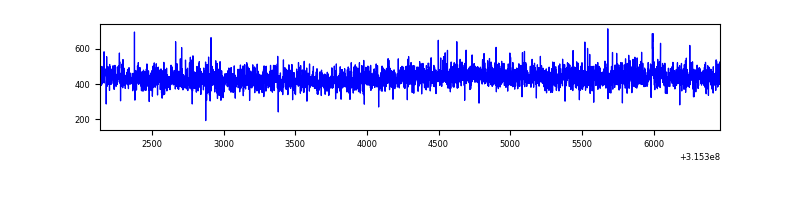 |
| B | 4324 | 4324 | 3 | 3 | 0.07% | 0.07% | 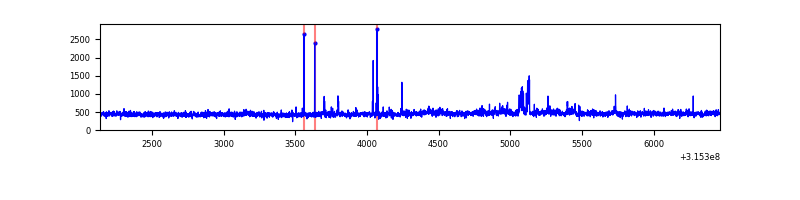 |
| C | 4324 | 4324 | 0 | 0 | 0.00% | 0.00% | 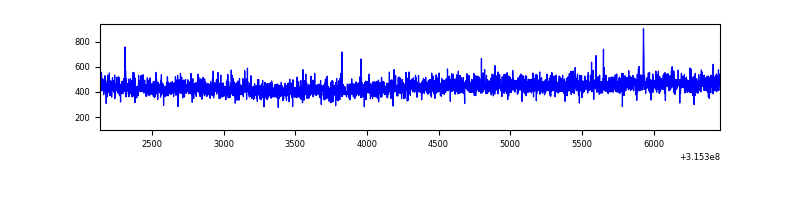 |
| D | 4324 | 4324 | 83 | 83 | 1.92% | 1.92% | 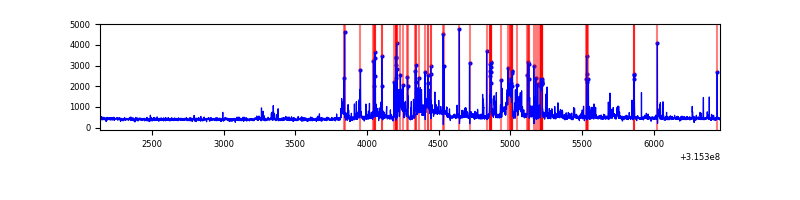 |
Top three noisy pixels from each quadrant. If the there are fewer than three noisy pixels in the level2.evt file, extra rows are filled as -1
| Pixel properties | Quadrant properties | ||||||
|---|---|---|---|---|---|---|---|
| Quadrant | DetID | PixID | Counts | Sigma | Mean | Median | Sigma |
| A | 13 | 254 | 6979 | 65.72 | 486 | 477 | 98.9 |
| A | 0 | 226 | 4279 | 38.43 | 486 | 477 | 98.9 |
| A | 3 | 137 | 4044 | 36.05 | 486 | 477 | 98.9 |
| B | 0 | 190 | 48225 | 521.3 | 484 | 474 | 91.6 |
| B | 0 | 189 | 46806 | 505.81 | 484 | 474 | 91.6 |
| B | 5 | 172 | 13113 | 137.98 | 484 | 474 | 91.6 |
| C | 14 | 238 | 75295 | 688.25 | 466 | 469 | 108.7 |
| C | 7 | 247 | 3639 | 29.16 | 466 | 469 | 108.7 |
| C | 13 | 61 | 3260 | 25.67 | 466 | 469 | 108.7 |
| D | 1 | 52 | 337710 | 2963.94 | 469 | 455 | 113.8 |
| D | 13 | 249 | 114200 | 999.64 | 469 | 455 | 113.8 |
| D | 13 | 153 | 105857 | 926.32 | 469 | 455 | 113.8 |
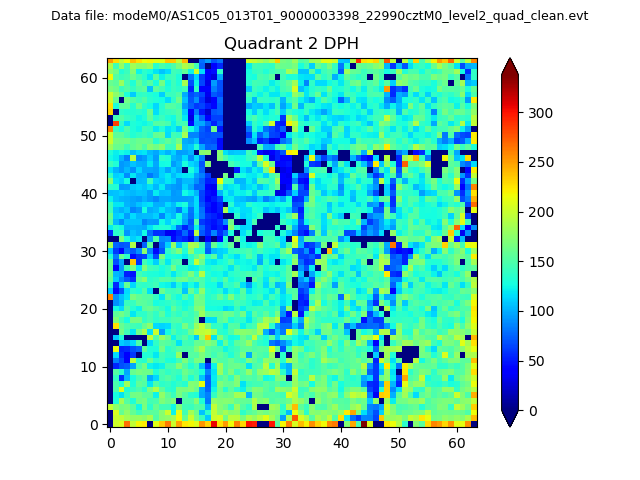
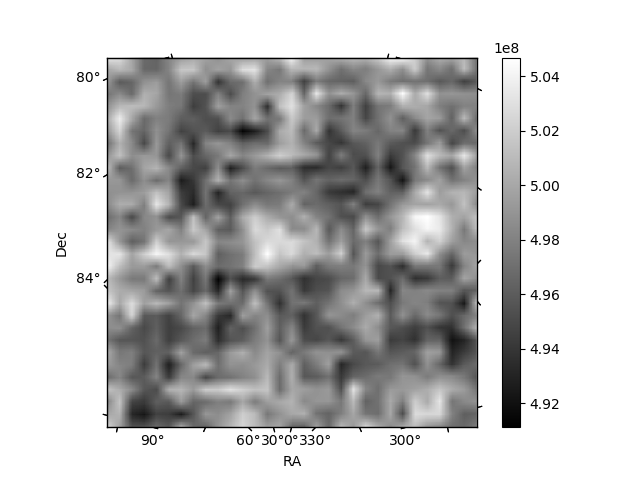
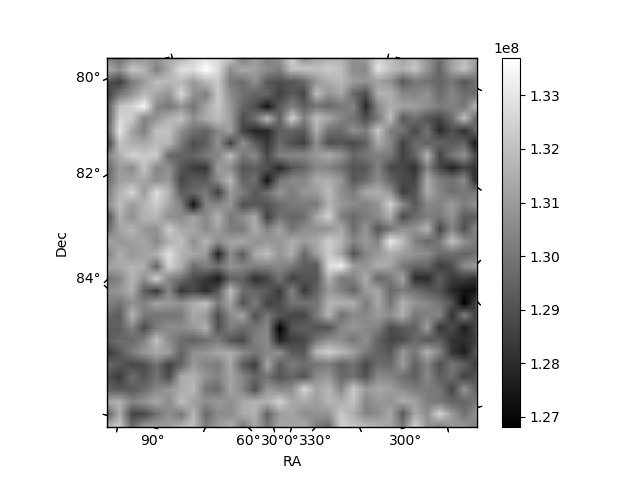
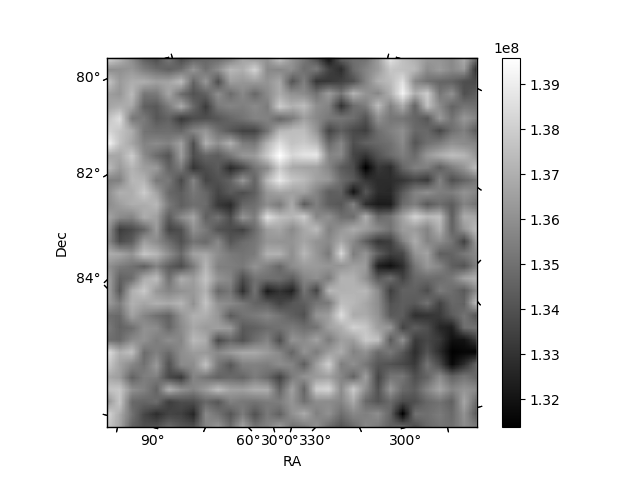
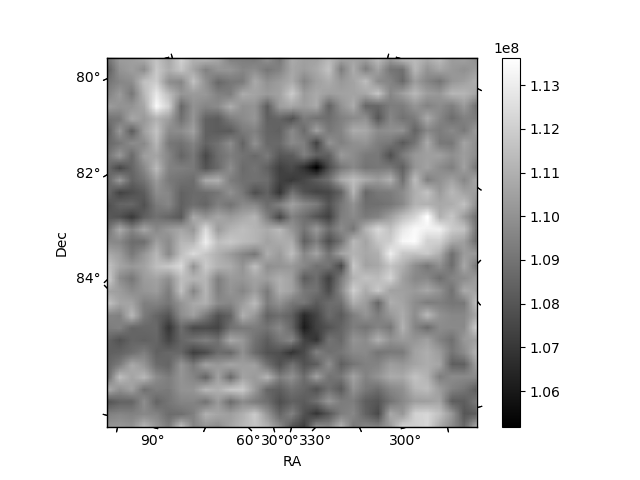
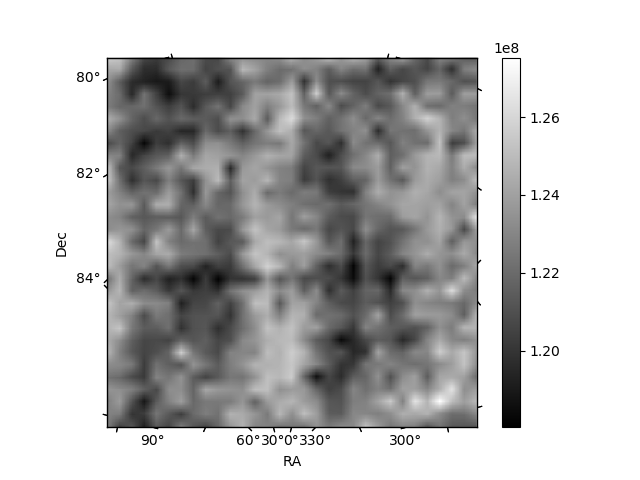
Histogram calculated using DETX and DETY for each event in the final _common_clean file
| Quadrant A | 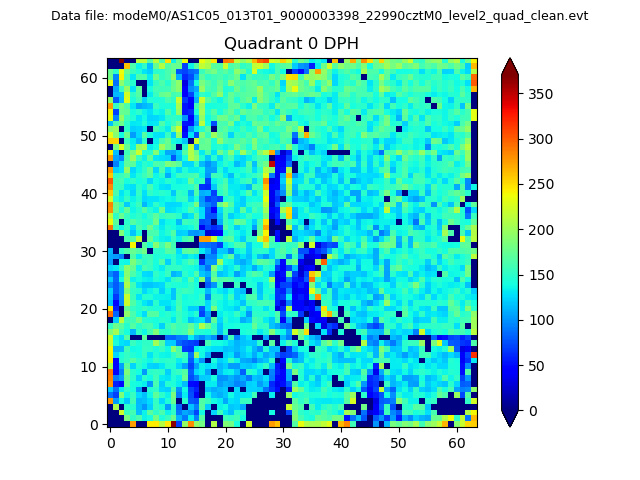 |
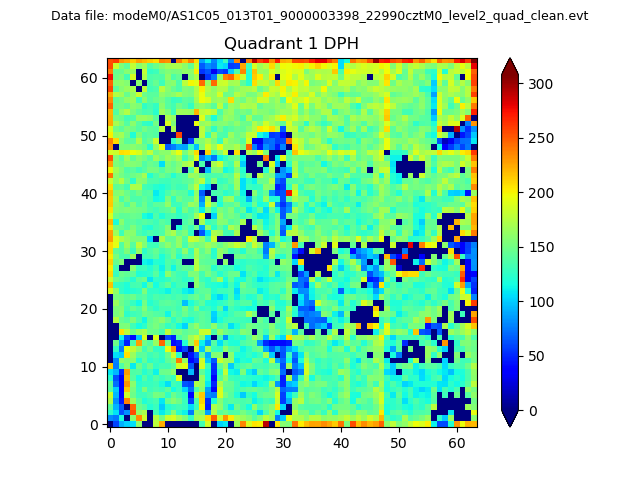 |
Quadrant B |
|---|---|---|---|
| Quadrant D | 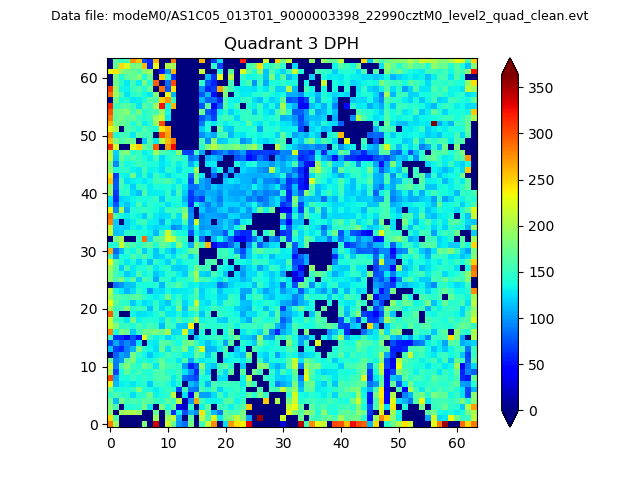 |
 |
Quadrant C |
| Plot type | Count rate plots | Images |
|---|---|---|
| Comparison with Poisson distribution Blue bars denote a histogram of data divided into 1 sec bins. Red curve is a Poisson curve with rate = median count rate of data. |
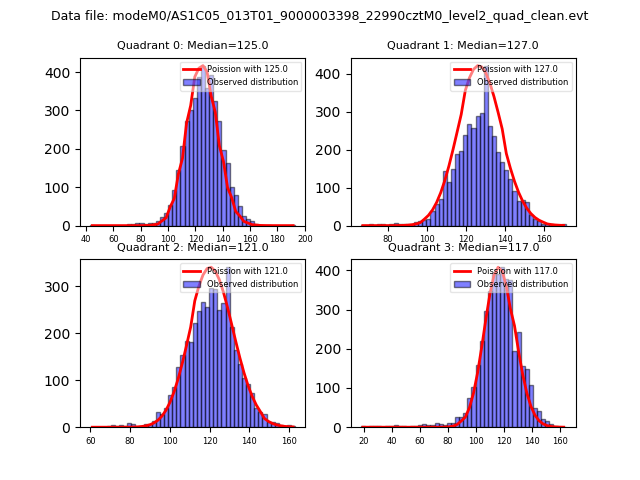 |
 |
| Quadrant-wise count rates Data is divided into 100 sec bins |
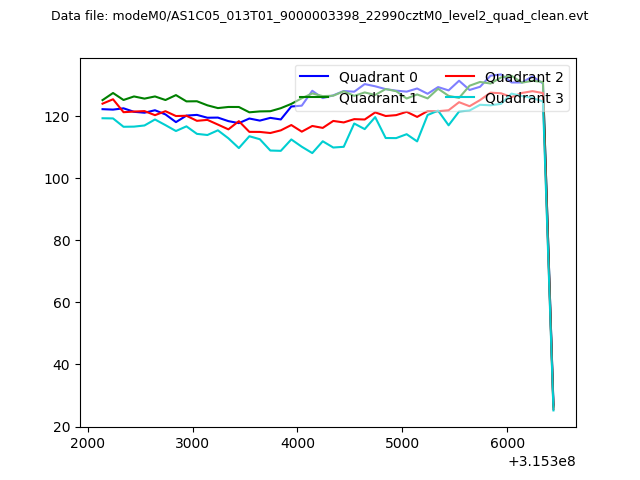 |
|
| Module-wise count rates for Quadrant A Data is divided into 100 sec bins |
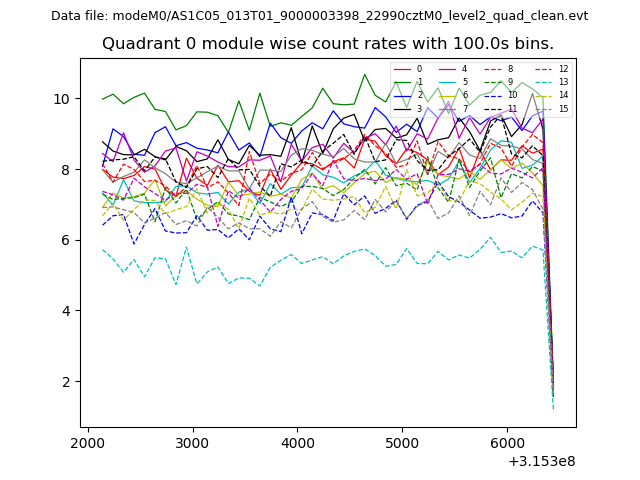 |
 |
| Module-wise count rates for Quadrant B Data is divided into 100 sec bins |
 |
 |
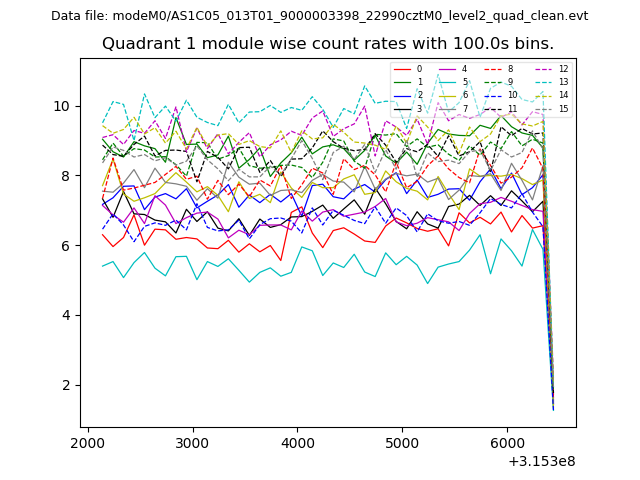
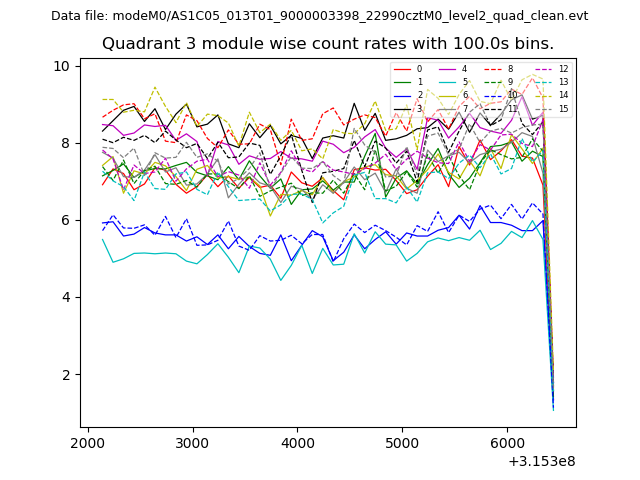
| Module-wise count rates for Quadrant C Data is divided into 100 sec bins |
 |
 |
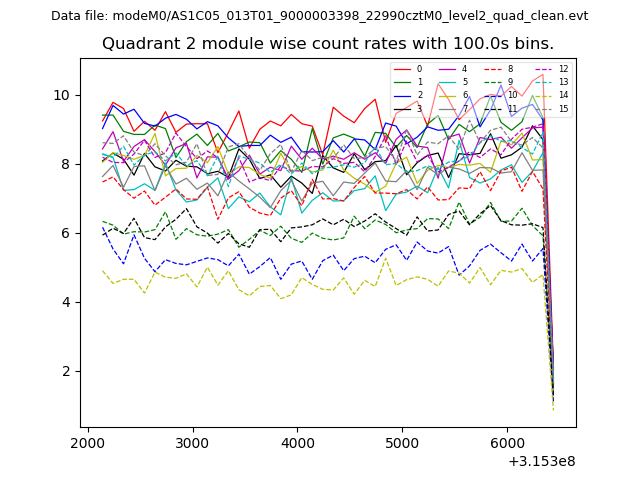
| Module-wise count rates for Quadrant D Data is divided into 100 sec bins |
 |
 |
| Parameter | Plot |
|---|---|
| CZT HV Monitor | 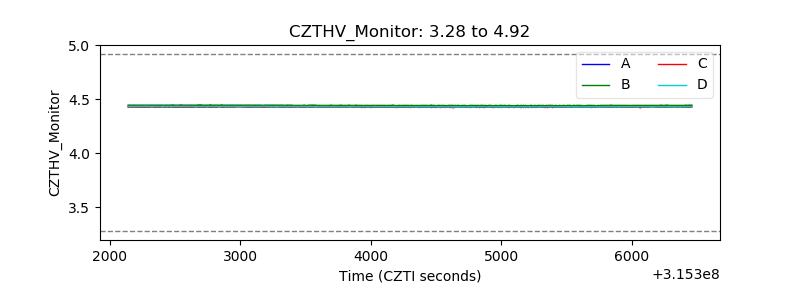 |
| D_VDD |  |
| Temperature 1 | 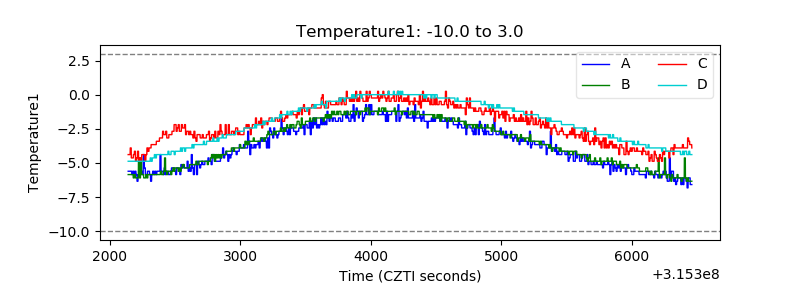 |
| Veto HV Monitor | 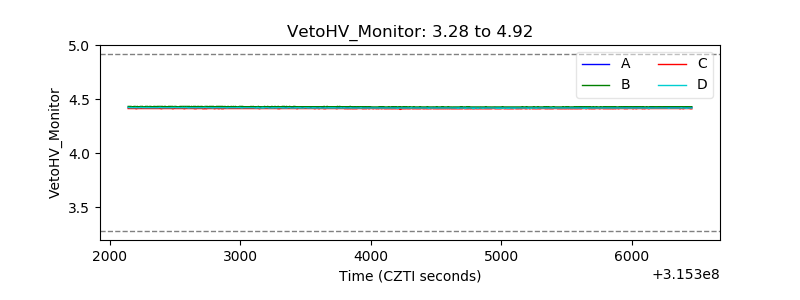 |
| Veto LLD | 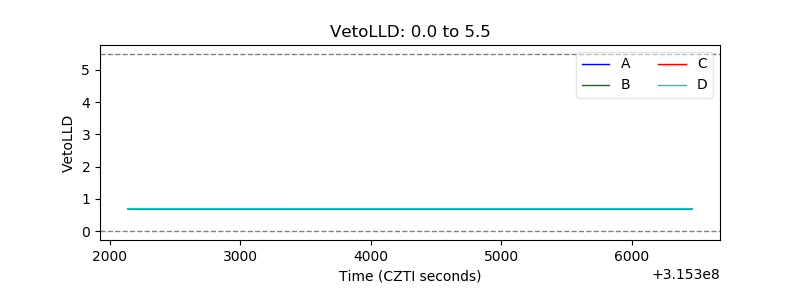 |
| Alpha Counter | 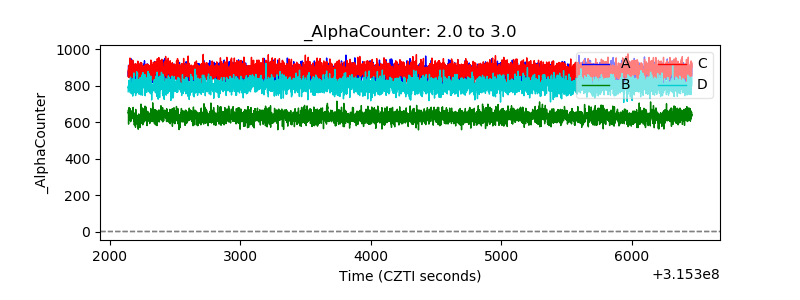 |
| _CPM_Rate | 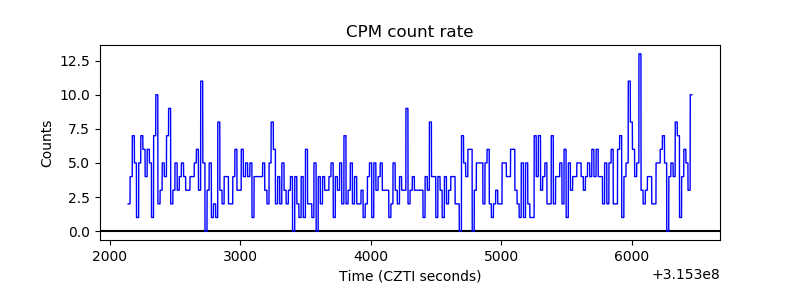 |
| CZT Counter | 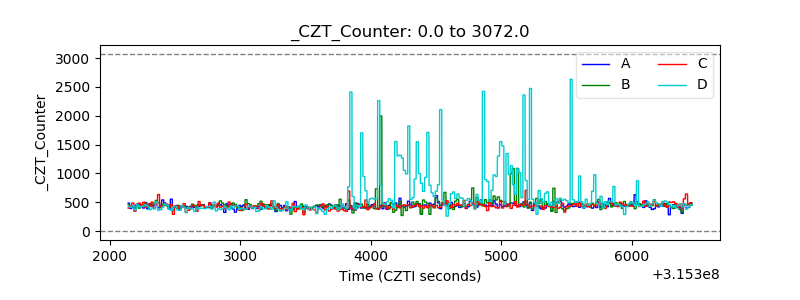 |
| +2.5 Volts monitor |  |
| +5 Volts monitor |  |
| _ROLL_ROT | 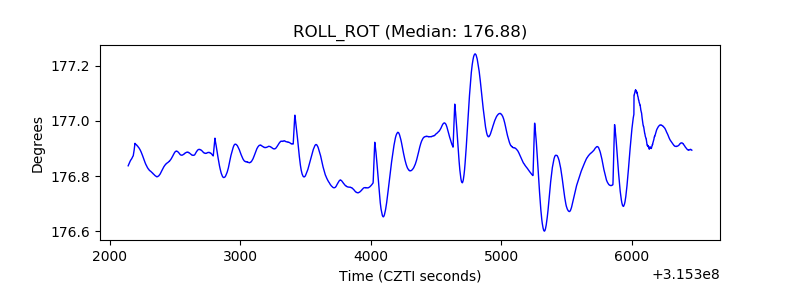 |
| _Roll_DEC | 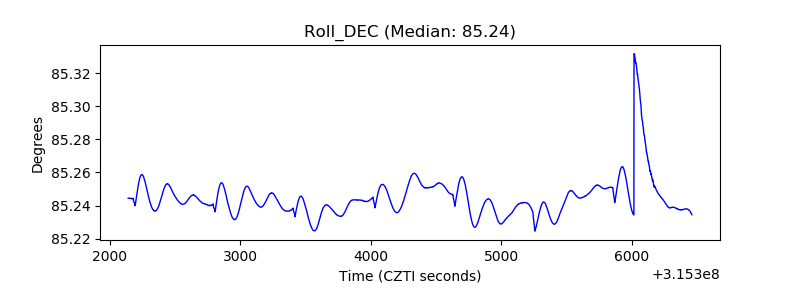 |
| _Roll_RA | 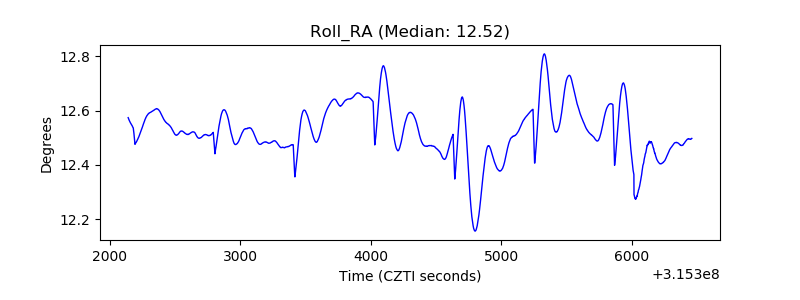 |
| Veto Counter | 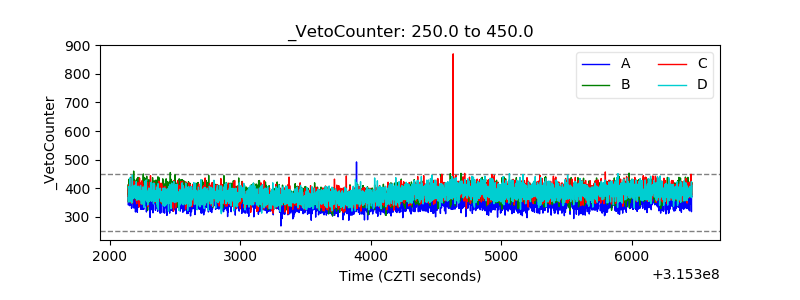 |