| Param | Original file | Final file |
|---|---|---|
| Filename | modeM0/AS1C05_002T02_9000003402cztM0_level2.fits | modeM0/AS1C05_002T02_9000003402cztM0_level2_quad_clean.evt |
| Size (bytes) | 94,544,640 | 51,376,320 |
| Size | 90.2 MB | 49.0 MB |
| Events in quadrant A | 603,282 | 242,807 |
| Events in quadrant B | 586,232 | 249,141 |
| Events in quadrant C | 591,292 | 235,146 |
| Events in quadrant D | 462,694 | 207,725 |
| Mode SS | |||
|---|---|---|---|
| Quadrant | BADHDUFLAG | Total packets | Discarded packets |
| A | 0 | 180 | 0 |
| B | 0 | 180 | 0 |
| C | 0 | 180 | 0 |
| D | 0 | 180 | 0 |
| Mode M0 | |||
|---|---|---|---|
| Quadrant | BADHDUFLAG | Total packets | Discarded packets |
| A | 0 | 19009 | 0 |
| B | 0 | 19309 | 0 |
| C | 0 | 19442 | 0 |
| D | 0 | 29450 | 0 |
| Mode M9 | |||
|---|---|---|---|
| Quadrant | BADHDUFLAG | Total packets | Discarded packets |
| A | 0 | 18 | 0 |
| B | 0 | 18 | 0 |
| C | 0 | 18 | 0 |
| D | 0 | 18 | 0 |
| Quadrant | Total seconds | Saturated seconds | Saturation percentage |
|---|---|---|---|
| A | 8929 | 24 | 0.268787% |
| B | 8931 | 48 | 0.537454% |
| C | 8932 | 117 | 1.309897% |
| D | 8930 | 1206 | 13.505039% |
Noise dominated data is calculated using 1-second bins in cleaned event files. If a bin has >2000 counts, and if more than 50% of those come from <1% of pixels, then it is considered to be noise-dominated and hence unusable.
| Quadrant | # 1 sec bins | Bins with >0 counts | Bins with >2000 counts | High rate bins dominated by noise | Noise dominated (total time) | Noise dominated (detector-on time) | Marked lightcurve |
|---|---|---|---|---|---|---|---|
| A | 11929 | 8937 | 0 | 0 | 0.00% | 0.00% |  |
| B | 11929 | 8941 | 0 | 0 | 0.00% | 0.00% |  |
| C | 11929 | 8938 | 0 | 0 | 0.00% | 0.00% |  |
| D | 11929 | 8792 | 0 | 0 | 0.00% | 0.00% |  |
Top three noisy pixels from each quadrant. If the there are fewer than three noisy pixels in the level2.evt file, extra rows are filled as -1
| Pixel properties | Quadrant properties | ||||||
|---|---|---|---|---|---|---|---|
| Quadrant | DetID | PixID | Counts | Sigma | Mean | Median | Sigma |
| A | 0 | 29 | 586 | 10.7 | 157 | 149 | 40.8 |
| A | 0 | 30 | 482 | 8.15 | 157 | 149 | 40.8 |
| A | 7 | 110 | 447 | 7.3 | 157 | 149 | 40.8 |
| B | 14 | 254 | 417 | 8.17 | 155 | 149 | 32.8 |
| B | 3 | 80 | 413 | 8.05 | 155 | 149 | 32.8 |
| B | 2 | 9 | 410 | 7.95 | 155 | 149 | 32.8 |
| C | 1 | 80 | 468 | 7.73 | 156 | 148 | 41.4 |
| C | 1 | 81 | 428 | 6.76 | 156 | 148 | 41.4 |
| C | 7 | 111 | 409 | 6.3 | 156 | 148 | 41.4 |
| D | 6 | 67 | 338 | 5.86 | 132 | 121 | 37.0 |
| D | 7 | 3 | 334 | 5.75 | 132 | 121 | 37.0 |
| D | 15 | 46 | 324 | 5.48 | 132 | 121 | 37.0 |
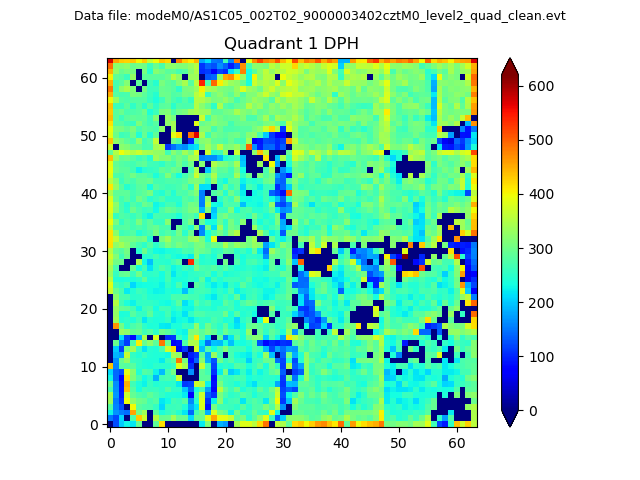
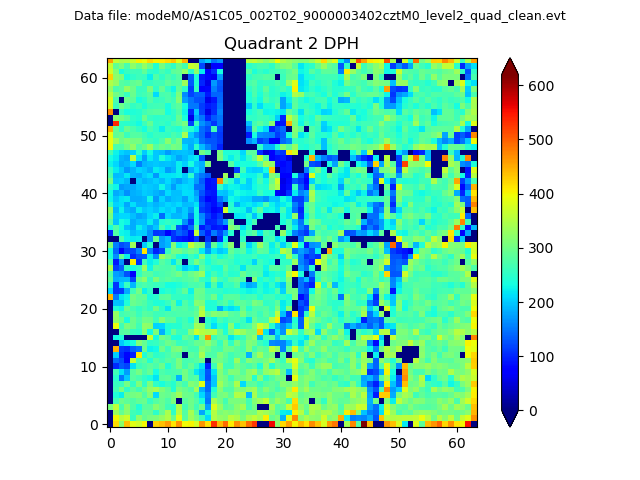
Histogram calculated using DETX and DETY for each event in the final _common_clean file
| Quadrant A |  |
 |
Quadrant B |
|---|---|---|---|
| Quadrant D |  |
 |
Quadrant C |
| Plot type | Count rate plots | Images |
|---|---|---|
| Comparison with Poisson distribution Blue bars denote a histogram of data divided into 1 sec bins. Red curve is a Poisson curve with rate = median count rate of data. |
 |
 |
| Quadrant-wise count rates Data is divided into 100 sec bins |
 |
|
| Module-wise count rates for Quadrant A Data is divided into 100 sec bins |
 |
 |
| Module-wise count rates for Quadrant B Data is divided into 100 sec bins |
 |
 |
| Module-wise count rates for Quadrant C Data is divided into 100 sec bins |
 |
 |
| Module-wise count rates for Quadrant D Data is divided into 100 sec bins |
 |
 |
| Parameter | Plot |
|---|---|
| CZT HV Monitor |  |
| D_VDD |  |
| Temperature 1 |  |
| Veto HV Monitor |  |
| Veto LLD |  |
| Alpha Counter |  |
| _CPM_Rate |  |
| CZT Counter |  |
| +2.5 Volts monitor |  |
| +5 Volts monitor |  |
| _ROLL_ROT |  |
| _Roll_DEC |  |
| _Roll_RA |  |
| Veto Counter |  |