| Param | Original file | Final file |
|---|---|---|
| Filename | modeM0/AS1C05_002T02_9000003402_23013cztM0_level2.evt | modeM0/AS1C05_002T02_9000003402_23013cztM0_level2_quad_clean.evt |
| Size (bytes) | 294,007,680 | 61,937,280 |
| Size | 280.4 MB | 59.1 MB |
| Events in quadrant A | 1,941,719 | 406,901 |
| Events in quadrant B | 1,999,128 | 421,165 |
| Events in quadrant C | 2,026,470 | 399,510 |
| Events in quadrant D | 2,680,644 | 382,670 |
| Mode SS | |||
|---|---|---|---|
| Quadrant | BADHDUFLAG | Total packets | Discarded packets |
| A | 0 | 76 | 0 |
| B | 0 | 76 | 0 |
| C | 0 | 76 | 0 |
| D | 0 | 76 | 0 |
| Mode M0 | |||
|---|---|---|---|
| Quadrant | BADHDUFLAG | Total packets | Discarded packets |
| A | 0 | 8294 | 1 |
| B | 0 | 8369 | 1 |
| C | 0 | 8482 | 1 |
| D | 0 | 10476 | 1 |
| Mode M9 | |||
|---|---|---|---|
| Quadrant | BADHDUFLAG | Total packets | Discarded packets |
| A | 0 | 14 | 0 |
| B | 0 | 14 | 0 |
| C | 0 | 14 | 0 |
| D | 0 | 14 | 0 |
| Quadrant | Total seconds | Saturated seconds | Saturation percentage |
|---|---|---|---|
| A | 3756 | 20 | 0.532481% |
| B | 3756 | 39 | 1.038339% |
| C | 3756 | 69 | 1.837061% |
| D | 3756 | 231 | 6.150160% |
Noise dominated data is calculated using 1-second bins in cleaned event files. If a bin has >2000 counts, and if more than 50% of those come from <1% of pixels, then it is considered to be noise-dominated and hence unusable.
| Quadrant | # 1 sec bins | Bins with >0 counts | Bins with >2000 counts | High rate bins dominated by noise | Noise dominated (total time) | Noise dominated (detector-on time) | Marked lightcurve |
|---|---|---|---|---|---|---|---|
| A | 5081 | 3757 | 0 | 0 | 0.00% | 0.00% |  |
| B | 5081 | 3757 | 9 | 9 | 0.18% | 0.24% |  |
| C | 5081 | 3757 | 12 | 12 | 0.24% | 0.32% | 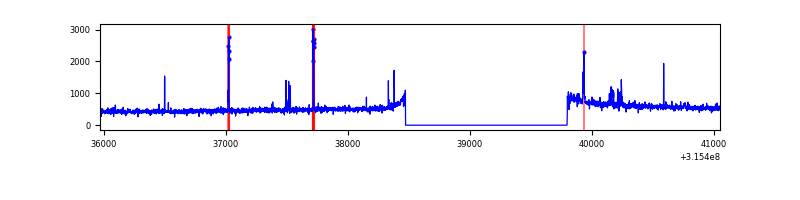 |
| D | 5081 | 3757 | 161 | 161 | 3.17% | 4.29% | 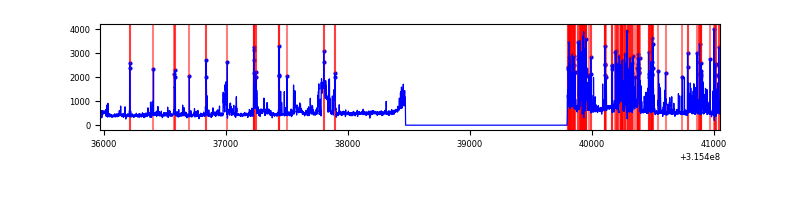 |
Top three noisy pixels from each quadrant. If the there are fewer than three noisy pixels in the level2.evt file, extra rows are filled as -1
| Pixel properties | Quadrant properties | ||||||
|---|---|---|---|---|---|---|---|
| Quadrant | DetID | PixID | Counts | Sigma | Mean | Median | Sigma |
| A | 11 | 47 | 29521 | 292.4 | 494 | 484 | 99.3 |
| A | 6 | 16 | 10606 | 101.93 | 494 | 484 | 99.3 |
| A | 13 | 254 | 4980 | 45.27 | 494 | 484 | 99.3 |
| B | 4 | 216 | 47080 | 498.35 | 493 | 482 | 93.5 |
| B | 0 | 189 | 19275 | 200.99 | 493 | 482 | 93.5 |
| B | 12 | 111 | 11098 | 113.54 | 493 | 482 | 93.5 |
| C | 10 | 9 | 83184 | 740.84 | 475 | 478 | 111.6 |
| C | 14 | 238 | 75311 | 670.31 | 475 | 478 | 111.6 |
| C | 10 | 22 | 7869 | 66.2 | 475 | 478 | 111.6 |
| D | 1 | 52 | 587125 | 5172.24 | 466 | 452 | 113.4 |
| D | 13 | 174 | 198936 | 1749.88 | 466 | 452 | 113.4 |
| D | 13 | 153 | 110300 | 968.44 | 466 | 452 | 113.4 |
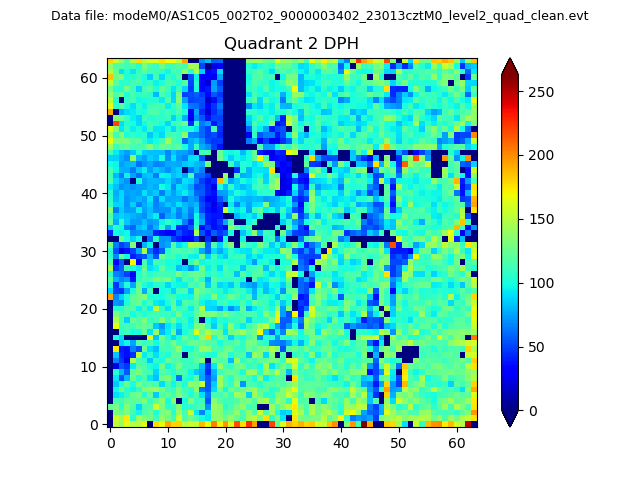
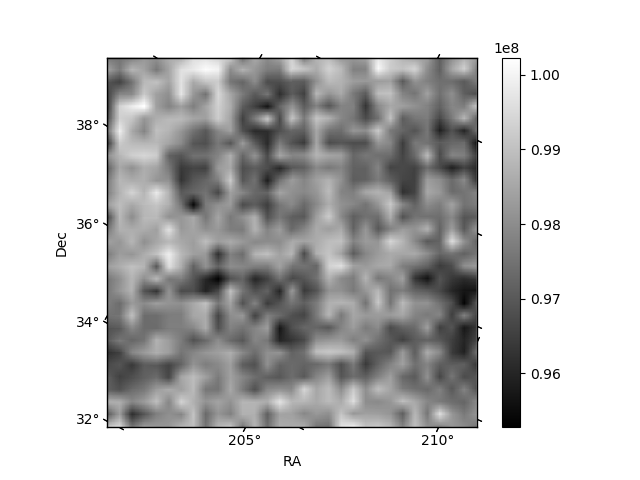
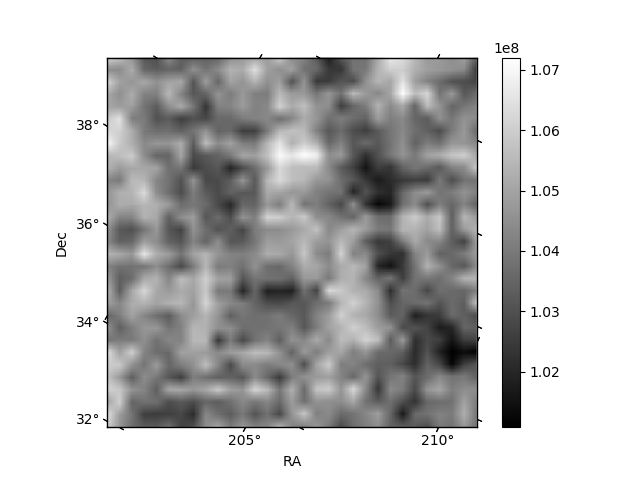
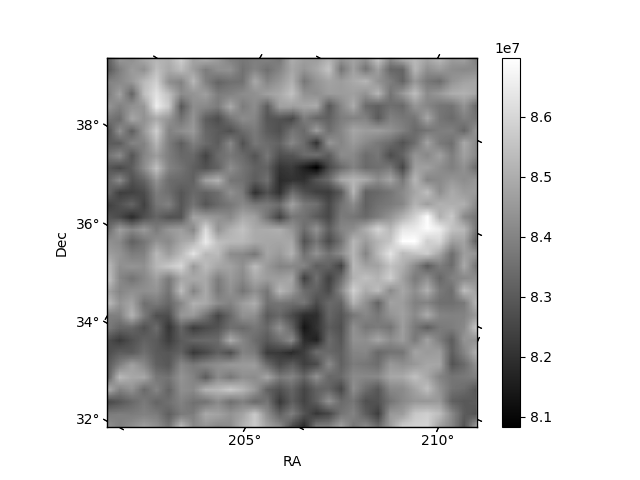
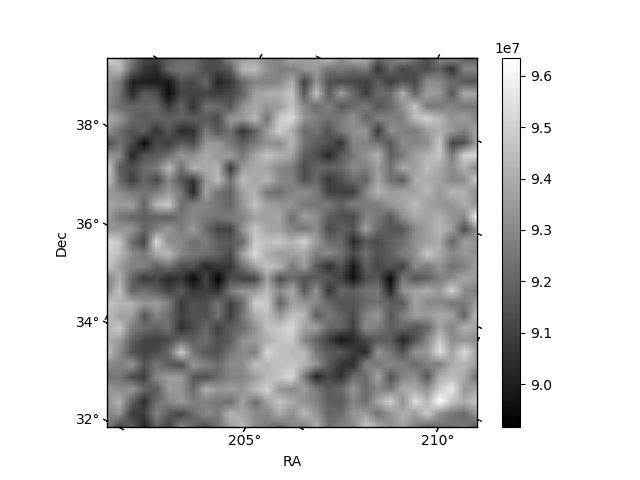
Histogram calculated using DETX and DETY for each event in the final _common_clean file
| Quadrant A | 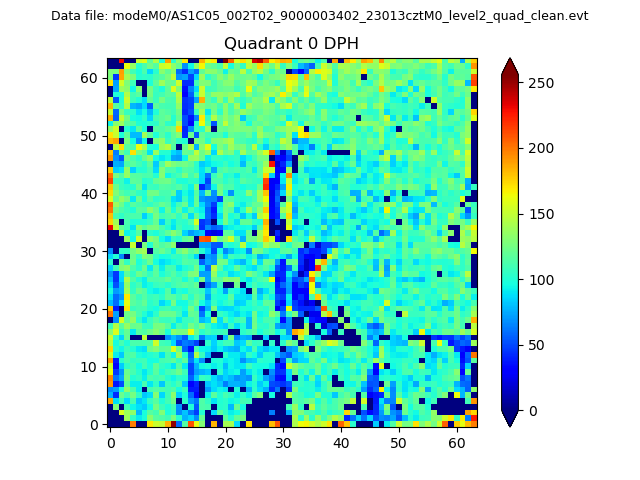 |
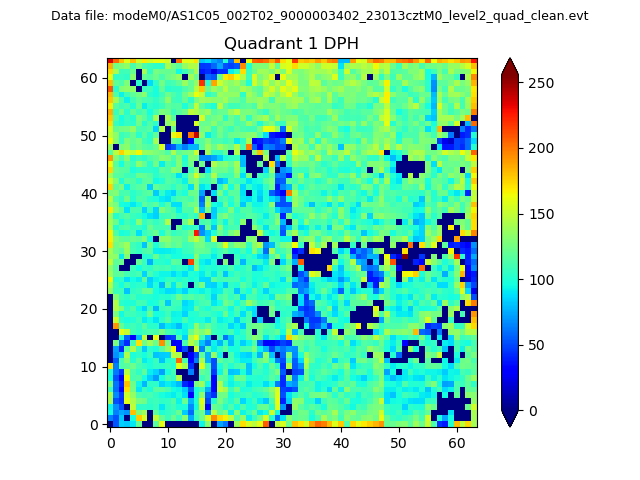 |
Quadrant B |
|---|---|---|---|
| Quadrant D | 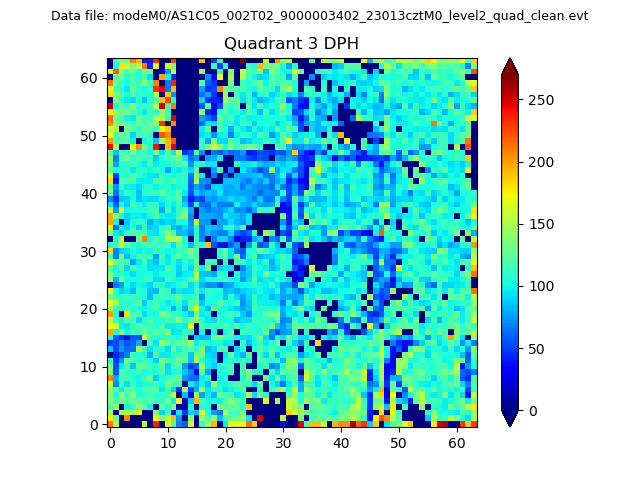 |
 |
Quadrant C |
| Plot type | Count rate plots | Images |
|---|---|---|
| Comparison with Poisson distribution Blue bars denote a histogram of data divided into 1 sec bins. Red curve is a Poisson curve with rate = median count rate of data. |
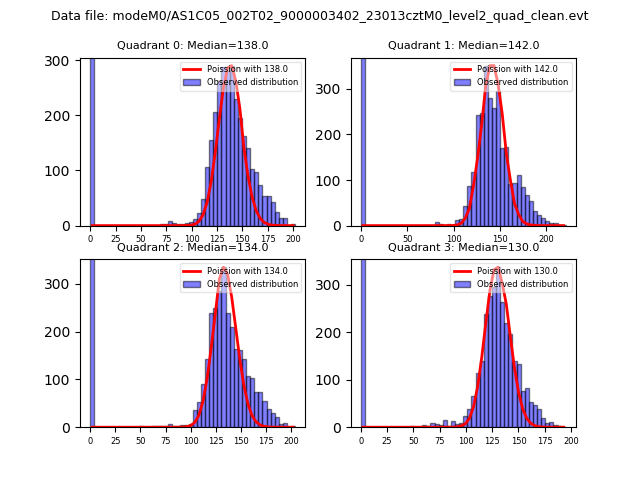 |
 |
| Quadrant-wise count rates Data is divided into 100 sec bins |
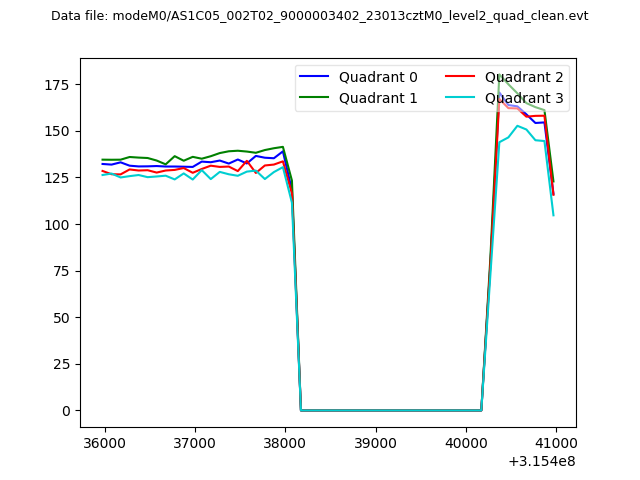 |
|
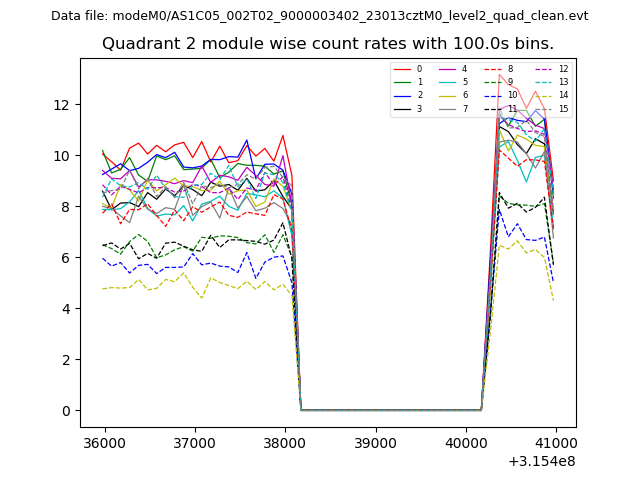
| Module-wise count rates for Quadrant A Data is divided into 100 sec bins |
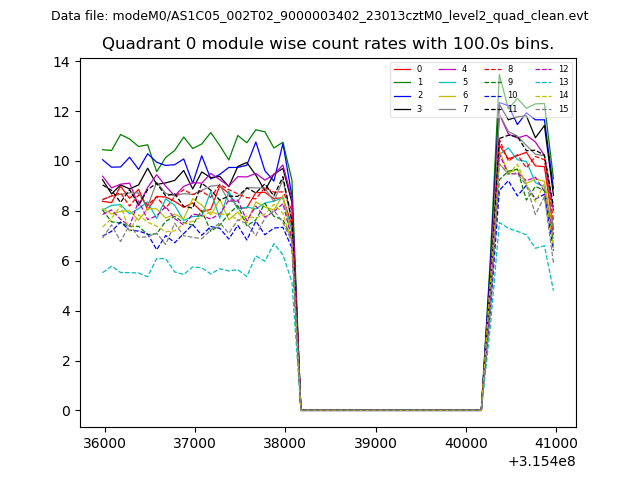 |
 |
| Module-wise count rates for Quadrant B Data is divided into 100 sec bins |
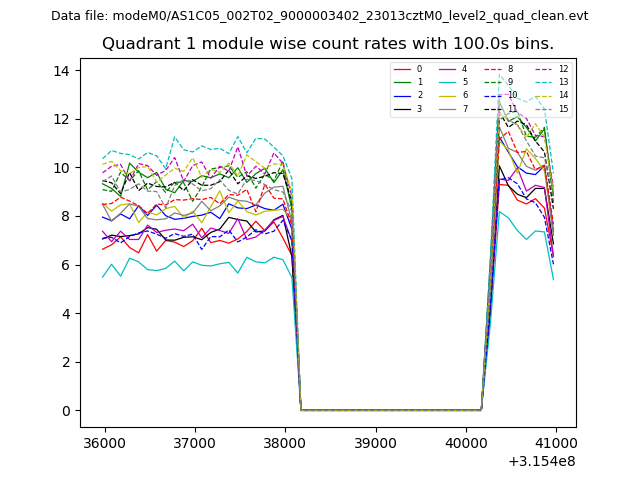 |
 |
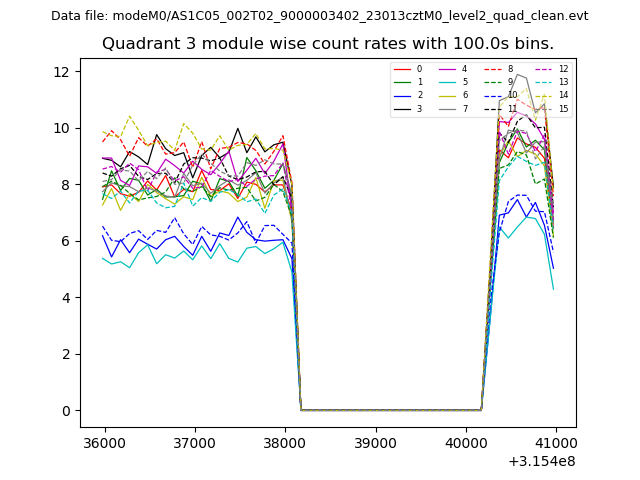
| Module-wise count rates for Quadrant C Data is divided into 100 sec bins |
 |
 |
| Module-wise count rates for Quadrant D Data is divided into 100 sec bins |
 |
 |
| Parameter | Plot |
|---|---|
| CZT HV Monitor | 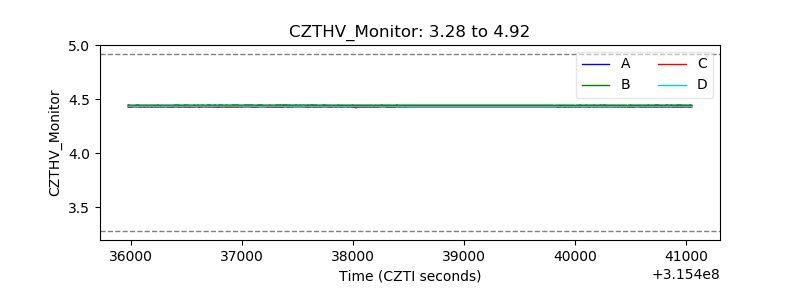 |
| D_VDD | 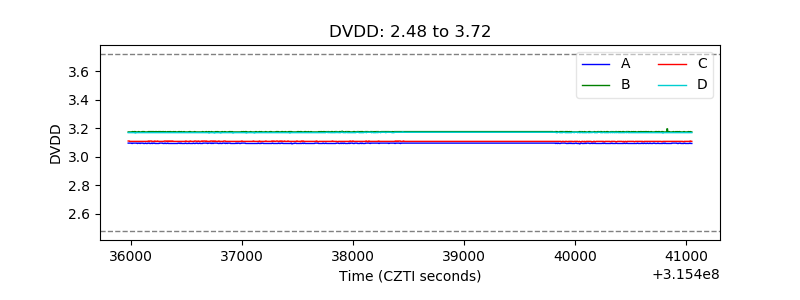 |
| Temperature 1 | 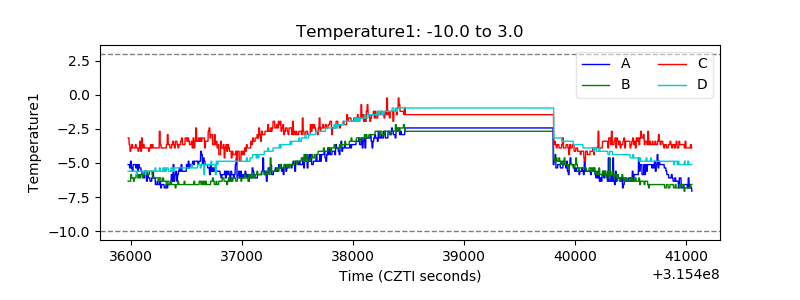 |
| Veto HV Monitor | 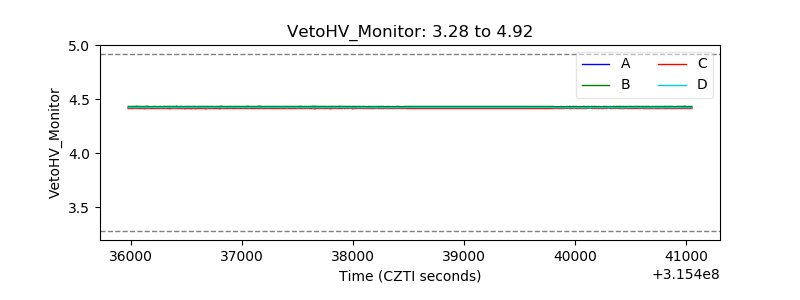 |
| Veto LLD | 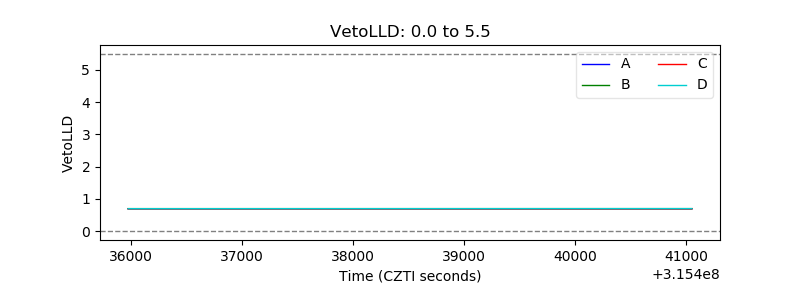 |
| Alpha Counter | 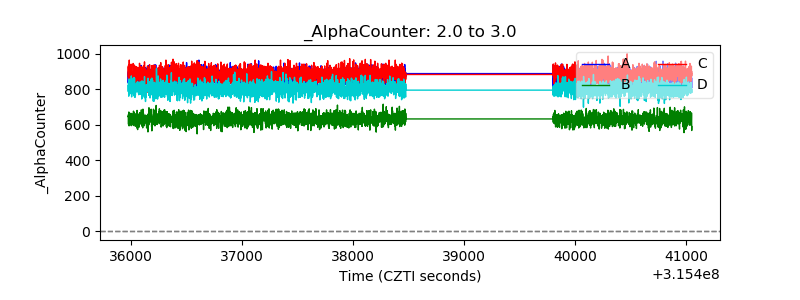 |
| _CPM_Rate | 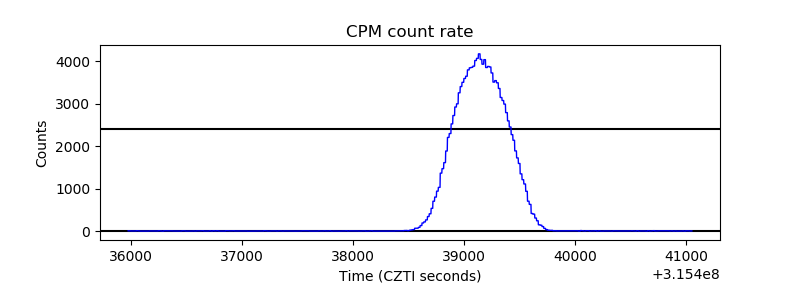 |
| CZT Counter | 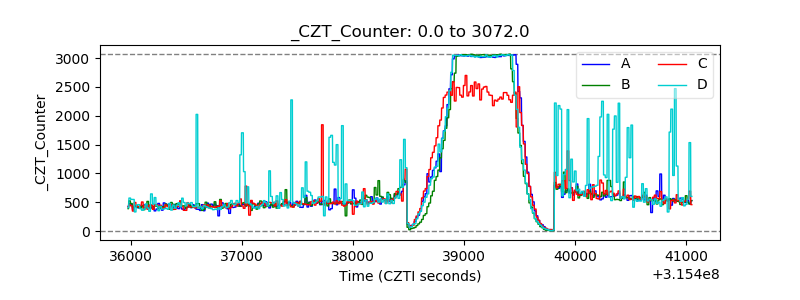 |
| +2.5 Volts monitor |  |
| +5 Volts monitor |  |
| _ROLL_ROT | 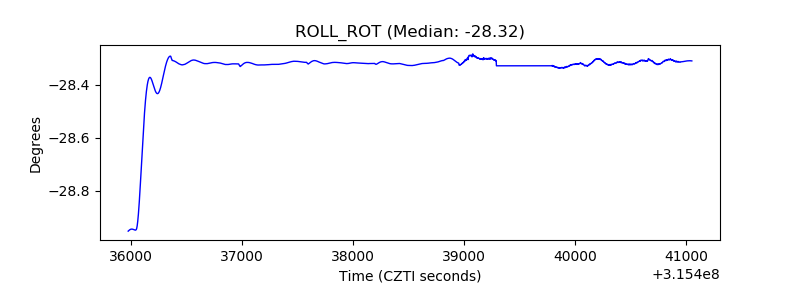 |
| _Roll_DEC | 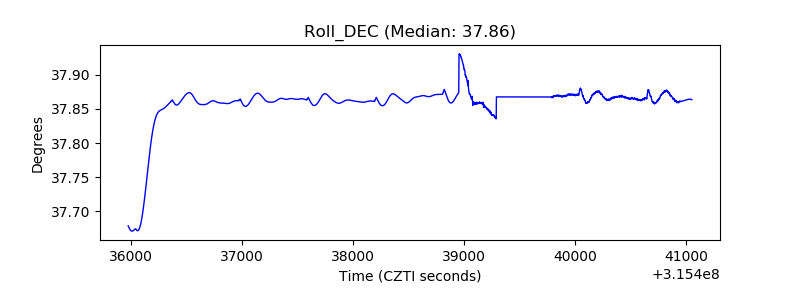 |
| _Roll_RA | 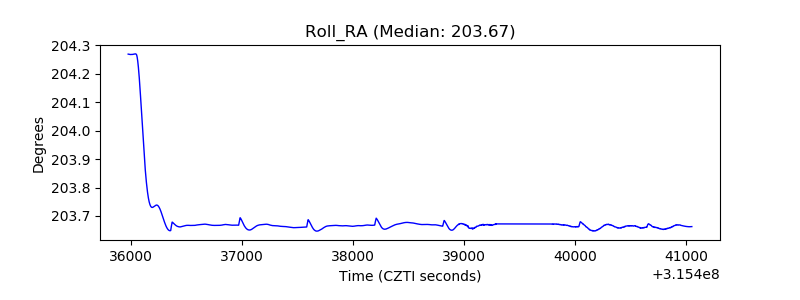 |
| Veto Counter | 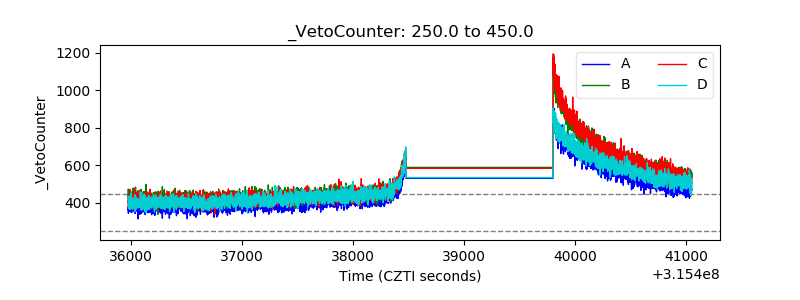 |