| Param | Original file | Final file |
|---|---|---|
| Filename | modeM0/AS1C05_002T02_9000003402_23014cztM0_level2.evt | modeM0/AS1C05_002T02_9000003402_23014cztM0_level2_quad_clean.evt |
| Size (bytes) | 542,733,120 | 105,805,440 |
| Size | 517.6 MB | 100.9 MB |
| Events in quadrant A | 3,219,748 | 721,332 |
| Events in quadrant B | 3,348,907 | 750,118 |
| Events in quadrant C | 3,357,790 | 712,794 |
| Events in quadrant D | 6,090,877 | 588,019 |
| Mode SS | |||
|---|---|---|---|
| Quadrant | BADHDUFLAG | Total packets | Discarded packets |
| A | 0 | 124 | 0 |
| B | 0 | 124 | 0 |
| C | 0 | 124 | 0 |
| D | 0 | 124 | 0 |
| Mode M0 | |||
|---|---|---|---|
| Quadrant | BADHDUFLAG | Total packets | Discarded packets |
| A | 0 | 13562 | 2 |
| B | 0 | 13874 | 2 |
| C | 0 | 13897 | 2 |
| D | 0 | 22383 | 3 |
| Mode M9 | |||
|---|---|---|---|
| Quadrant | BADHDUFLAG | Total packets | Discarded packets |
| A | 0 | 22 | 0 |
| B | 0 | 23 | 0 |
| C | 0 | 23 | 0 |
| D | 0 | 23 | 0 |
| Quadrant | Total seconds | Saturated seconds | Saturation percentage |
|---|---|---|---|
| A | 6191 | 30 | 0.484574% |
| B | 6191 | 61 | 0.985301% |
| C | 6191 | 105 | 1.696010% |
| D | 6190 | 1141 | 18.432956% |
Noise dominated data is calculated using 1-second bins in cleaned event files. If a bin has >2000 counts, and if more than 50% of those come from <1% of pixels, then it is considered to be noise-dominated and hence unusable.
| Quadrant | # 1 sec bins | Bins with >0 counts | Bins with >2000 counts | High rate bins dominated by noise | Noise dominated (total time) | Noise dominated (detector-on time) | Marked lightcurve |
|---|---|---|---|---|---|---|---|
| A | 7576 | 6192 | 0 | 0 | 0.00% | 0.00% | 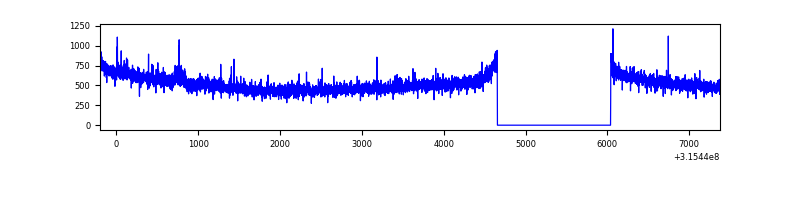 |
| B | 7576 | 6192 | 15 | 15 | 0.20% | 0.24% | 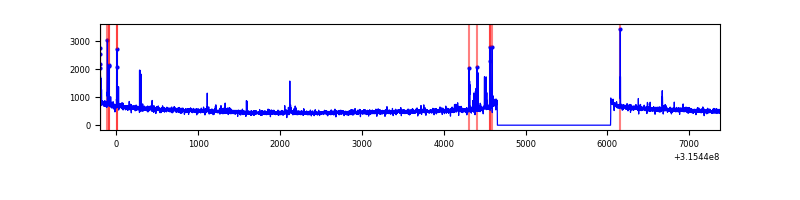 |
| C | 7576 | 6192 | 7 | 7 | 0.09% | 0.11% | 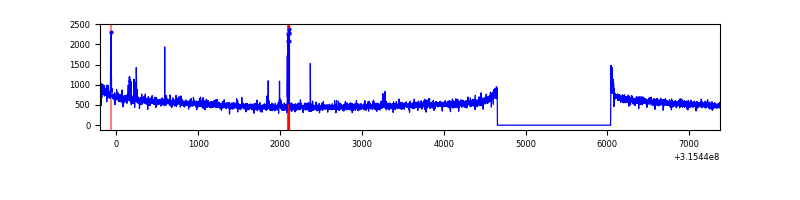 |
| D | 7575 | 6190 | 902 | 902 | 11.91% | 14.57% | 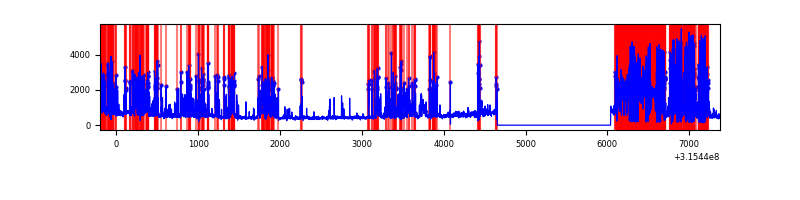 |
Top three noisy pixels from each quadrant. If the there are fewer than three noisy pixels in the level2.evt file, extra rows are filled as -1
| Pixel properties | Quadrant properties | ||||||
|---|---|---|---|---|---|---|---|
| Quadrant | DetID | PixID | Counts | Sigma | Mean | Median | Sigma |
| A | 11 | 47 | 47942 | 287.22 | 821 | 807 | 164.1 |
| A | 6 | 16 | 10955 | 61.84 | 821 | 807 | 164.1 |
| A | 13 | 254 | 8307 | 45.7 | 821 | 807 | 164.1 |
| B | 4 | 216 | 80409 | 518.65 | 826 | 806 | 153.5 |
| B | 0 | 189 | 27304 | 172.65 | 826 | 806 | 153.5 |
| B | 12 | 111 | 18053 | 112.37 | 826 | 806 | 153.5 |
| C | 14 | 238 | 129937 | 703.96 | 797 | 803 | 183.4 |
| C | 10 | 9 | 87855 | 474.55 | 797 | 803 | 183.4 |
| C | 0 | 10 | 12227 | 62.28 | 797 | 803 | 183.4 |
| D | 1 | 52 | 3283535 | 19263.12 | 705 | 685 | 170.4 |
| D | 13 | 153 | 77198 | 448.96 | 705 | 685 | 170.4 |
| D | 2 | 152 | 57338 | 332.43 | 705 | 685 | 170.4 |
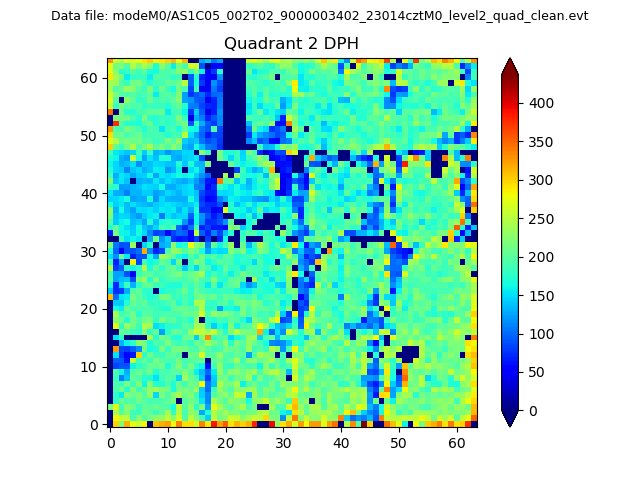
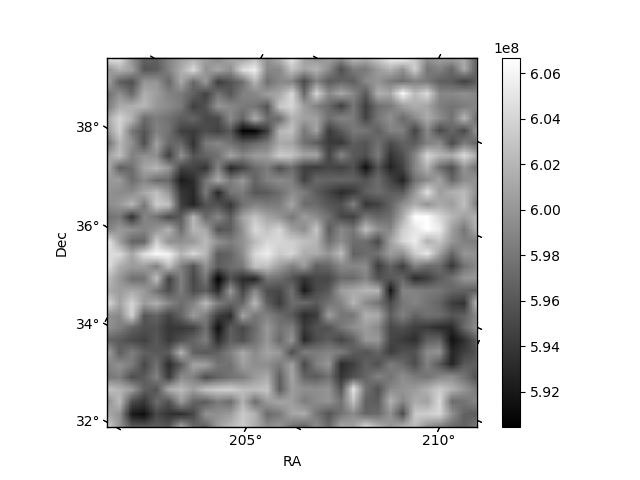
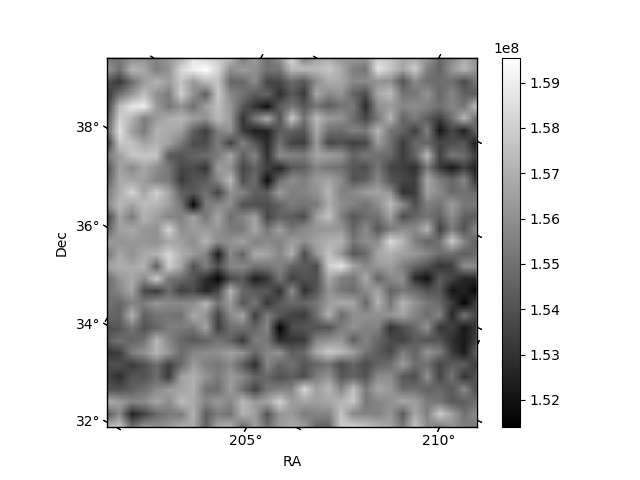
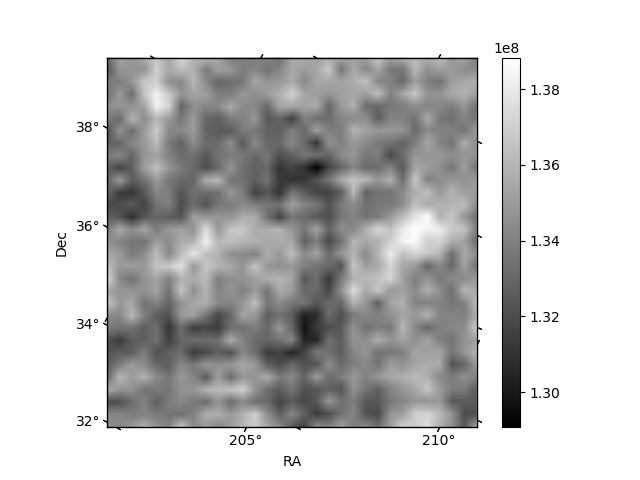
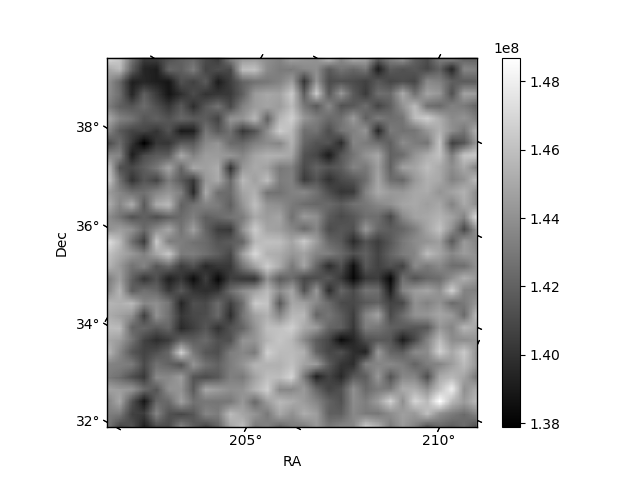
Histogram calculated using DETX and DETY for each event in the final _common_clean file
| Quadrant A | 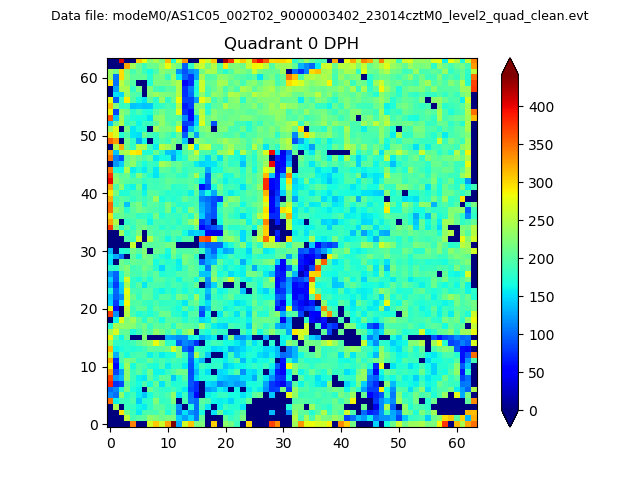 |
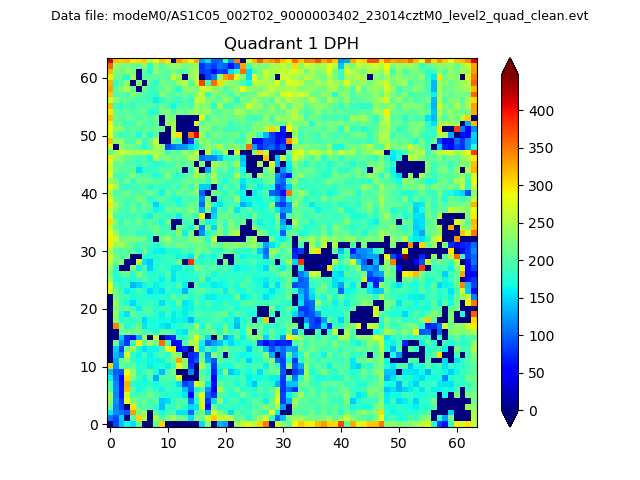 |
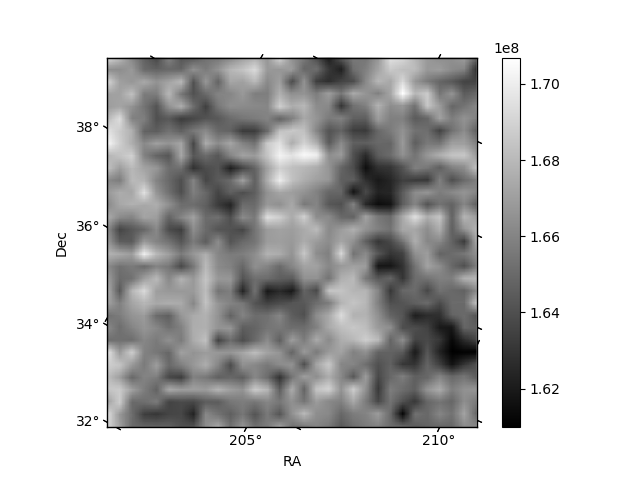
Quadrant B |
|---|---|---|---|
| Quadrant D | 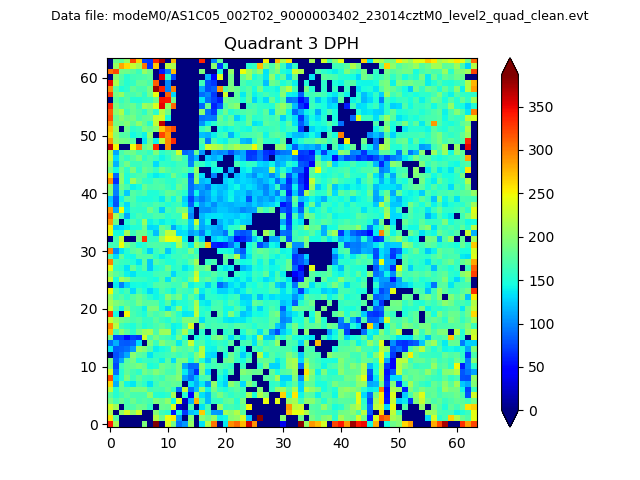 |
 |
Quadrant C |
| Plot type | Count rate plots | Images |
|---|---|---|
| Comparison with Poisson distribution Blue bars denote a histogram of data divided into 1 sec bins. Red curve is a Poisson curve with rate = median count rate of data. |
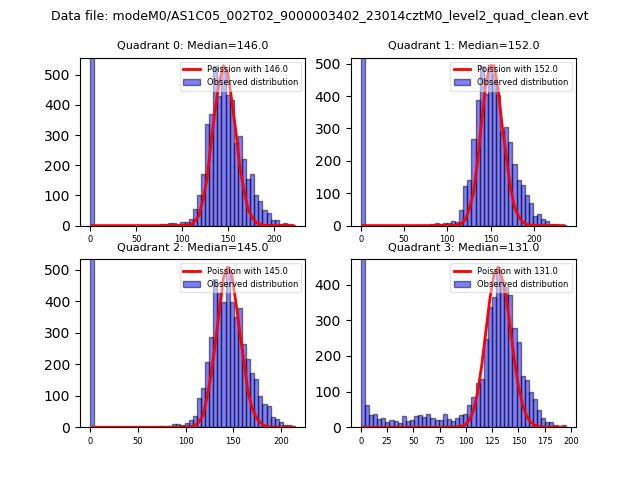 |
 |
| Quadrant-wise count rates Data is divided into 100 sec bins |
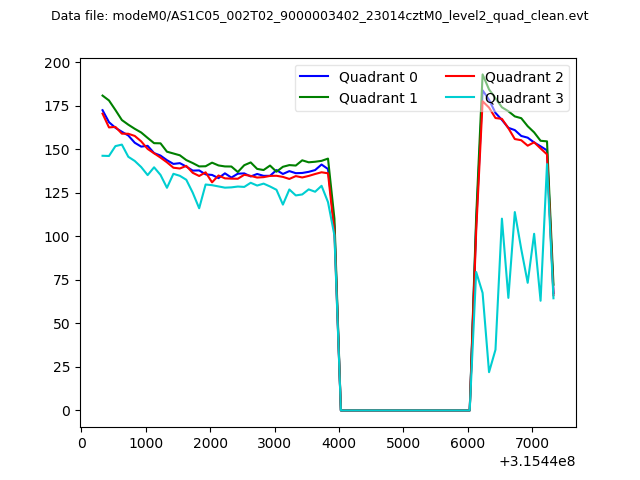 |
|
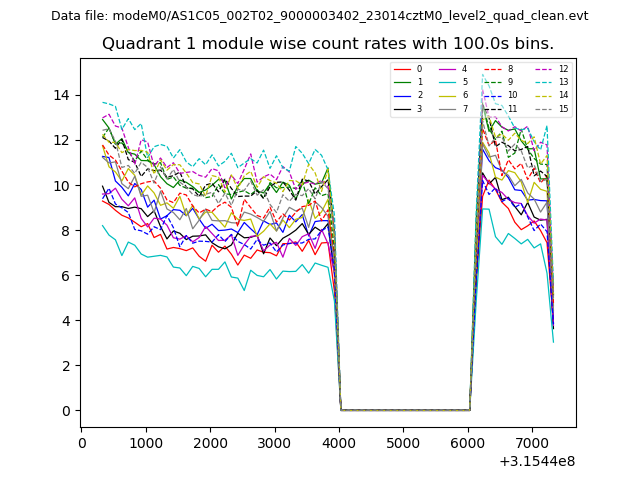
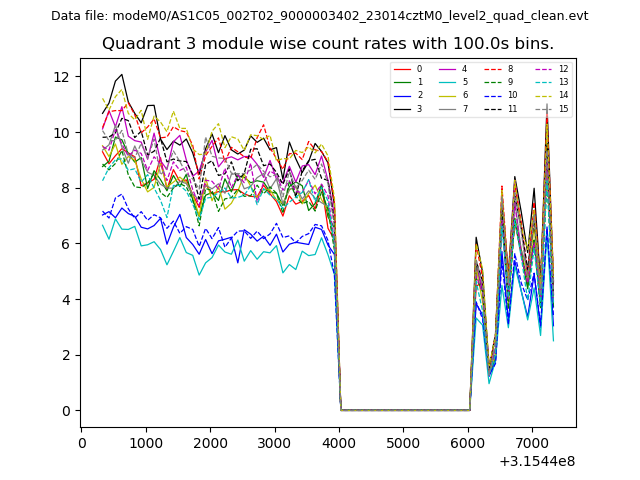
| Module-wise count rates for Quadrant A Data is divided into 100 sec bins |
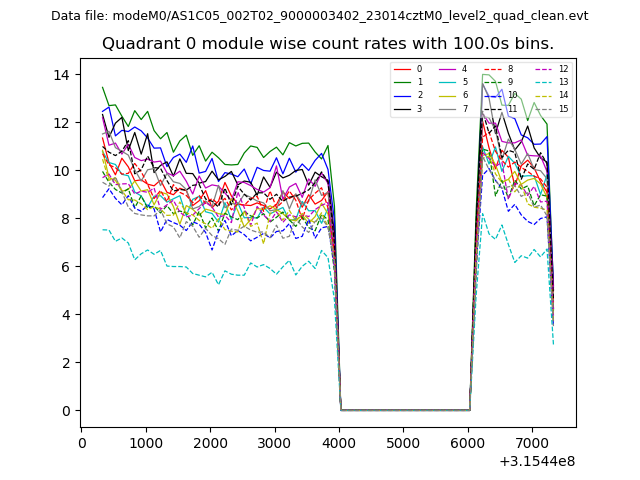 |
 |
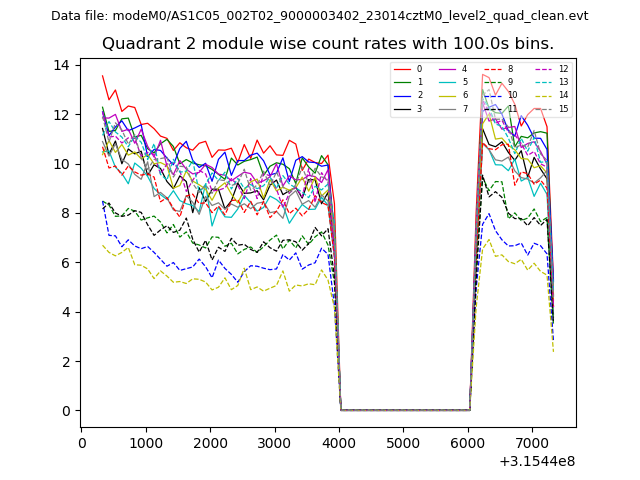
| Module-wise count rates for Quadrant B Data is divided into 100 sec bins |
 |
 |
| Module-wise count rates for Quadrant C Data is divided into 100 sec bins |
 |
 |
| Module-wise count rates for Quadrant D Data is divided into 100 sec bins |
 |
 |
| Parameter | Plot |
|---|---|
| CZT HV Monitor | 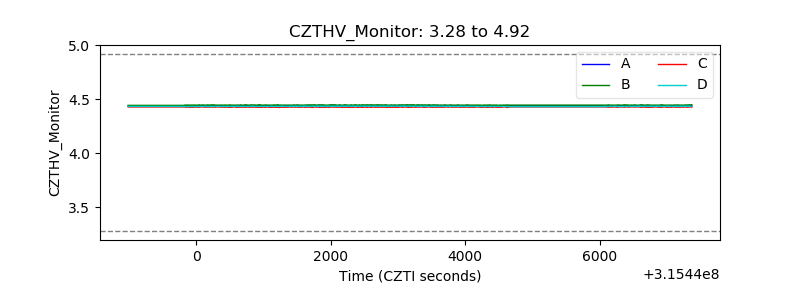 |
| D_VDD | 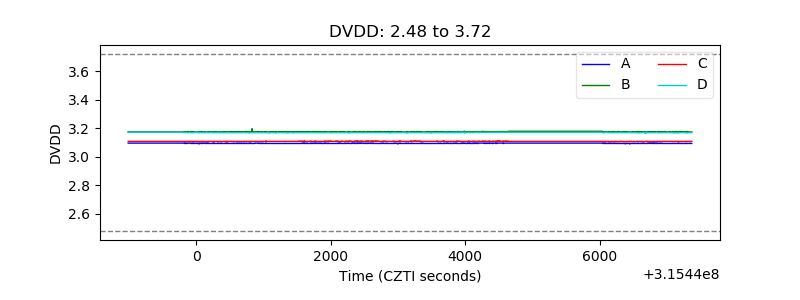 |
| Temperature 1 | 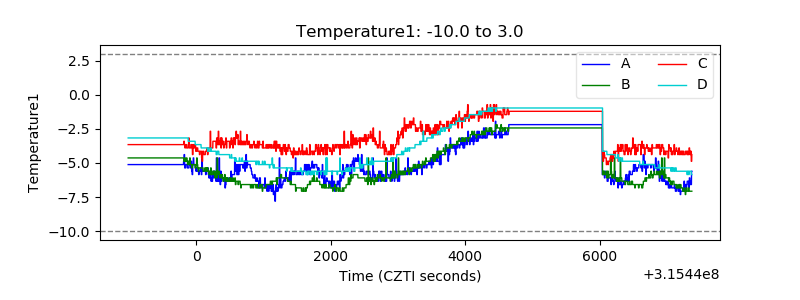 |
| Veto HV Monitor | 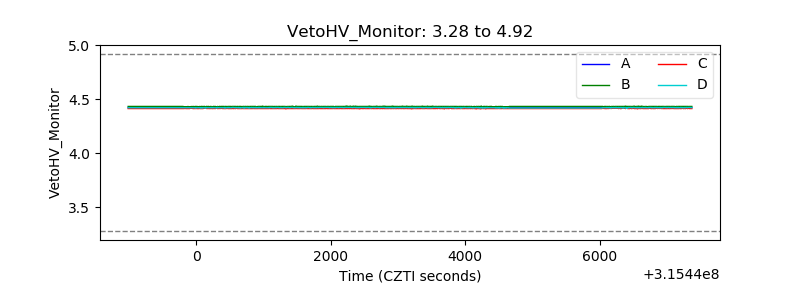 |
| Veto LLD | 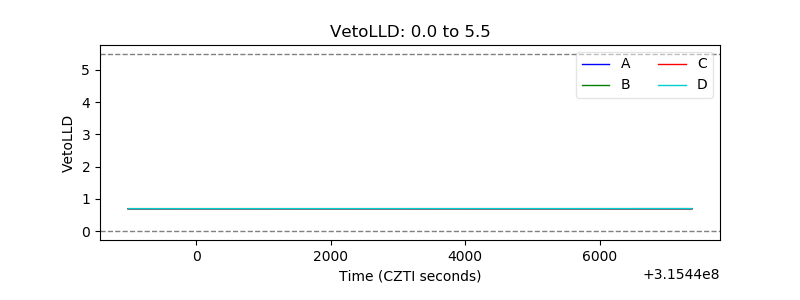 |
| Alpha Counter | 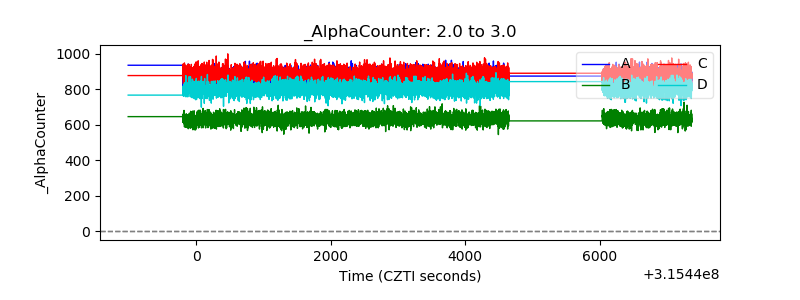 |
| _CPM_Rate | 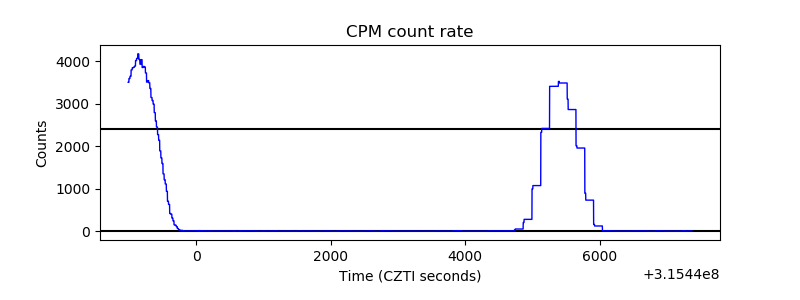 |
| CZT Counter | 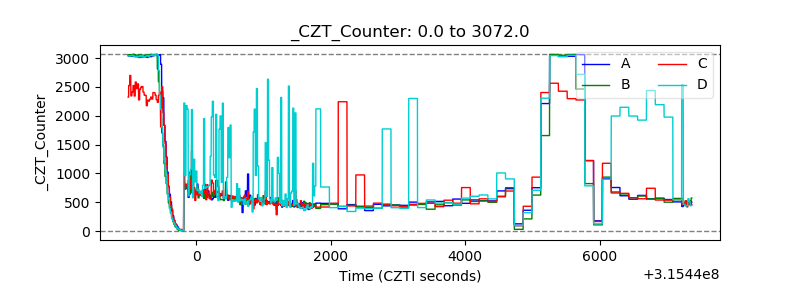 |
| +2.5 Volts monitor |  |
| +5 Volts monitor |  |
| _ROLL_ROT | 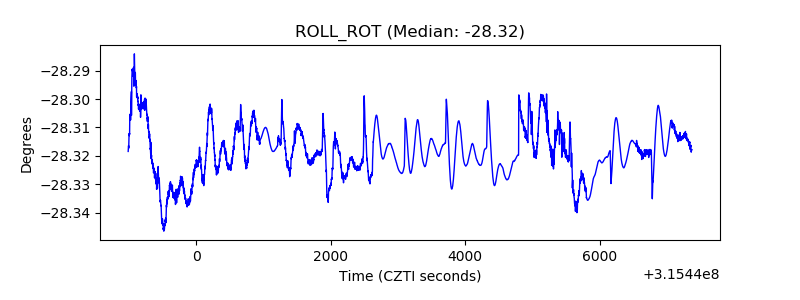 |
| _Roll_DEC | 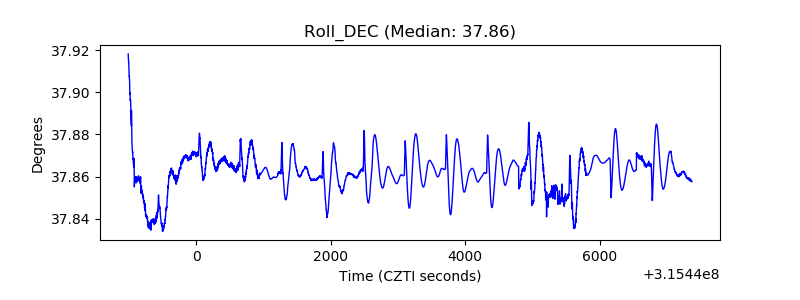 |
| _Roll_RA | 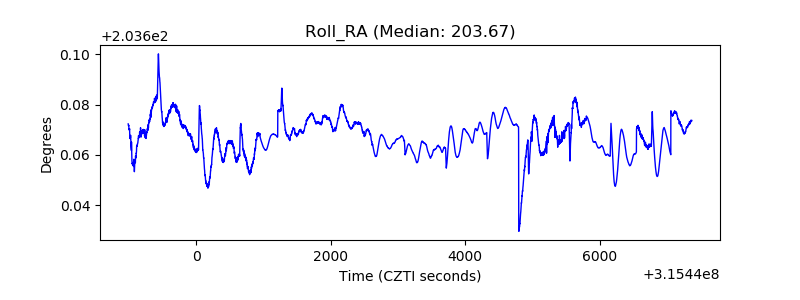 |
| Veto Counter | 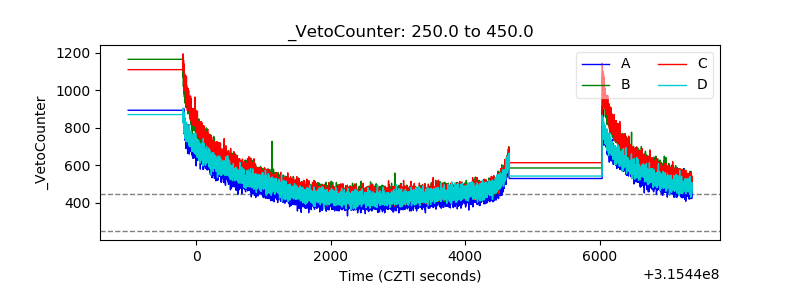 |