| Param | Original file | Final file |
|---|---|---|
| Filename | modeM0/AS1C05_002T02_9000003402_23015cztM0_level2.evt | modeM0/AS1C05_002T02_9000003402_23015cztM0_level2_quad_clean.evt |
| Size (bytes) | 731,427,840 | 126,982,080 |
| Size | 697.5 MB | 121.1 MB |
| Events in quadrant A | 4,454,137 | 815,510 |
| Events in quadrant B | 4,592,049 | 844,619 |
| Events in quadrant C | 4,637,633 | 803,328 |
| Events in quadrant D | 7,863,030 | 762,741 |
| Mode SS | |||
|---|---|---|---|
| Quadrant | BADHDUFLAG | Total packets | Discarded packets |
| A | 0 | 182 | 2 |
| B | 0 | 182 | 2 |
| C | 0 | 182 | 2 |
| D | 0 | 182 | 2 |
| Mode M0 | |||
|---|---|---|---|
| Quadrant | BADHDUFLAG | Total packets | Discarded packets |
| A | 0 | 19154 | 145 |
| B | 0 | 19477 | 168 |
| C | 0 | 19581 | 139 |
| D | 0 | 29667 | 217 |
| Mode M9 | |||
|---|---|---|---|
| Quadrant | BADHDUFLAG | Total packets | Discarded packets |
| A | 0 | 19 | 1 |
| B | 0 | 19 | 1 |
| C | 0 | 19 | 1 |
| D | 0 | 19 | 1 |
| Quadrant | Total seconds | Saturated seconds | Saturation percentage |
|---|---|---|---|
| A | 8929 | 24 | 0.268787% |
| B | 8931 | 48 | 0.537454% |
| C | 8932 | 117 | 1.309897% |
| D | 8930 | 1206 | 13.505039% |
Noise dominated data is calculated using 1-second bins in cleaned event files. If a bin has >2000 counts, and if more than 50% of those come from <1% of pixels, then it is considered to be noise-dominated and hence unusable.
| Quadrant | # 1 sec bins | Bins with >0 counts | Bins with >2000 counts | High rate bins dominated by noise | Noise dominated (total time) | Noise dominated (detector-on time) | Marked lightcurve |
|---|---|---|---|---|---|---|---|
| A | 11929 | 8939 | 0 | 0 | 0.00% | 0.00% | 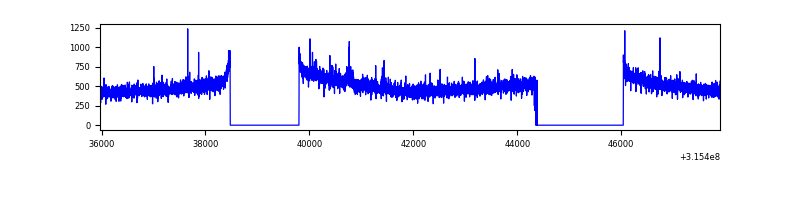 |
| B | 11929 | 8944 | 11 | 11 | 0.09% | 0.12% | 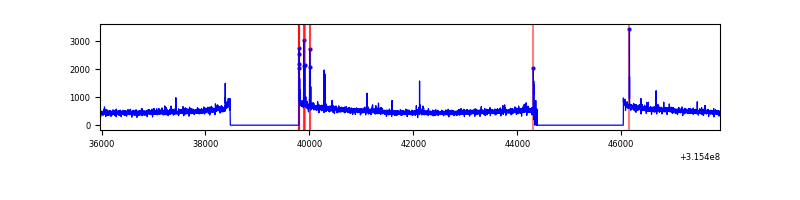 |
| C | 11929 | 8940 | 18 | 18 | 0.15% | 0.20% | 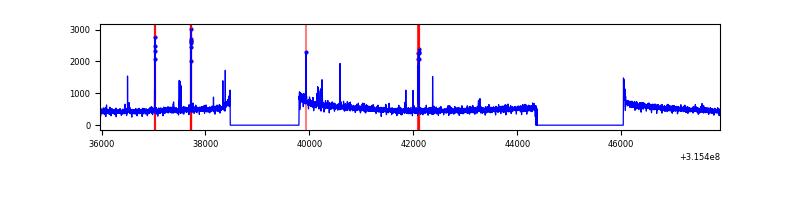 |
| D | 11929 | 8937 | 965 | 965 | 8.09% | 10.80% | 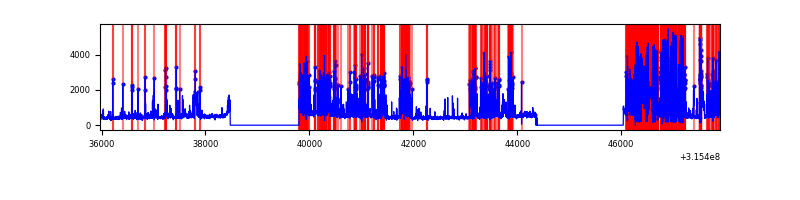 |
Top three noisy pixels from each quadrant. If the there are fewer than three noisy pixels in the level2.evt file, extra rows are filled as -1
| Pixel properties | Quadrant properties | ||||||
|---|---|---|---|---|---|---|---|
| Quadrant | DetID | PixID | Counts | Sigma | Mean | Median | Sigma |
| A | 11 | 47 | 50703 | 218.51 | 1141 | 1123 | 226.9 |
| A | 13 | 254 | 11798 | 47.05 | 1141 | 1123 | 226.9 |
| A | 6 | 16 | 11350 | 45.07 | 1141 | 1123 | 226.9 |
| B | 4 | 216 | 62883 | 289.13 | 1145 | 1118 | 213.6 |
| B | 0 | 189 | 35381 | 160.39 | 1145 | 1118 | 213.6 |
| B | 12 | 111 | 25429 | 113.8 | 1145 | 1118 | 213.6 |
| C | 14 | 238 | 177913 | 698.16 | 1101 | 1111 | 253.2 |
| C | 10 | 9 | 131346 | 514.27 | 1101 | 1111 | 253.2 |
| C | 0 | 10 | 13172 | 47.63 | 1101 | 1111 | 253.2 |
| D | 1 | 52 | 3548101 | 14475.13 | 1011 | 983 | 245.0 |
| D | 13 | 153 | 220869 | 897.31 | 1011 | 983 | 245.0 |
| D | 13 | 174 | 199732 | 811.06 | 1011 | 983 | 245.0 |
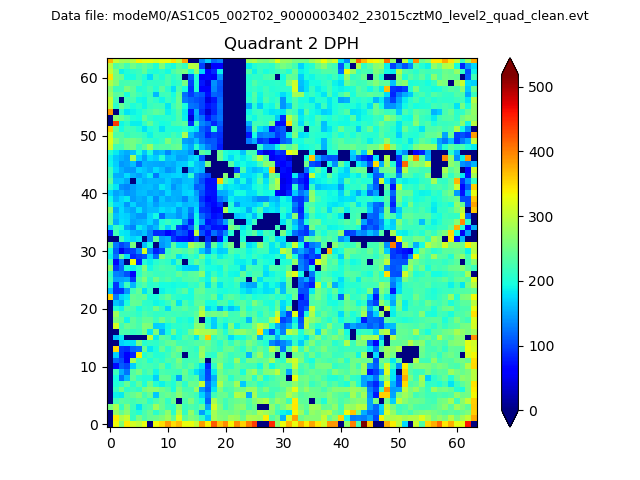
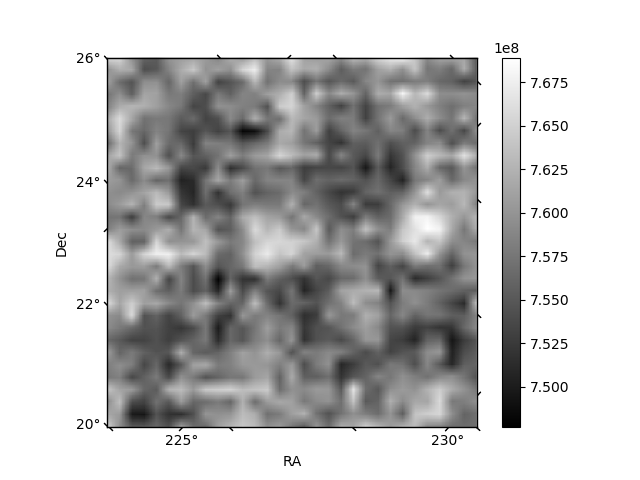
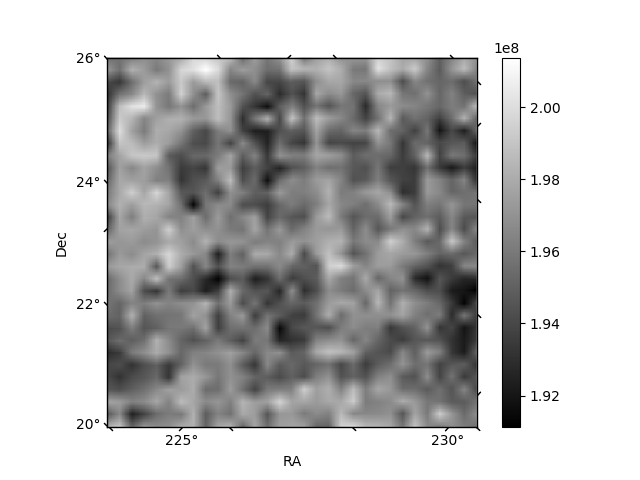
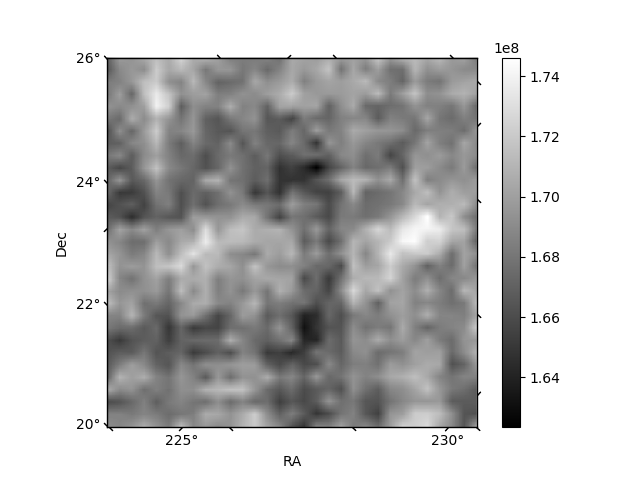
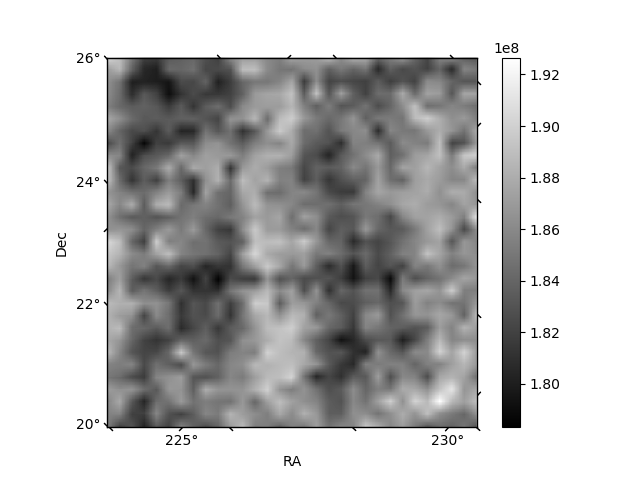
Histogram calculated using DETX and DETY for each event in the final _common_clean file
| Quadrant A | 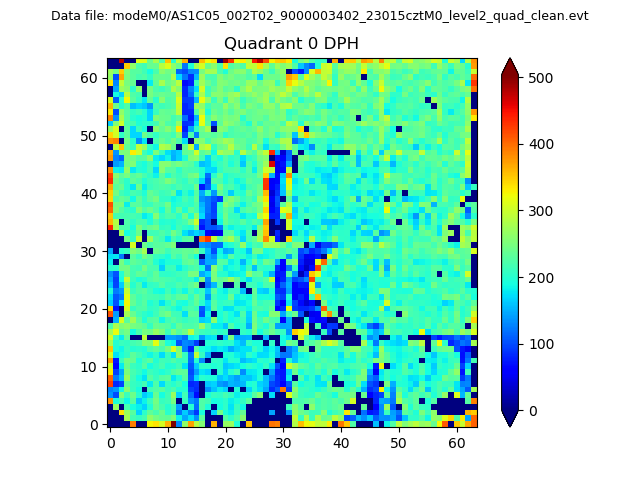 |
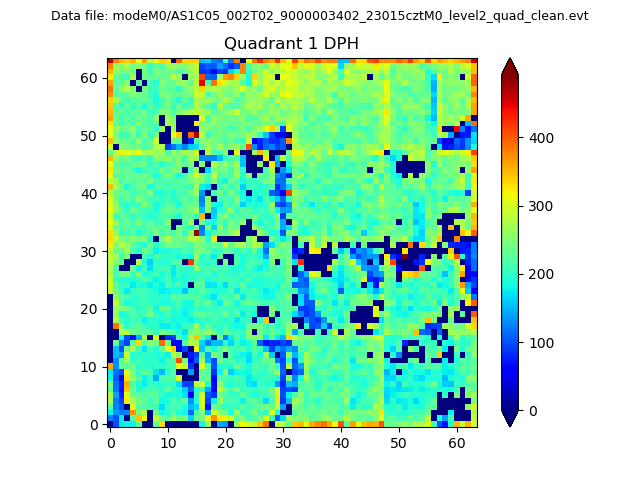 |
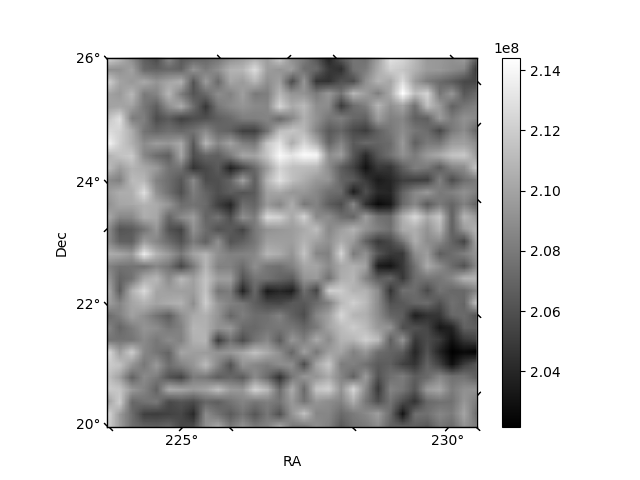
Quadrant B |
|---|---|---|---|
| Quadrant D | 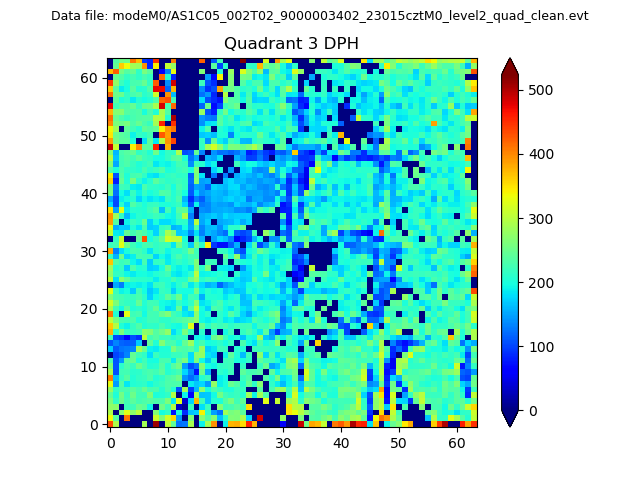 |
 |
Quadrant C |
| Plot type | Count rate plots | Images |
|---|---|---|
| Comparison with Poisson distribution Blue bars denote a histogram of data divided into 1 sec bins. Red curve is a Poisson curve with rate = median count rate of data. |
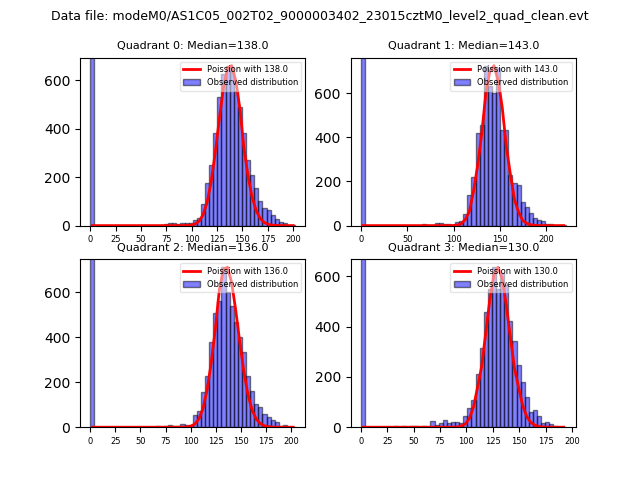 |
 |
| Quadrant-wise count rates Data is divided into 100 sec bins |
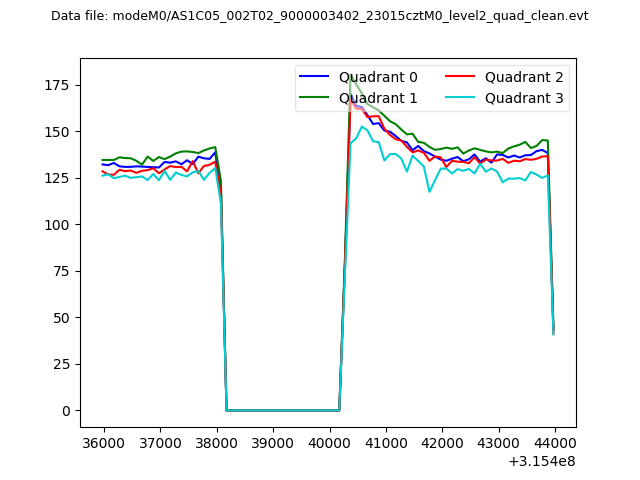 |
|
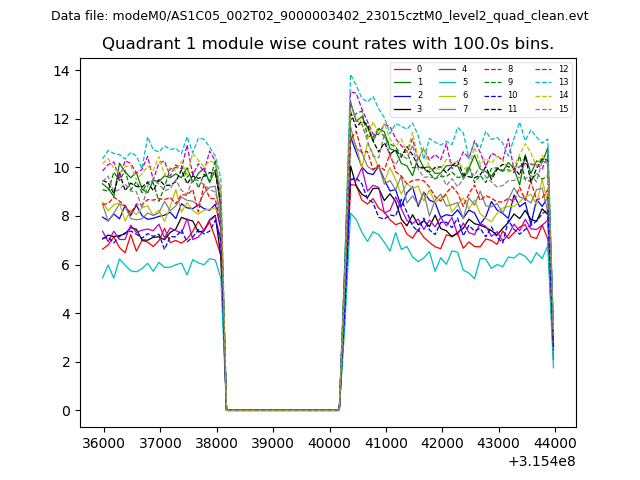
| Module-wise count rates for Quadrant A Data is divided into 100 sec bins |
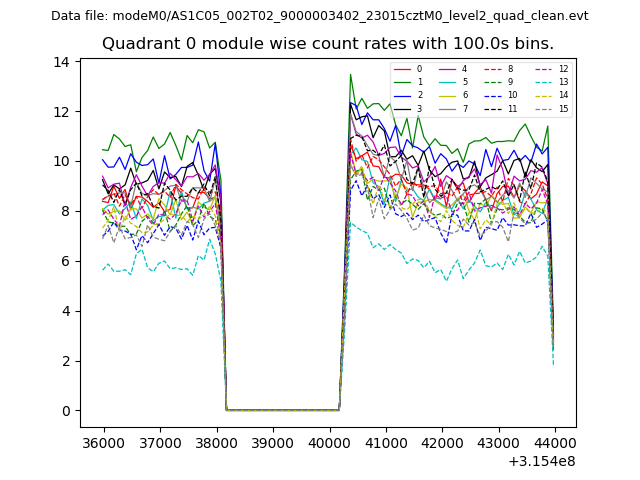 |
 |
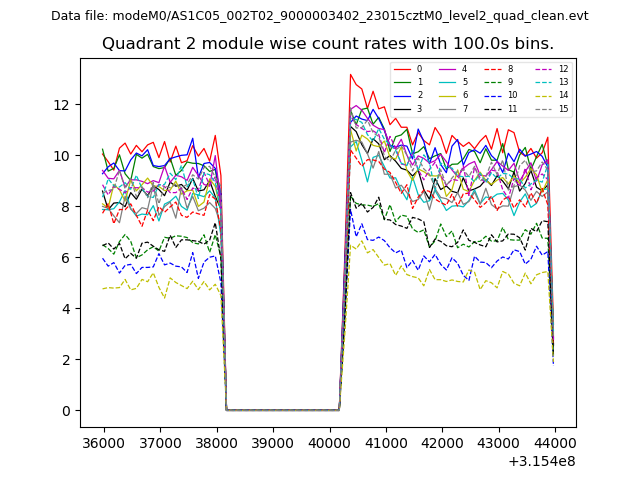
| Module-wise count rates for Quadrant B Data is divided into 100 sec bins |
 |
 |
| Module-wise count rates for Quadrant C Data is divided into 100 sec bins |
 |
 |
| Module-wise count rates for Quadrant D Data is divided into 100 sec bins |
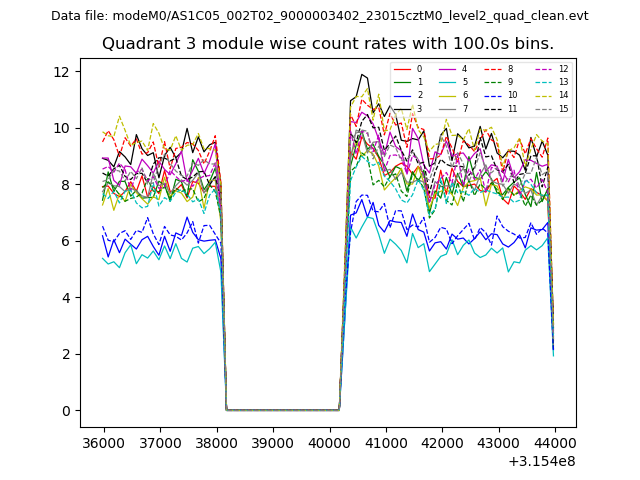 |
 |
| Parameter | Plot |
|---|---|
| CZT HV Monitor | 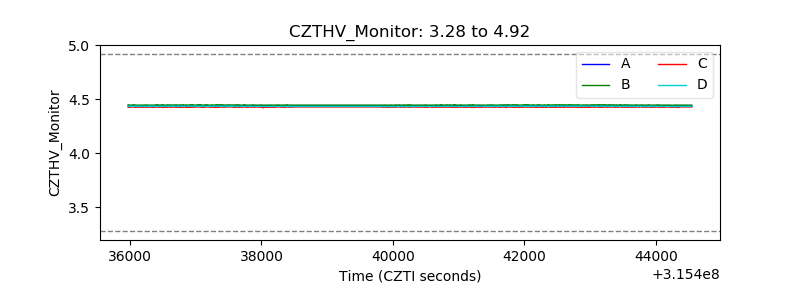 |
| D_VDD | 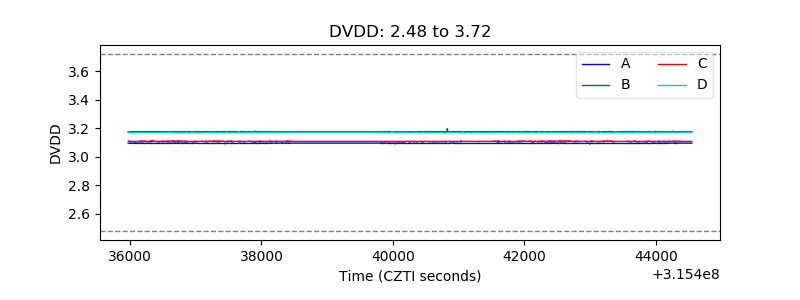 |
| Temperature 1 | 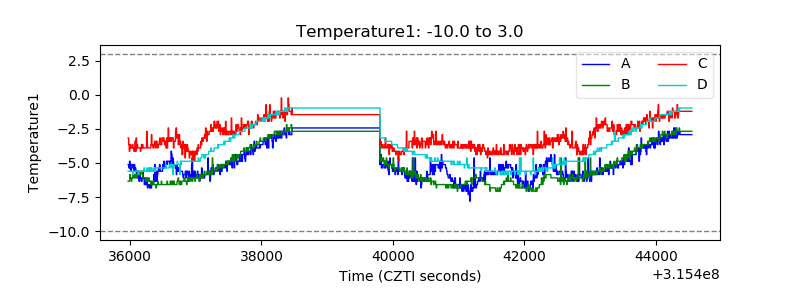 |
| Veto HV Monitor | 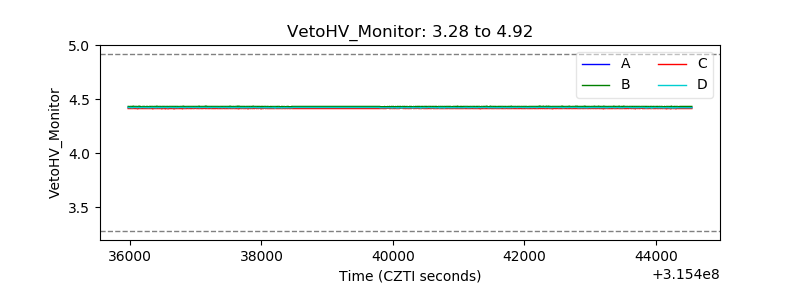 |
| Veto LLD | 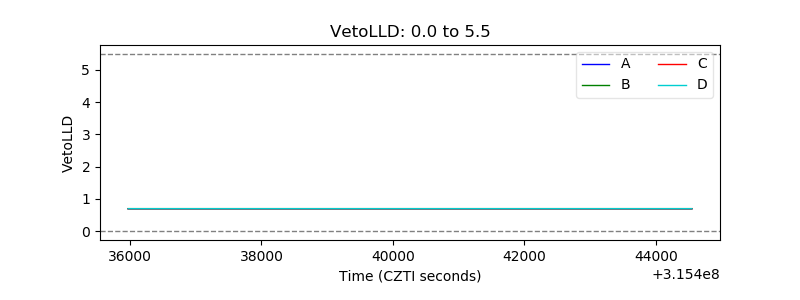 |
| Alpha Counter | 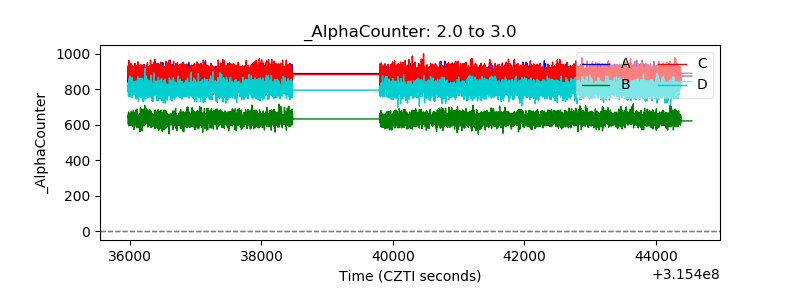 |
| _CPM_Rate | 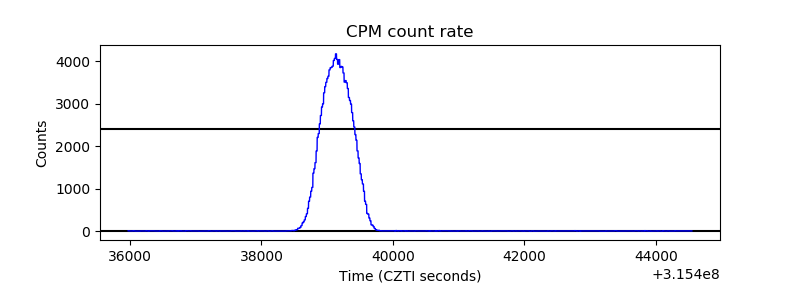 |
| CZT Counter | 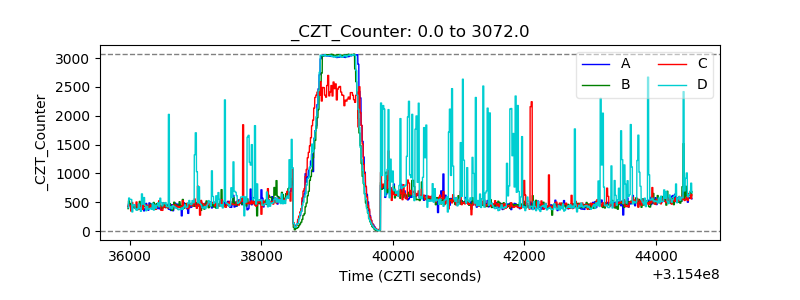 |
| +2.5 Volts monitor |  |
| +5 Volts monitor |  |
| _ROLL_ROT | 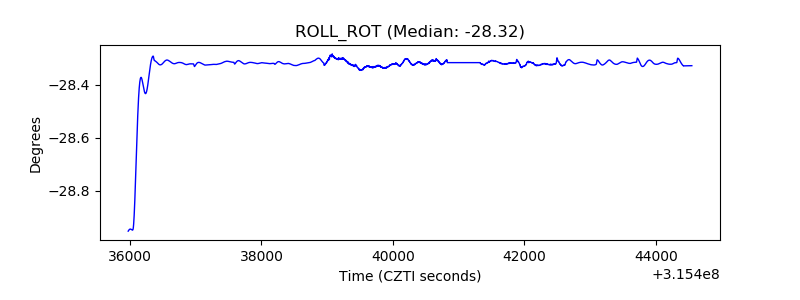 |
| _Roll_DEC | 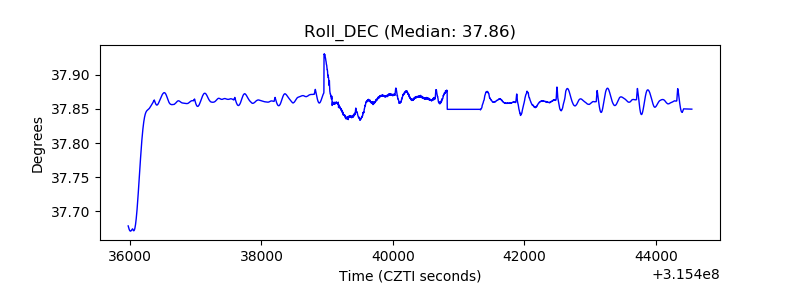 |
| _Roll_RA | 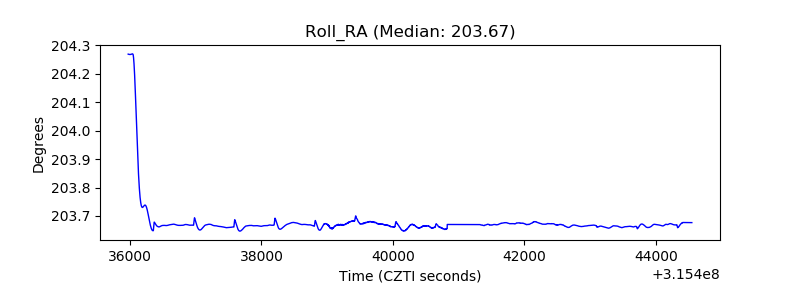 |
| Veto Counter |  |