| Param | Original file | Final file |
|---|---|---|
| Filename | modeM0/AS1C05_004T01_9000003404cztM0_level2.fits | modeM0/AS1C05_004T01_9000003404cztM0_level2_quad_clean.evt |
| Size (bytes) | 1,400,806,080 | 1,512,302,400 |
| Size | 1.3 GB | 1.4 GB |
| Events in quadrant A | 8,603,724 | 9,411,506 |
| Events in quadrant B | 8,255,328 | 9,425,792 |
| Events in quadrant C | 8,430,022 | 8,951,268 |
| Events in quadrant D | 7,198,074 | 8,081,497 |
| Mode M0 | |||
|---|---|---|---|
| Quadrant | BADHDUFLAG | Total packets | Discarded packets |
| A | 0 | 297804 | 0 |
| B | 0 | 310287 | 0 |
| C | 0 | 307023 | 0 |
| D | 0 | 404606 | 0 |
| Mode SS | |||
|---|---|---|---|
| Quadrant | BADHDUFLAG | Total packets | Discarded packets |
| A | 0 | 2986 | 0 |
| B | 0 | 2986 | 0 |
| C | 0 | 2986 | 0 |
| D | 0 | 2986 | 0 |
| Mode M9 | |||
|---|---|---|---|
| Quadrant | BADHDUFLAG | Total packets | Discarded packets |
| A | 0 | 237 | 0 |
| B | 0 | 236 | 0 |
| C | 0 | 238 | 0 |
| D | 0 | 236 | 0 |
| Quadrant | Total seconds | Saturated seconds | Saturation percentage |
|---|---|---|---|
| A | 144876 | 1628 | 1.123720% |
| B | 144881 | 2806 | 1.936762% |
| C | 144884 | 2860 | 1.973993% |
| D | 144866 | 6251 | 4.315022% |
Noise dominated data is calculated using 1-second bins in cleaned event files. If a bin has >2000 counts, and if more than 50% of those come from <1% of pixels, then it is considered to be noise-dominated and hence unusable.
| Quadrant | # 1 sec bins | Bins with >0 counts | Bins with >2000 counts | High rate bins dominated by noise | Noise dominated (total time) | Noise dominated (detector-on time) | Marked lightcurve |
|---|---|---|---|---|---|---|---|
| A | 171394 | 144903 | 0 | 0 | 0.00% | 0.00% | 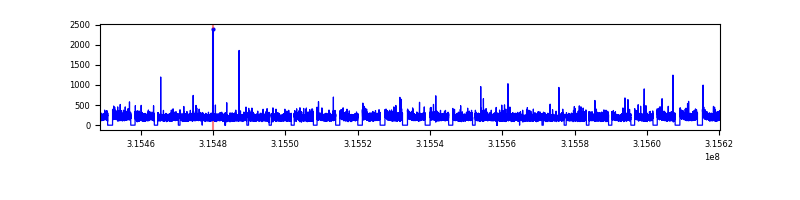 |
| B | 171394 | 144893 | 0 | 0 | 0.00% | 0.00% | 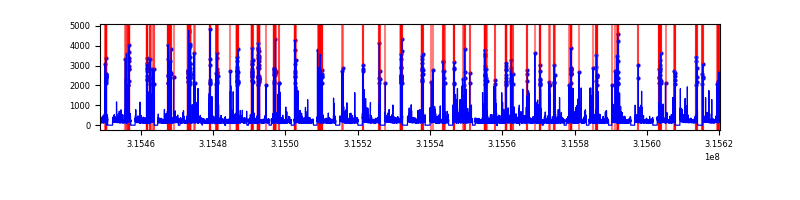 |
| C | 171394 | 144912 | 0 | 0 | 0.00% | 0.00% | 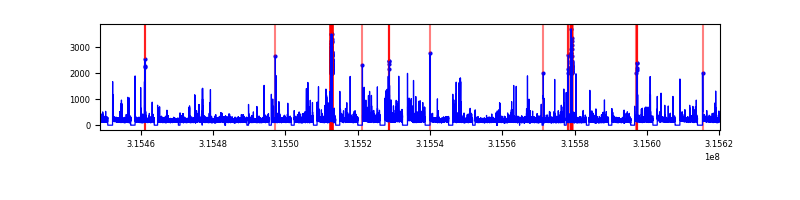 |
| D | 171394 | 144845 | 0 | 0 | 0.00% | 0.00% |  |
Top three noisy pixels from each quadrant. If the there are fewer than three noisy pixels in the level2.evt file, extra rows are filled as -1
| Pixel properties | Quadrant properties | ||||||
|---|---|---|---|---|---|---|---|
| Quadrant | DetID | PixID | Counts | Sigma | Mean | Median | Sigma |
| A | 0 | 29 | 8331 | 11.34 | 2241 | 2109 | 548.5 |
| A | 7 | 110 | 7061 | 9.03 | 2241 | 2109 | 548.5 |
| A | 0 | 30 | 6384 | 7.79 | 2241 | 2109 | 548.5 |
| B | 2 | 9 | 6668 | 10.78 | 2190 | 2100 | 423.7 |
| B | 2 | 8 | 5709 | 8.52 | 2190 | 2100 | 423.7 |
| B | 3 | 17 | 5394 | 7.77 | 2190 | 2100 | 423.7 |
| C | 1 | 81 | 6555 | 7.96 | 2225 | 2091 | 560.7 |
| C | 1 | 80 | 6508 | 7.88 | 2225 | 2091 | 560.7 |
| C | 3 | 234 | 6098 | 7.15 | 2225 | 2091 | 560.7 |
| D | 3 | 14 | 5212 | 6.18 | 2055 | 1871 | 540.2 |
| D | 6 | 231 | 5073 | 5.93 | 2055 | 1871 | 540.2 |
| D | 6 | 67 | 5031 | 5.85 | 2055 | 1871 | 540.2 |
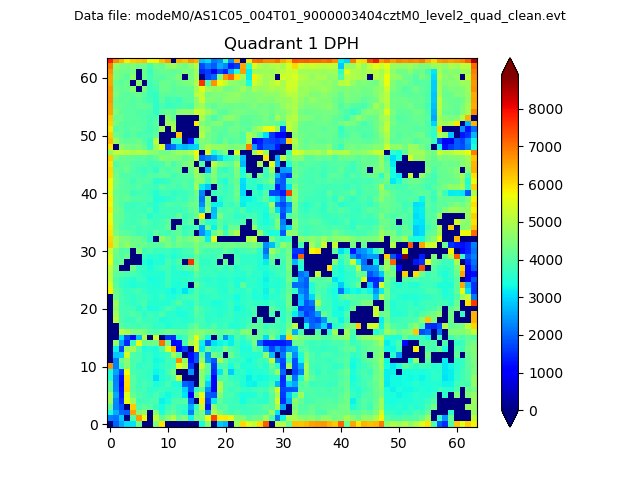
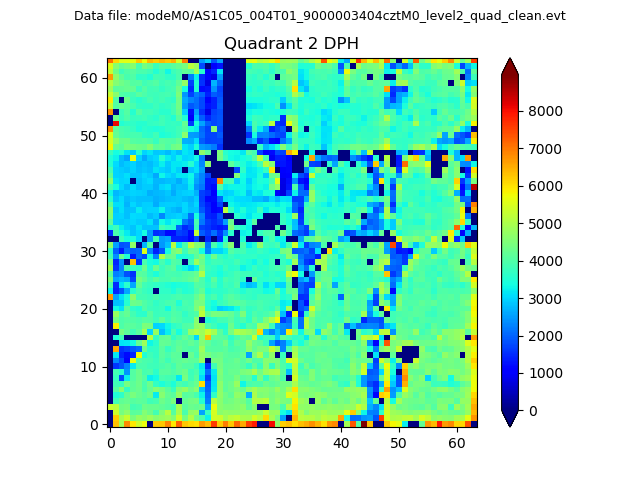
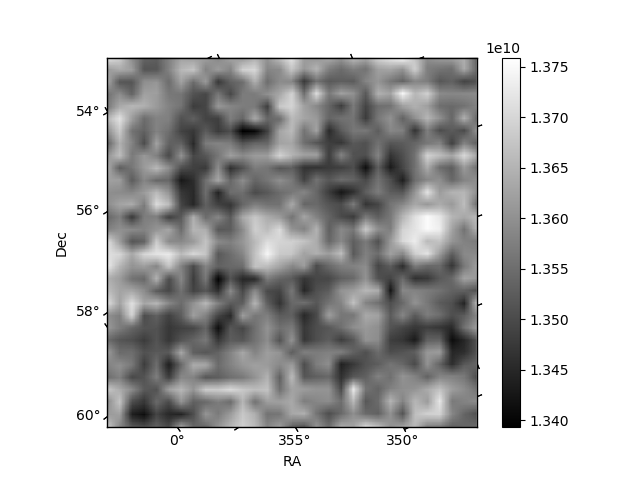
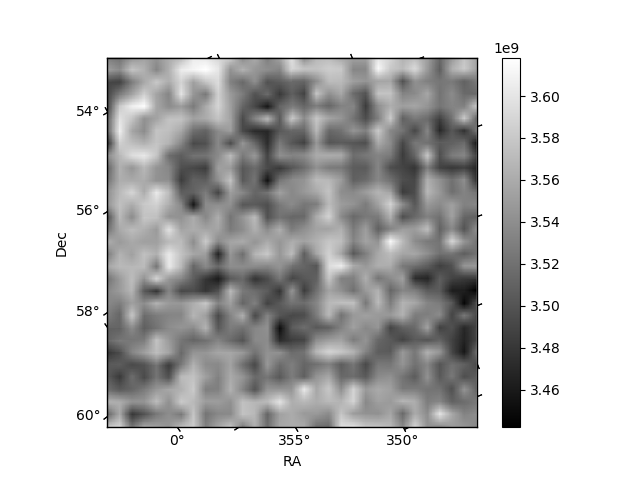
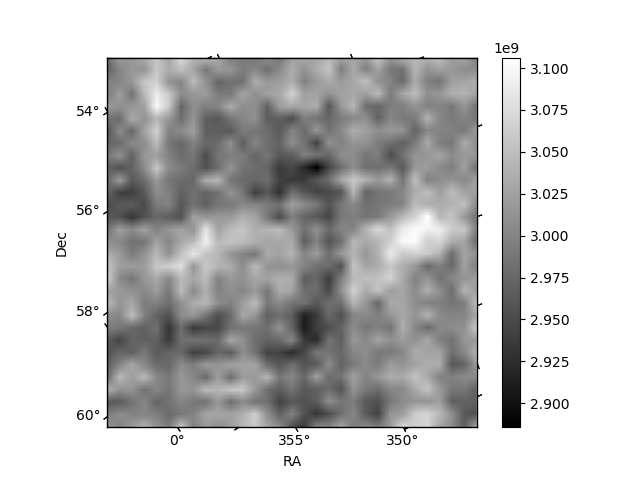
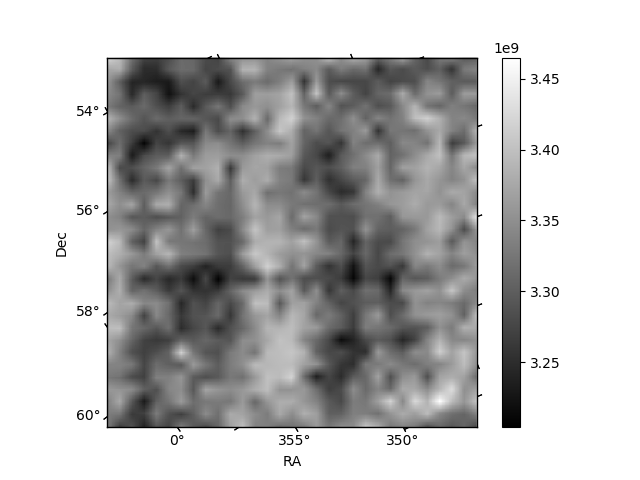
Histogram calculated using DETX and DETY for each event in the final _common_clean file
| Quadrant A | 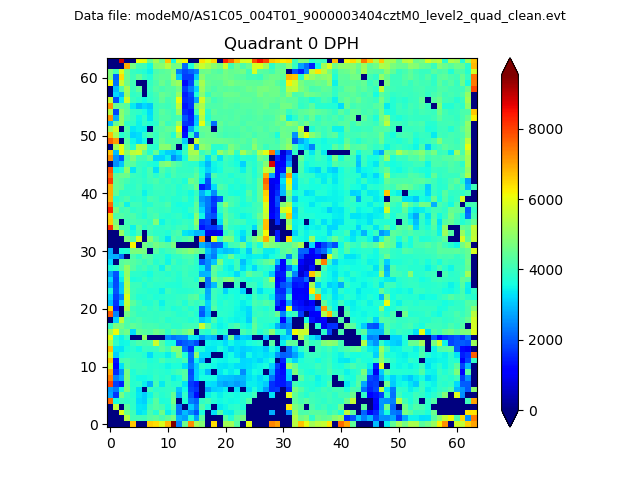 |
 |
Quadrant B |
|---|---|---|---|
| Quadrant D | 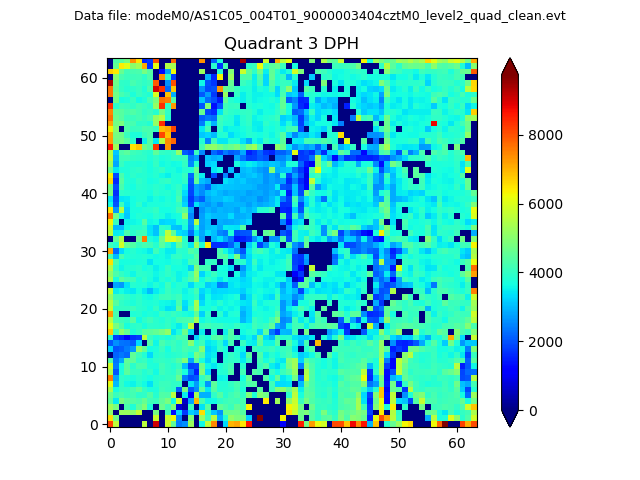 |
 |
Quadrant C |
| Plot type | Count rate plots | Images |
|---|---|---|
| Comparison with Poisson distribution Blue bars denote a histogram of data divided into 1 sec bins. Red curve is a Poisson curve with rate = median count rate of data. |
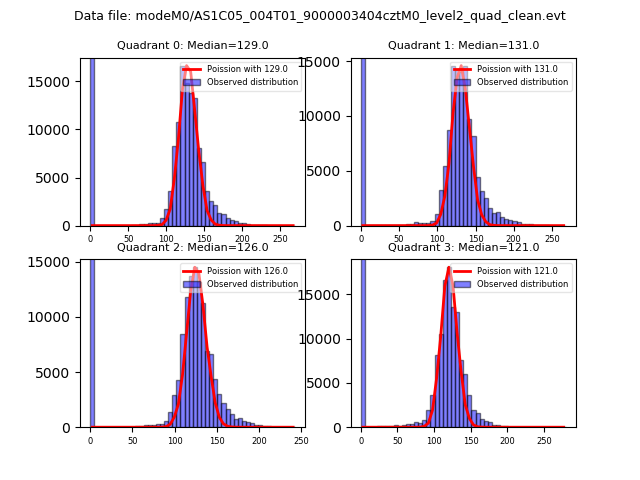 |
 |
| Quadrant-wise count rates Data is divided into 100 sec bins |
 |
|
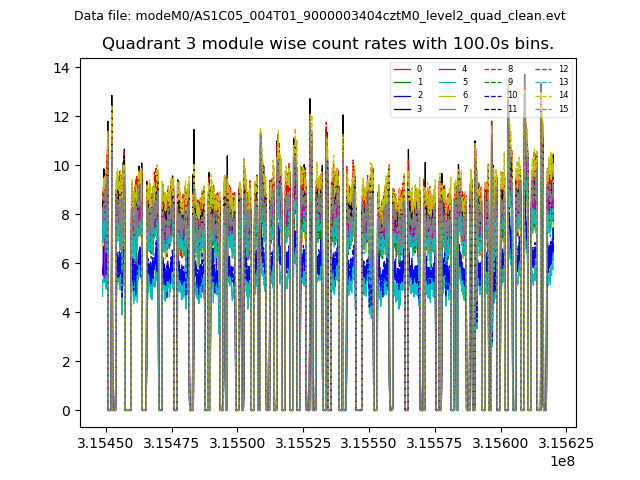
| Module-wise count rates for Quadrant A Data is divided into 100 sec bins |
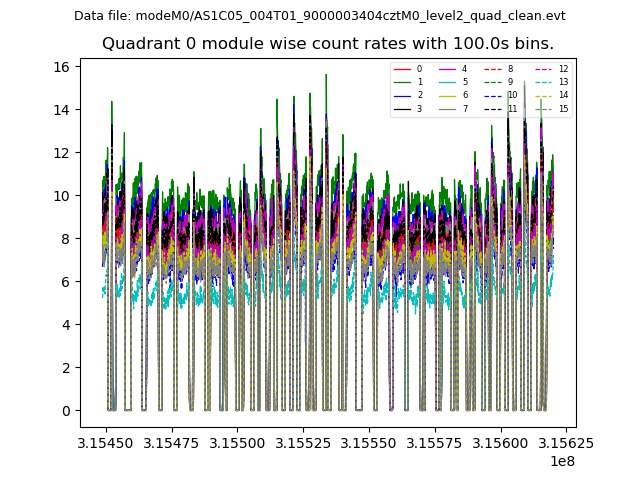 |
 |
| Module-wise count rates for Quadrant B Data is divided into 100 sec bins |
 |
 |
| Module-wise count rates for Quadrant C Data is divided into 100 sec bins |
 |
 |
| Module-wise count rates for Quadrant D Data is divided into 100 sec bins |
 |
 |
| Parameter | Plot |
|---|---|
| CZT HV Monitor | 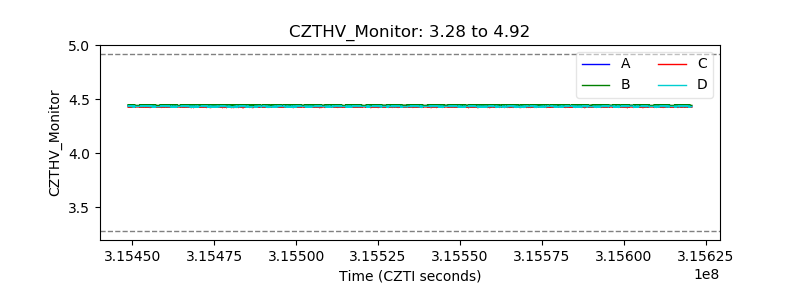 |
| D_VDD | 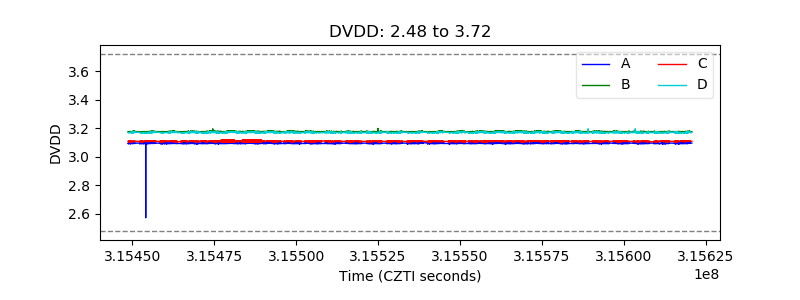 |
| Temperature 1 |  |
| Veto HV Monitor | 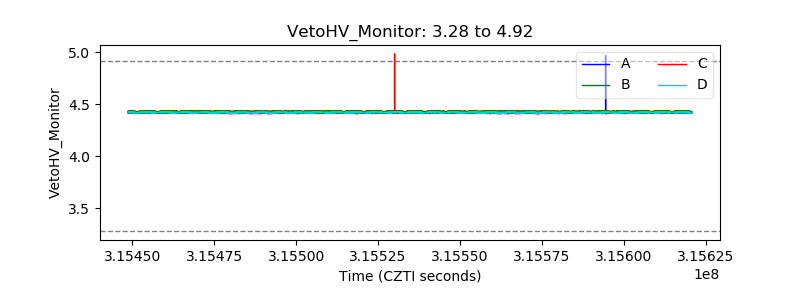 |
| Veto LLD | 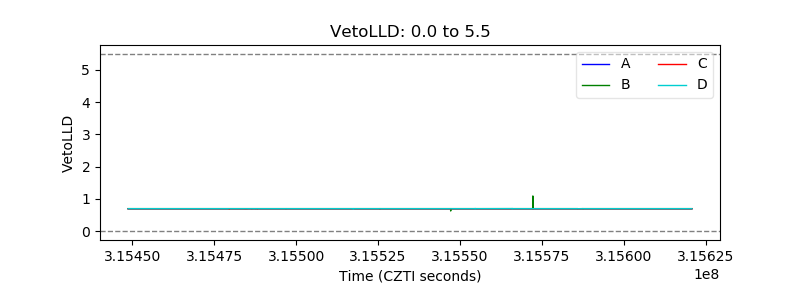 |
| Alpha Counter |  |
| _CPM_Rate |  |
| CZT Counter | 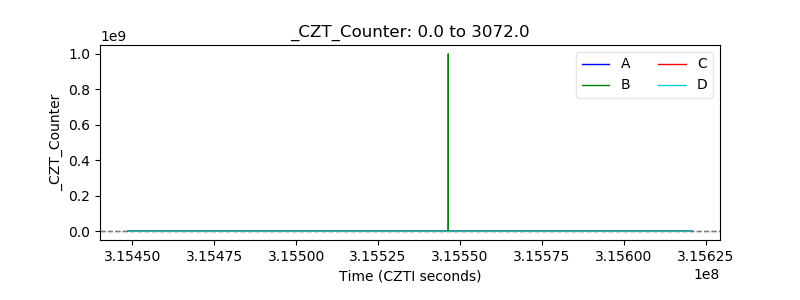 |
| +2.5 Volts monitor | 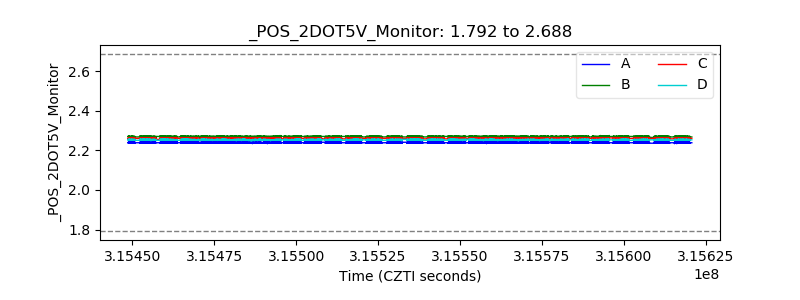 |
| +5 Volts monitor | 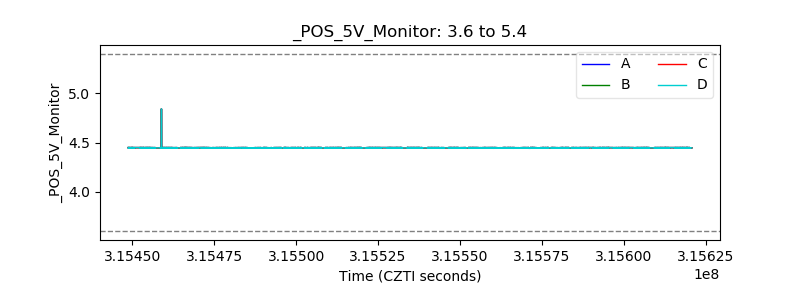 |
| _ROLL_ROT | 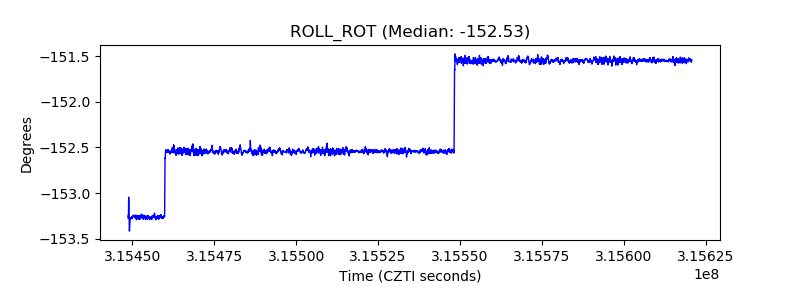 |
| _Roll_DEC | 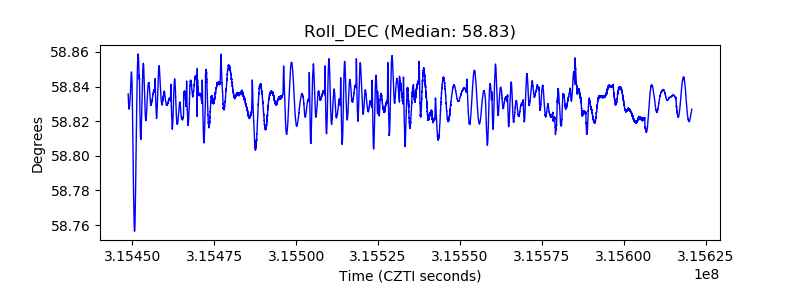 |
| _Roll_RA | 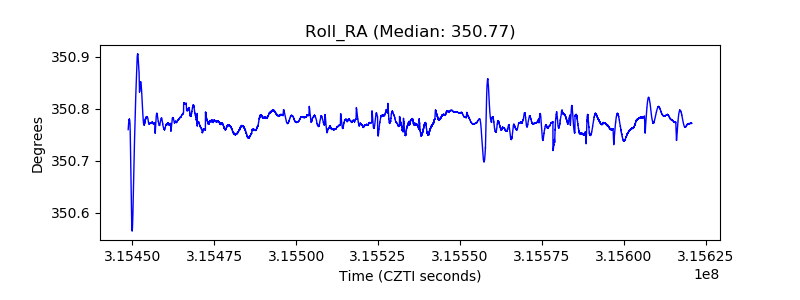 |
| Veto Counter | 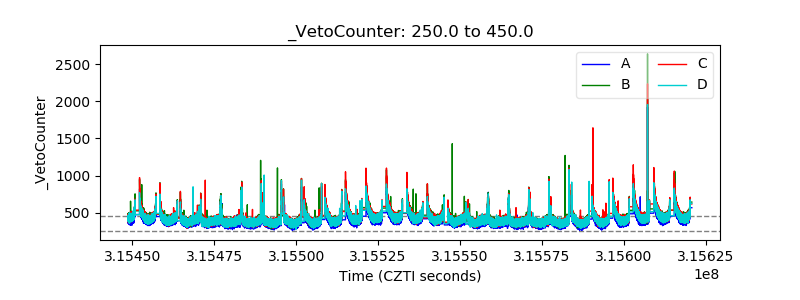 |