| Param | Original file | Final file |
|---|---|---|
| Filename | modeM0/AS1C05_004T01_9000003404_23015cztM0_level2.evt | modeM0/AS1C05_004T01_9000003404_23015cztM0_level2_quad_clean.evt |
| Size (bytes) | 287,026,560 | 54,299,520 |
| Size | 273.7 MB | 51.8 MB |
| Events in quadrant A | 1,875,519 | 352,997 |
| Events in quadrant B | 2,014,968 | 361,367 |
| Events in quadrant C | 1,941,283 | 339,838 |
| Events in quadrant D | 2,604,255 | 324,370 |
| Mode M0 | |||
|---|---|---|---|
| Quadrant | BADHDUFLAG | Total packets | Discarded packets |
| A | 0 | 7861 | 1 |
| B | 0 | 8246 | 4 |
| C | 0 | 8029 | 1 |
| D | 0 | 10248 | 1 |
| Mode SS | |||
|---|---|---|---|
| Quadrant | BADHDUFLAG | Total packets | Discarded packets |
| A | 0 | 78 | 0 |
| B | 0 | 78 | 0 |
| C | 0 | 78 | 0 |
| D | 0 | 78 | 0 |
| Mode M9 | |||
|---|---|---|---|
| Quadrant | BADHDUFLAG | Total packets | Discarded packets |
| A | 0 | 13 | 0 |
| B | 0 | 13 | 0 |
| C | 0 | 13 | 0 |
| D | 0 | 13 | 0 |
| Quadrant | Total seconds | Saturated seconds | Saturation percentage |
|---|---|---|---|
| A | 3754 | 38 | 1.012254% |
| B | 3752 | 75 | 1.998934% |
| C | 3754 | 93 | 2.477357% |
| D | 3754 | 196 | 5.221097% |
Noise dominated data is calculated using 1-second bins in cleaned event files. If a bin has >2000 counts, and if more than 50% of those come from <1% of pixels, then it is considered to be noise-dominated and hence unusable.
| Quadrant | # 1 sec bins | Bins with >0 counts | Bins with >2000 counts | High rate bins dominated by noise | Noise dominated (total time) | Noise dominated (detector-on time) | Marked lightcurve |
|---|---|---|---|---|---|---|---|
| A | 5119 | 3755 | 0 | 0 | 0.00% | 0.00% | 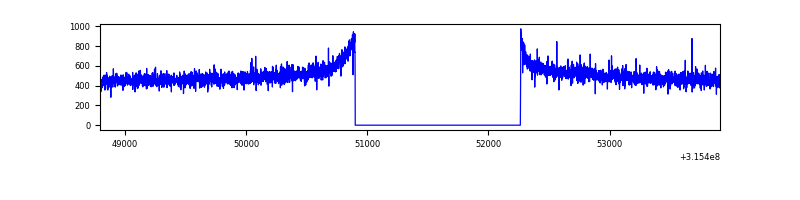 |
| B | 5119 | 3754 | 17 | 17 | 0.33% | 0.45% | 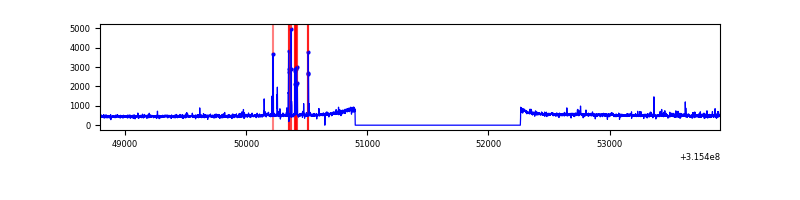 |
| C | 5119 | 3755 | 2 | 2 | 0.04% | 0.05% | 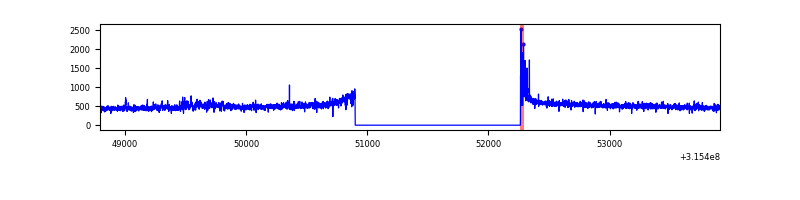 |
| D | 5119 | 3755 | 138 | 138 | 2.70% | 3.68% | 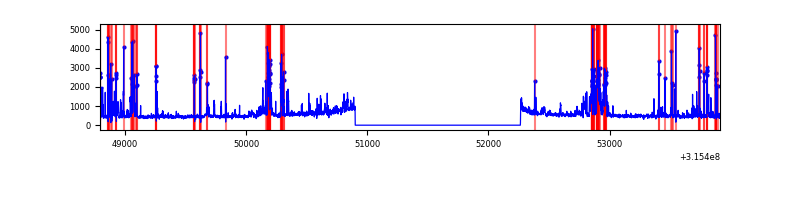 |
Top three noisy pixels from each quadrant. If the there are fewer than three noisy pixels in the level2.evt file, extra rows are filled as -1
| Pixel properties | Quadrant properties | ||||||
|---|---|---|---|---|---|---|---|
| Quadrant | DetID | PixID | Counts | Sigma | Mean | Median | Sigma |
| A | 11 | 47 | 9974 | 97.13 | 484 | 474 | 97.8 |
| A | 13 | 254 | 5220 | 48.52 | 484 | 474 | 97.8 |
| A | 0 | 226 | 4111 | 37.18 | 484 | 474 | 97.8 |
| B | 4 | 216 | 73131 | 805.34 | 483 | 472 | 90.2 |
| B | 6 | 36 | 23325 | 253.3 | 483 | 472 | 90.2 |
| B | 12 | 111 | 10699 | 113.35 | 483 | 472 | 90.2 |
| C | 14 | 238 | 76131 | 706.09 | 463 | 465 | 107.2 |
| C | 9 | 15 | 28976 | 266.05 | 463 | 465 | 107.2 |
| C | 0 | 10 | 27070 | 248.27 | 463 | 465 | 107.2 |
| D | 1 | 52 | 479449 | 4263.32 | 459 | 445 | 112.4 |
| D | 13 | 153 | 162896 | 1445.88 | 459 | 445 | 112.4 |
| D | 1 | 239 | 105629 | 936.18 | 459 | 445 | 112.4 |
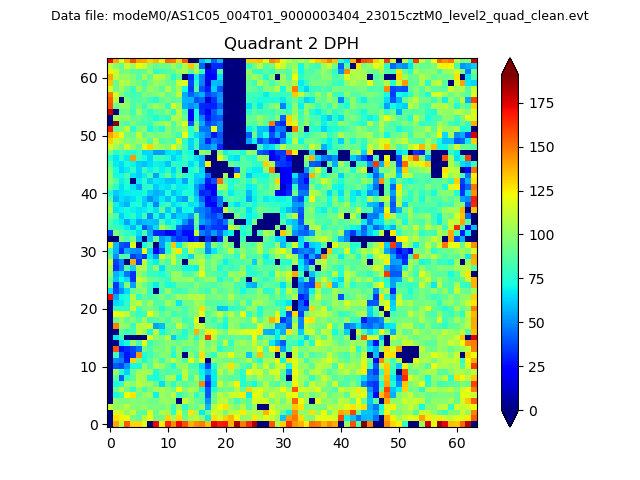
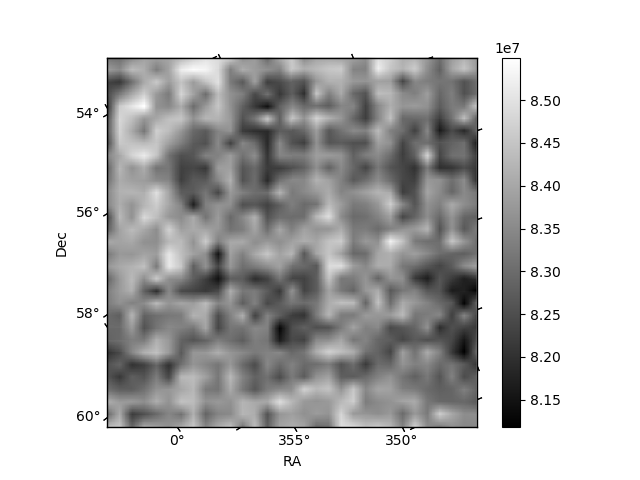
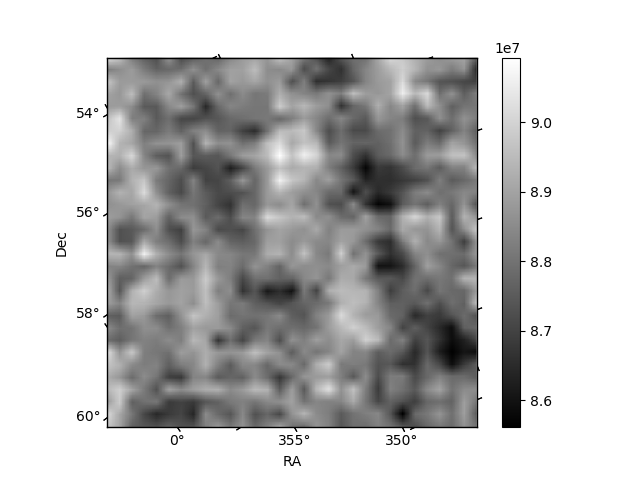
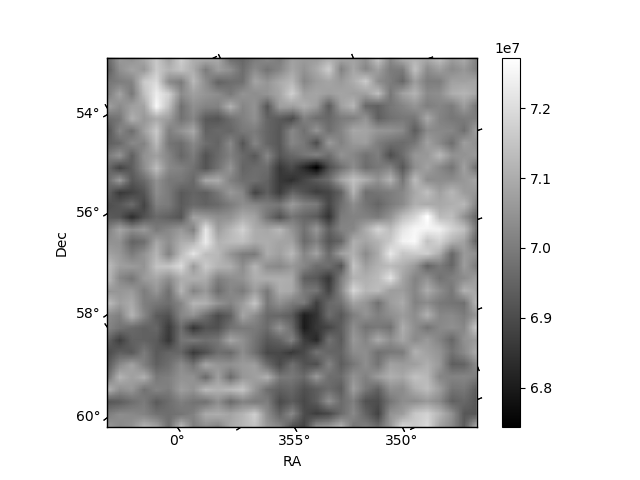
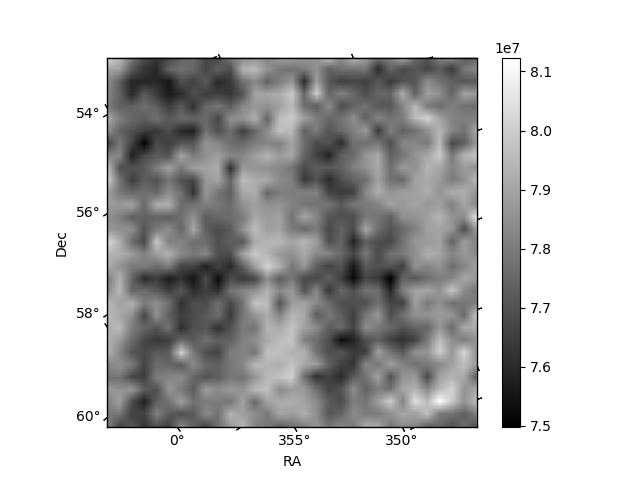
Histogram calculated using DETX and DETY for each event in the final _common_clean file
| Quadrant A | 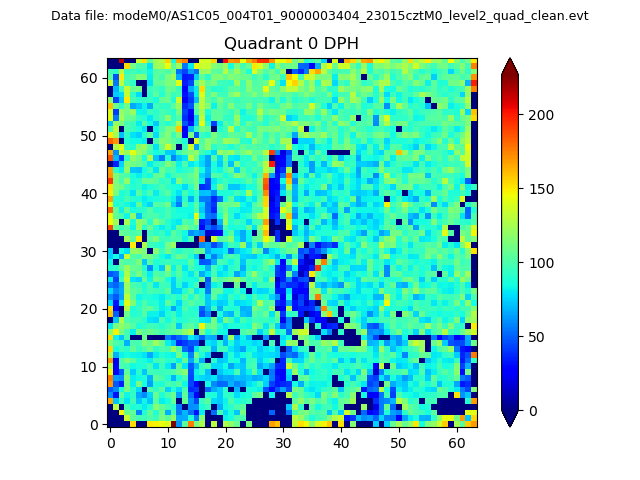 |
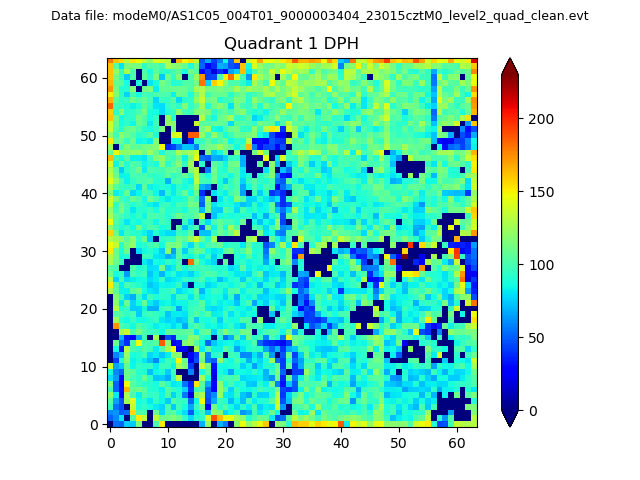 |
Quadrant B |
|---|---|---|---|
| Quadrant D | 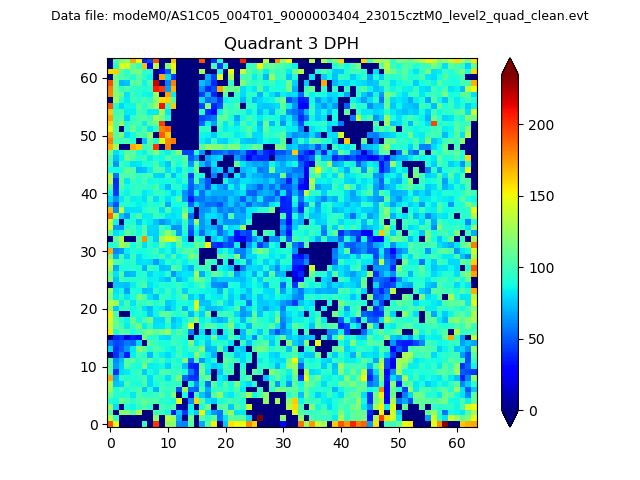 |
 |
Quadrant C |
| Plot type | Count rate plots | Images |
|---|---|---|
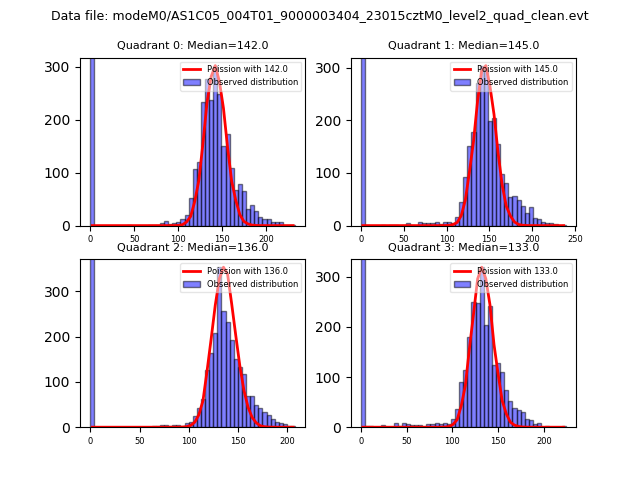
| Comparison with Poisson distribution Blue bars denote a histogram of data divided into 1 sec bins. Red curve is a Poisson curve with rate = median count rate of data. |
 |
 |
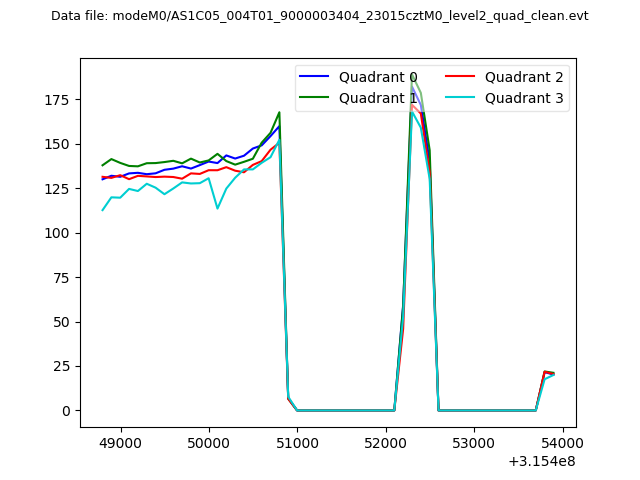
| Quadrant-wise count rates Data is divided into 100 sec bins |
 |
|
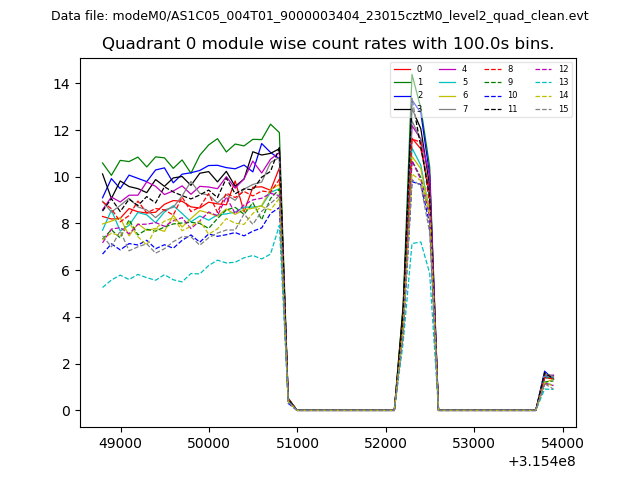
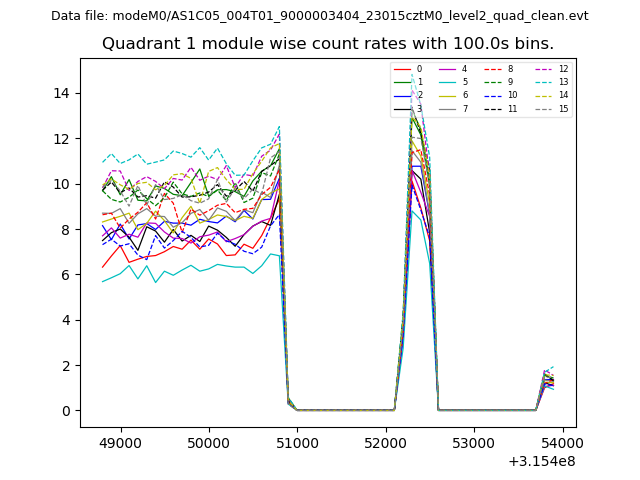
| Module-wise count rates for Quadrant A Data is divided into 100 sec bins |
 |
 |
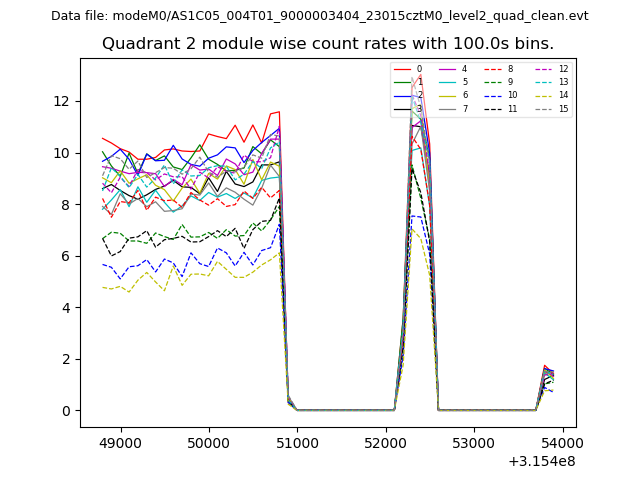
| Module-wise count rates for Quadrant B Data is divided into 100 sec bins |
 |
 |
| Module-wise count rates for Quadrant C Data is divided into 100 sec bins |
 |
 |
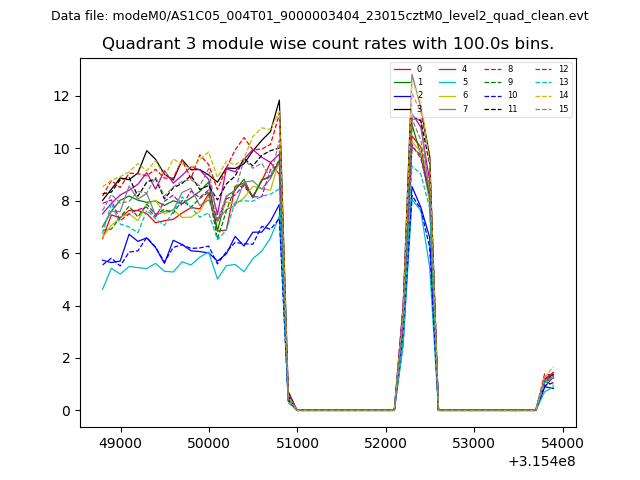
| Module-wise count rates for Quadrant D Data is divided into 100 sec bins |
 |
 |
| Parameter | Plot |
|---|---|
| CZT HV Monitor | 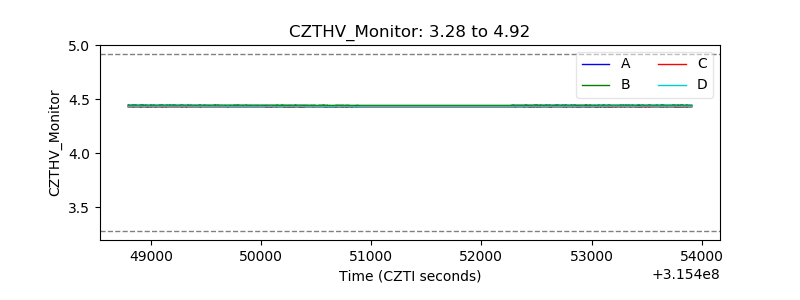 |
| D_VDD | 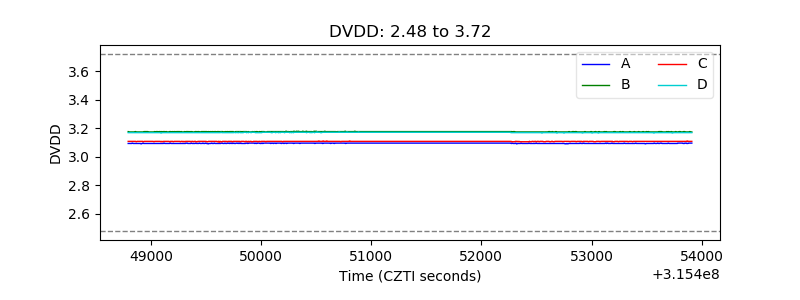 |
| Temperature 1 | 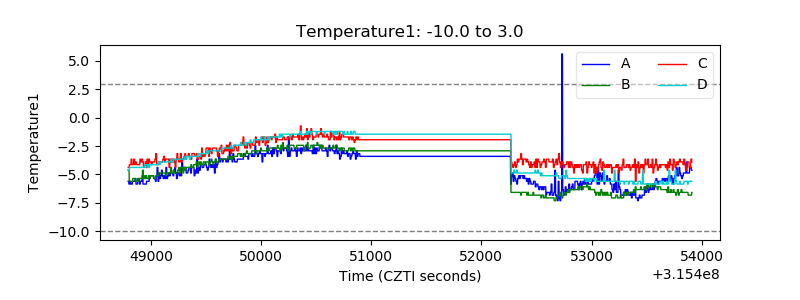 |
| Veto HV Monitor | 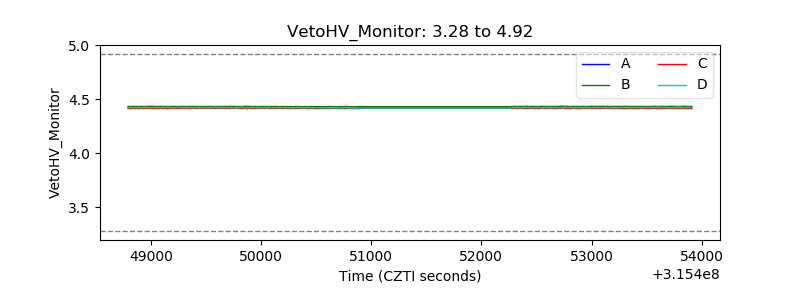 |
| Veto LLD | 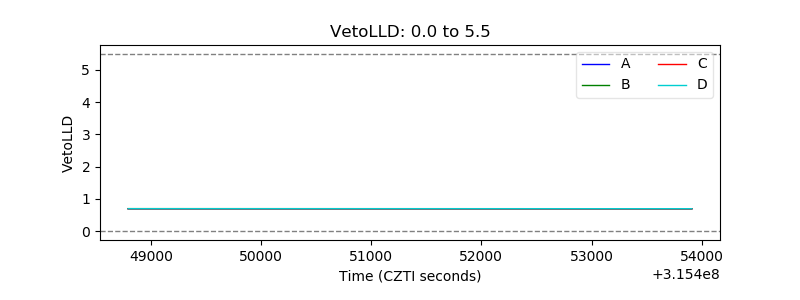 |
| Alpha Counter | 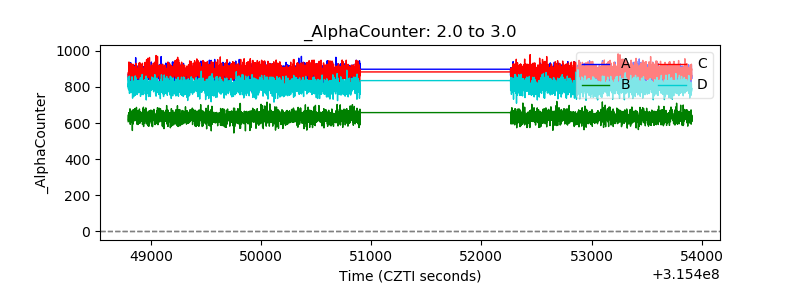 |
| _CPM_Rate | 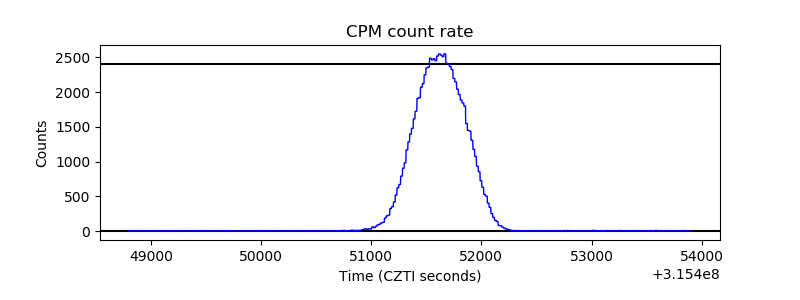 |
| CZT Counter | 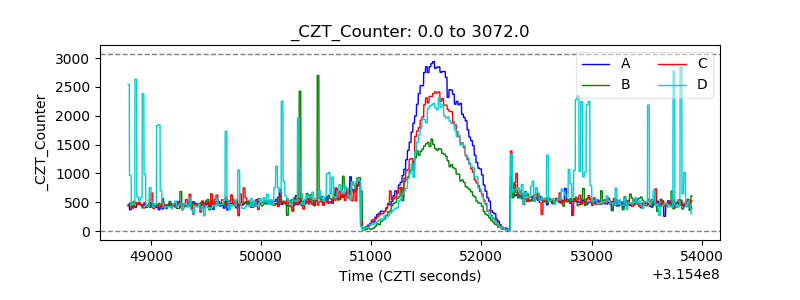 |
| +2.5 Volts monitor |  |
| +5 Volts monitor | 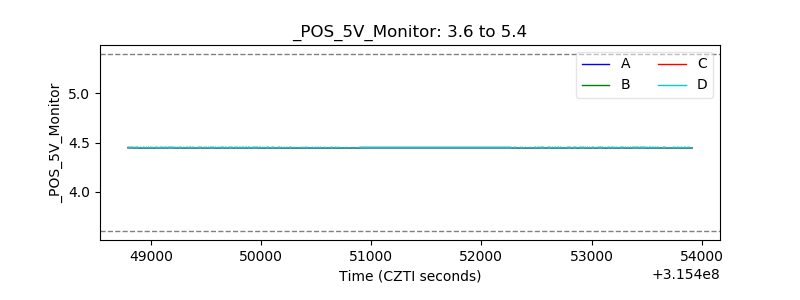 |
| _ROLL_ROT | 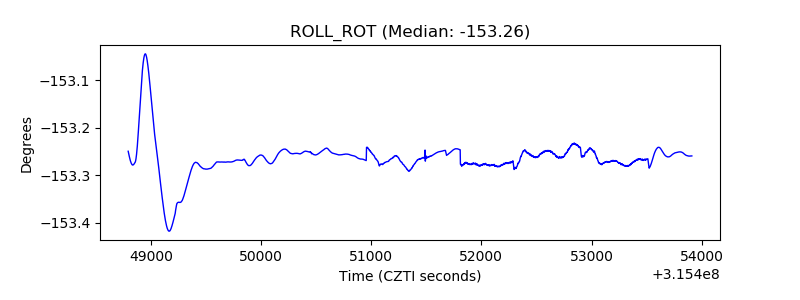 |
| _Roll_DEC | 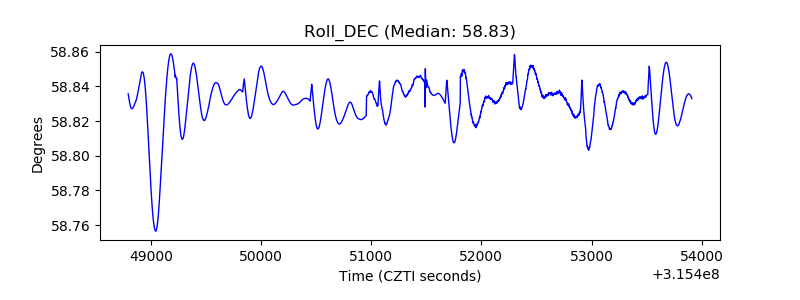 |
| _Roll_RA | 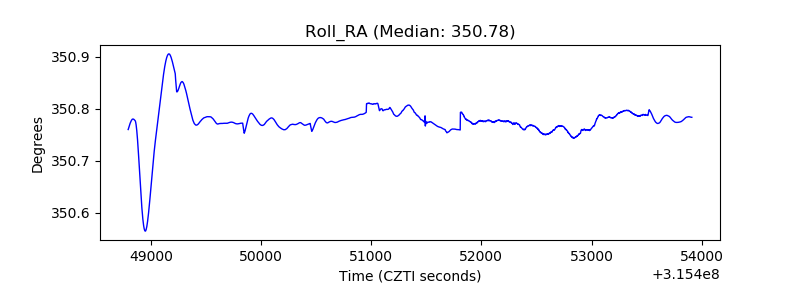 |
| Veto Counter | 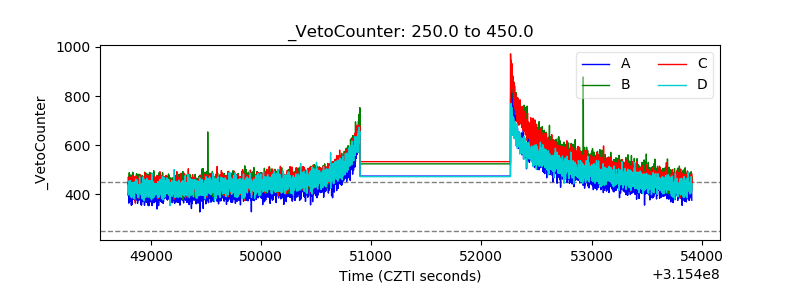 |