| Param | Original file | Final file |
|---|---|---|
| Filename | modeM0/AS1C05_004T01_9000003404_23016cztM0_level2.evt | modeM0/AS1C05_004T01_9000003404_23016cztM0_level2_quad_clean.evt |
| Size (bytes) | 517,452,480 | 86,460,480 |
| Size | 493.5 MB | 82.5 MB |
| Events in quadrant A | 3,212,031 | 555,994 |
| Events in quadrant B | 3,405,262 | 566,024 |
| Events in quadrant C | 3,302,159 | 537,188 |
| Events in quadrant D | 5,308,071 | 503,229 |
| Mode M0 | |||
|---|---|---|---|
| Quadrant | BADHDUFLAG | Total packets | Discarded packets |
| A | 0 | 13642 | 2 |
| B | 0 | 14135 | 2 |
| C | 0 | 13895 | 2 |
| D | 0 | 20252 | 2 |
| Mode SS | |||
|---|---|---|---|
| Quadrant | BADHDUFLAG | Total packets | Discarded packets |
| A | 0 | 132 | 0 |
| B | 0 | 132 | 0 |
| C | 0 | 132 | 0 |
| D | 0 | 132 | 0 |
| Mode M9 | |||
|---|---|---|---|
| Quadrant | BADHDUFLAG | Total packets | Discarded packets |
| A | 0 | 13 | 0 |
| B | 0 | 14 | 0 |
| C | 0 | 14 | 0 |
| D | 0 | 14 | 0 |
| Quadrant | Total seconds | Saturated seconds | Saturation percentage |
|---|---|---|---|
| A | 6537 | 91 | 1.392076% |
| B | 6537 | 163 | 2.493499% |
| C | 6537 | 165 | 2.524094% |
| D | 6537 | 493 | 7.541686% |
Noise dominated data is calculated using 1-second bins in cleaned event files. If a bin has >2000 counts, and if more than 50% of those come from <1% of pixels, then it is considered to be noise-dominated and hence unusable.
| Quadrant | # 1 sec bins | Bins with >0 counts | Bins with >2000 counts | High rate bins dominated by noise | Noise dominated (total time) | Noise dominated (detector-on time) | Marked lightcurve |
|---|---|---|---|---|---|---|---|
| A | 7747 | 6538 | 0 | 0 | 0.00% | 0.00% | 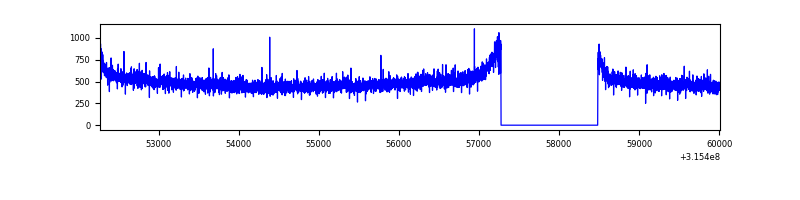 |
| B | 7747 | 6538 | 23 | 23 | 0.30% | 0.35% | 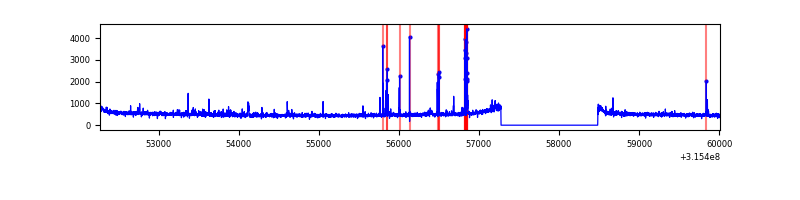 |
| C | 7747 | 6538 | 4 | 4 | 0.05% | 0.06% | 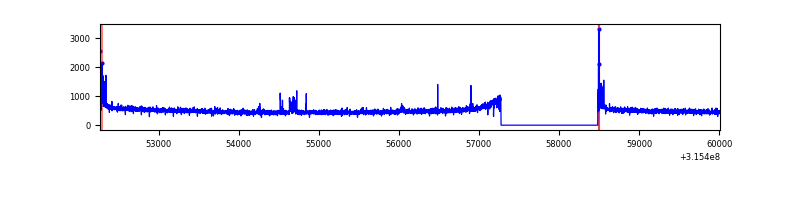 |
| D | 7747 | 6538 | 522 | 522 | 6.74% | 7.98% | 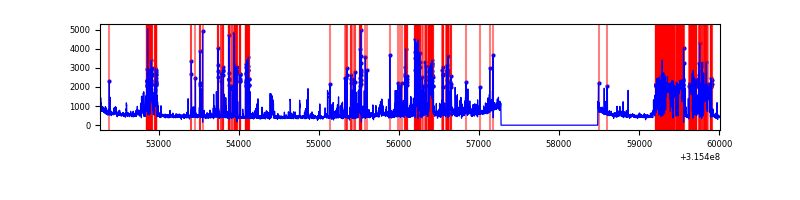 |
Top three noisy pixels from each quadrant. If the there are fewer than three noisy pixels in the level2.evt file, extra rows are filled as -1
| Pixel properties | Quadrant properties | ||||||
|---|---|---|---|---|---|---|---|
| Quadrant | DetID | PixID | Counts | Sigma | Mean | Median | Sigma |
| A | 11 | 47 | 34193 | 204.04 | 825 | 807 | 163.6 |
| A | 13 | 254 | 9154 | 51.01 | 825 | 807 | 163.6 |
| A | 0 | 226 | 7008 | 37.9 | 825 | 807 | 163.6 |
| B | 4 | 216 | 107330 | 698.23 | 825 | 807 | 152.6 |
| B | 6 | 36 | 25070 | 159.04 | 825 | 807 | 152.6 |
| B | 12 | 111 | 18517 | 116.08 | 825 | 807 | 152.6 |
| C | 14 | 238 | 128655 | 698.63 | 790 | 796 | 183.0 |
| C | 0 | 10 | 52785 | 284.07 | 790 | 796 | 183.0 |
| C | 10 | 9 | 24002 | 126.8 | 790 | 796 | 183.0 |
| D | 1 | 52 | 2004306 | 10705.06 | 777 | 753 | 187.2 |
| D | 13 | 153 | 196239 | 1044.49 | 777 | 753 | 187.2 |
| D | 2 | 152 | 78105 | 413.29 | 777 | 753 | 187.2 |
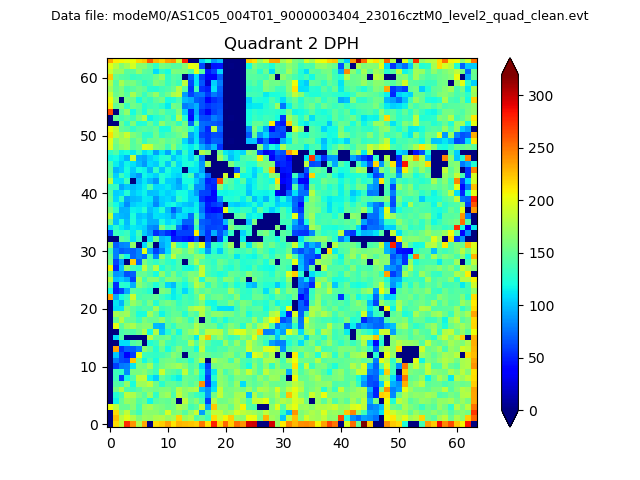
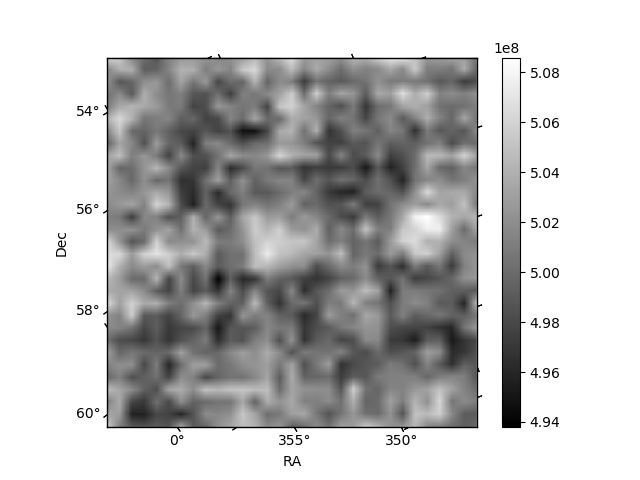
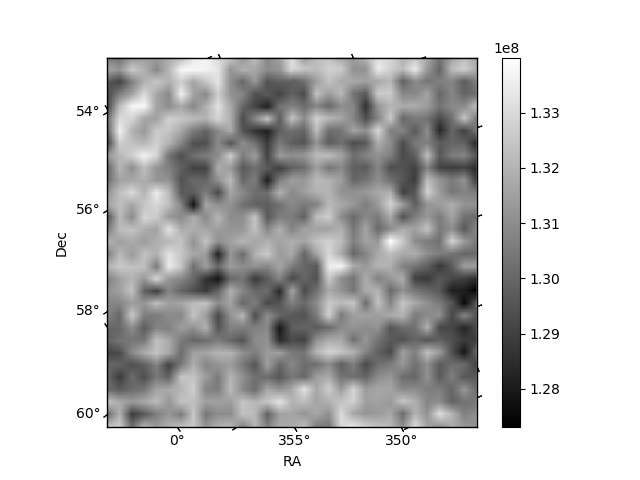
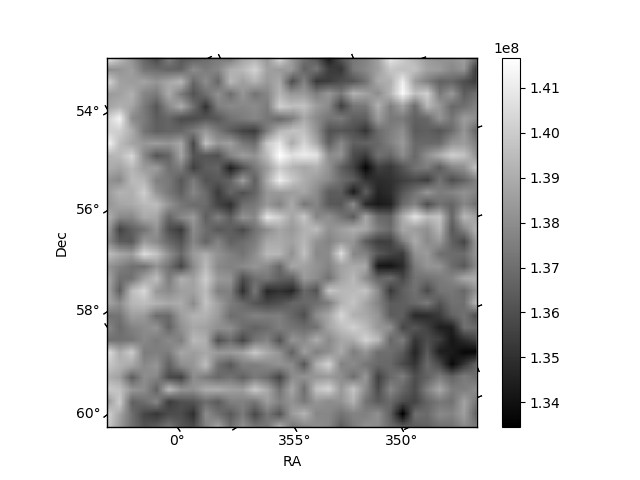
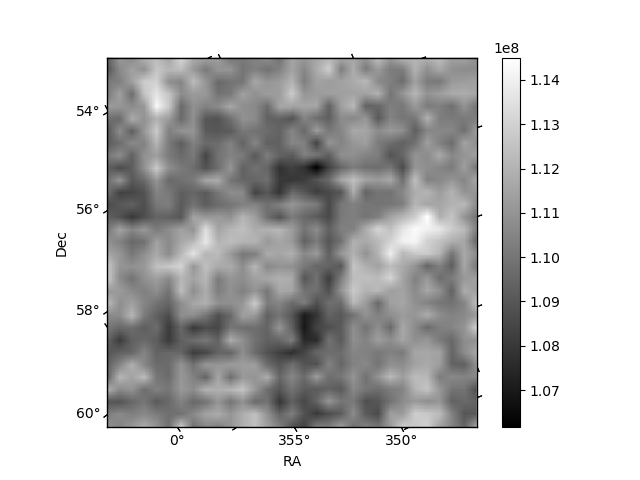
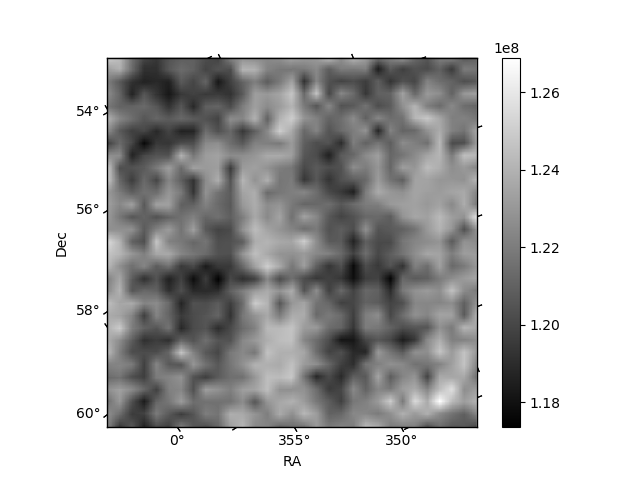
Histogram calculated using DETX and DETY for each event in the final _common_clean file
| Quadrant A | 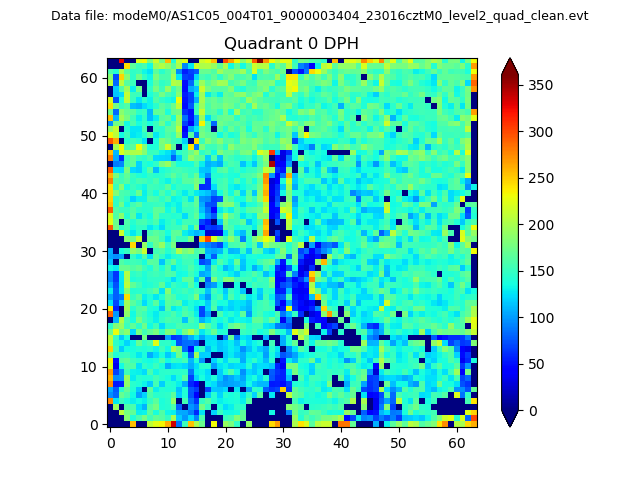 |
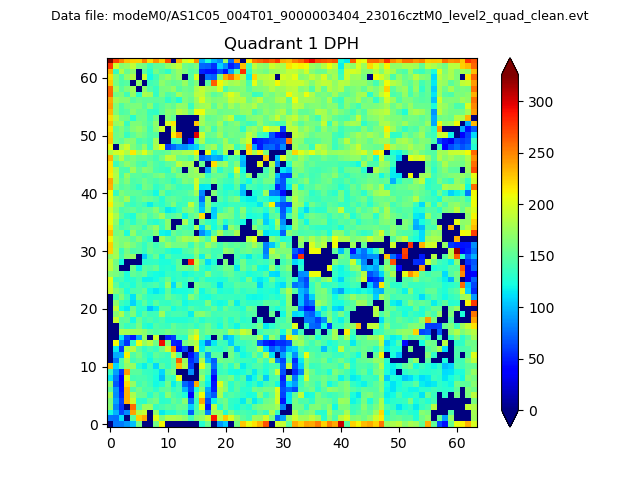 |
Quadrant B |
|---|---|---|---|
| Quadrant D | 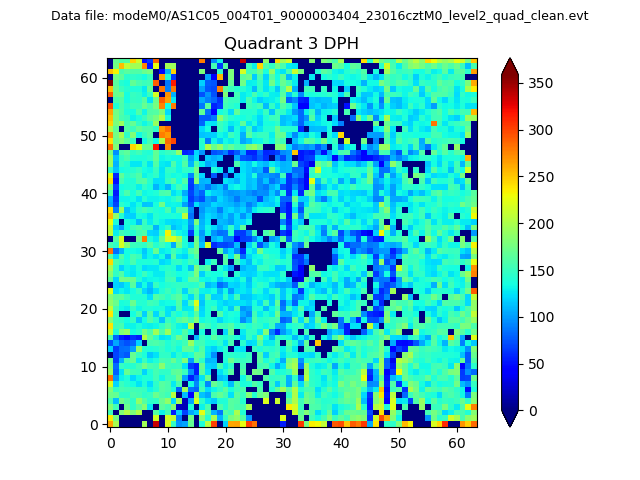 |
 |
Quadrant C |
| Plot type | Count rate plots | Images |
|---|---|---|
| Comparison with Poisson distribution Blue bars denote a histogram of data divided into 1 sec bins. Red curve is a Poisson curve with rate = median count rate of data. |
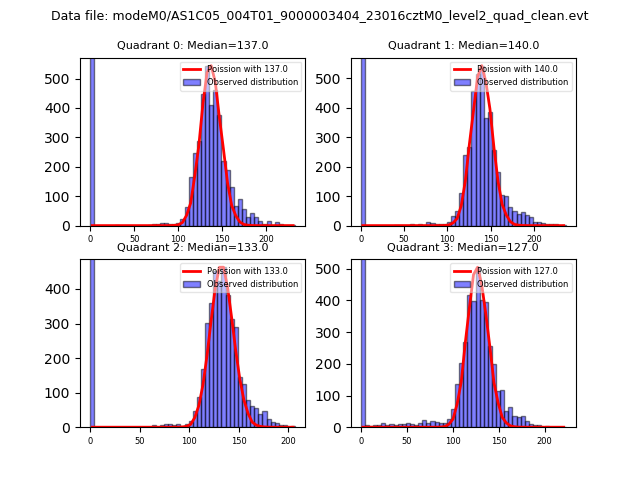 |
 |
| Quadrant-wise count rates Data is divided into 100 sec bins |
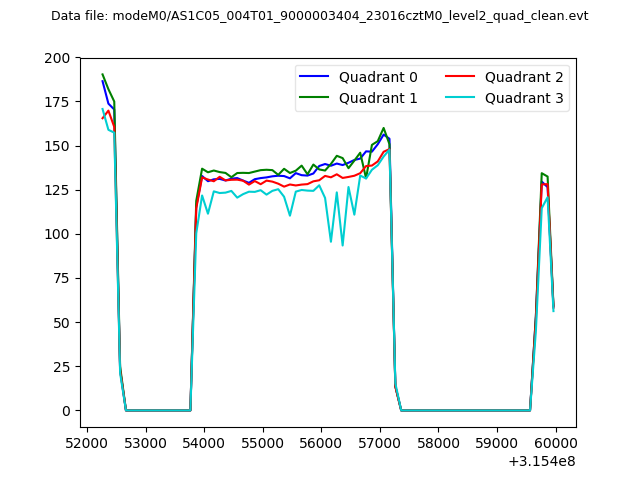 |
|
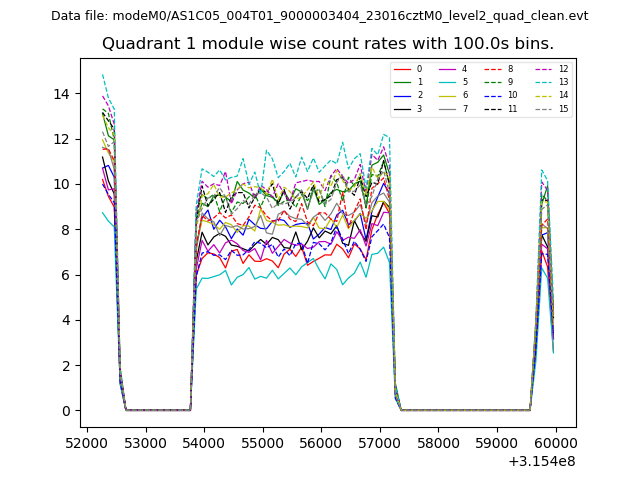
| Module-wise count rates for Quadrant A Data is divided into 100 sec bins |
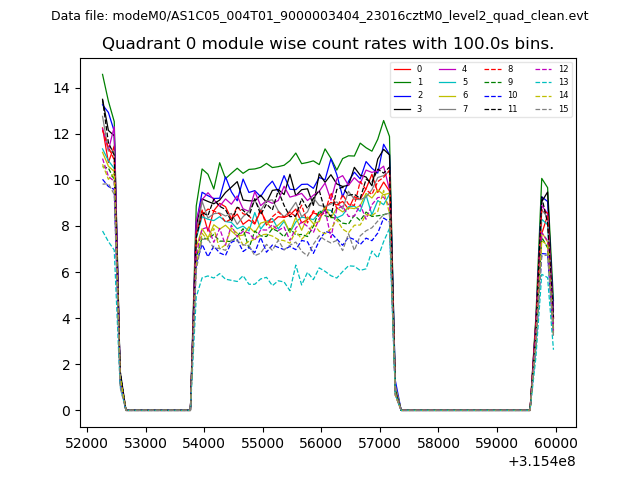 |
 |
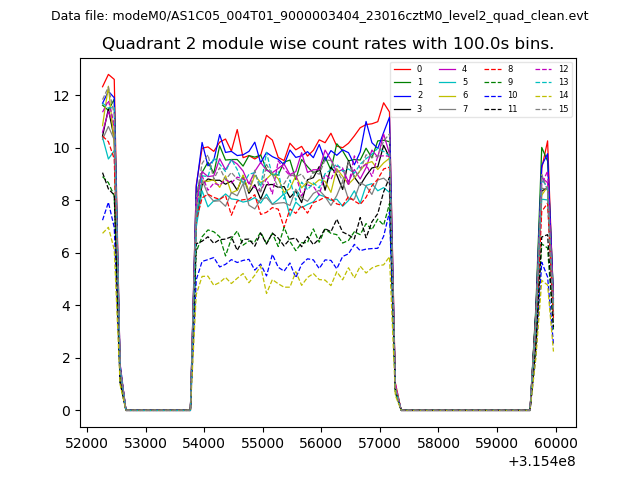
| Module-wise count rates for Quadrant B Data is divided into 100 sec bins |
 |
 |
| Module-wise count rates for Quadrant C Data is divided into 100 sec bins |
 |
 |
| Module-wise count rates for Quadrant D Data is divided into 100 sec bins |
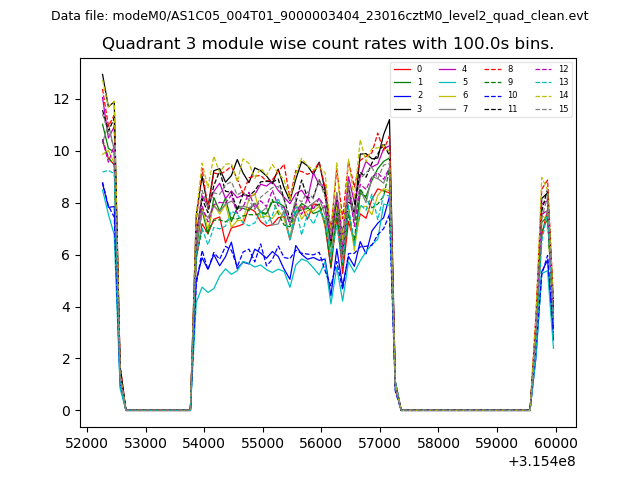 |
 |
| Parameter | Plot |
|---|---|
| CZT HV Monitor | 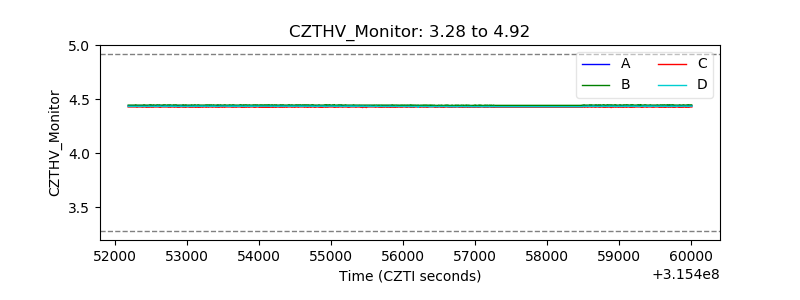 |
| D_VDD | 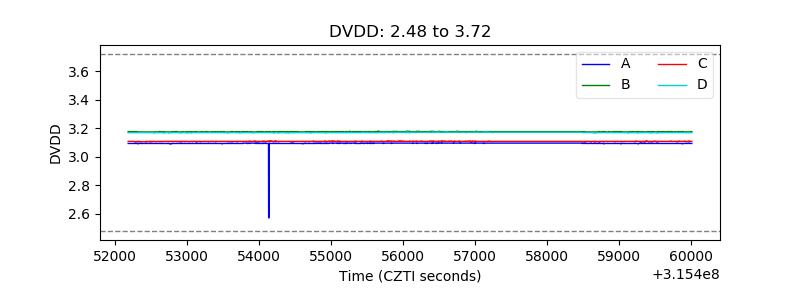 |
| Temperature 1 |  |
| Veto HV Monitor | 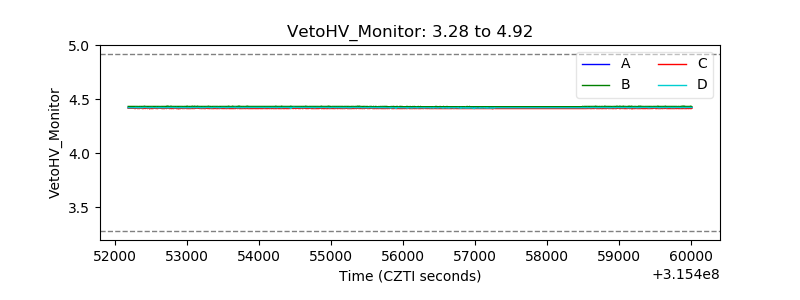 |
| Veto LLD | 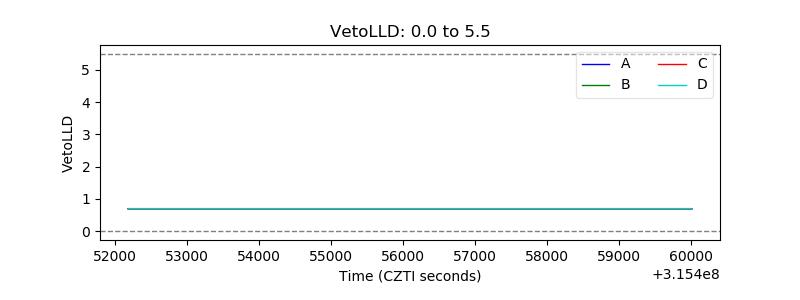 |
| Alpha Counter | 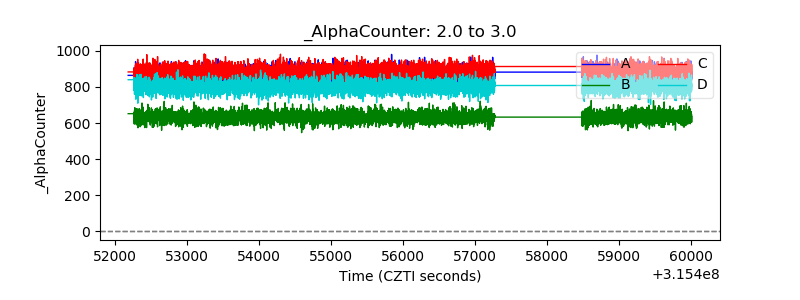 |
| _CPM_Rate | 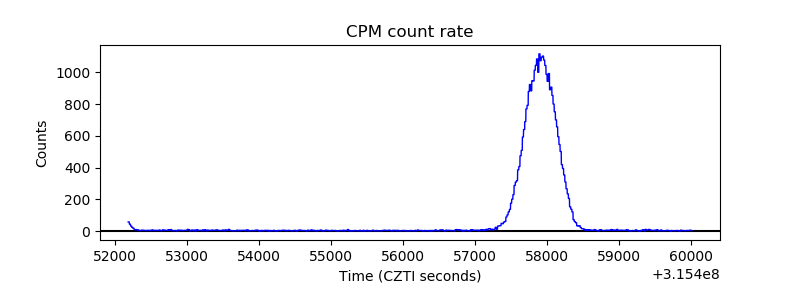 |
| CZT Counter | 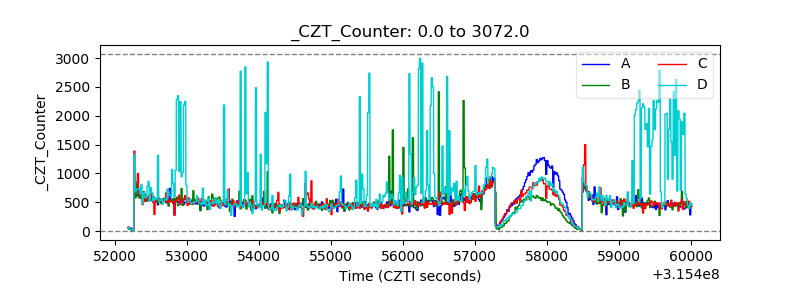 |
| +2.5 Volts monitor |  |
| +5 Volts monitor |  |
| _ROLL_ROT | 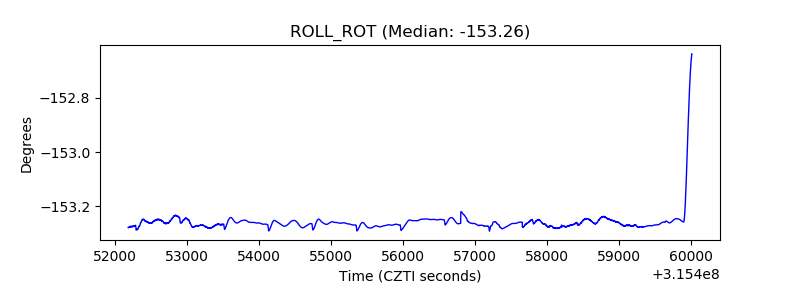 |
| _Roll_DEC |  |
| _Roll_RA | 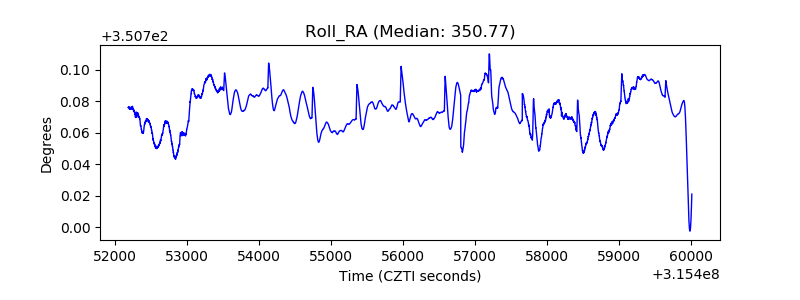 |
| Veto Counter | 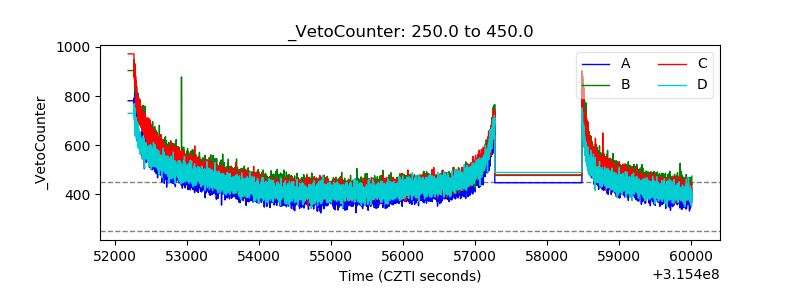 |