| Param | Original file | Final file |
|---|---|---|
| Filename | modeM0/AS1C05_004T01_9000003404_23017cztM0_level2.evt | modeM0/AS1C05_004T01_9000003404_23017cztM0_level2_quad_clean.evt |
| Size (bytes) | 482,719,680 | 92,862,720 |
| Size | 460.4 MB | 88.6 MB |
| Events in quadrant A | 2,881,717 | 607,822 |
| Events in quadrant B | 3,138,331 | 618,712 |
| Events in quadrant C | 3,003,070 | 590,083 |
| Events in quadrant D | 5,173,076 | 560,647 |
| Mode M0 | |||
|---|---|---|---|
| Quadrant | BADHDUFLAG | Total packets | Discarded packets |
| A | 0 | 12704 | 1 |
| B | 0 | 13373 | 1 |
| C | 0 | 12966 | 1 |
| D | 0 | 19537 | 1 |
| Mode SS | |||
|---|---|---|---|
| Quadrant | BADHDUFLAG | Total packets | Discarded packets |
| A | 0 | 126 | 0 |
| B | 0 | 126 | 0 |
| C | 0 | 126 | 0 |
| D | 0 | 126 | 0 |
| Mode M9 | |||
|---|---|---|---|
| Quadrant | BADHDUFLAG | Total packets | Discarded packets |
| A | 0 | 9 | 0 |
| B | 0 | 9 | 0 |
| C | 0 | 9 | 0 |
| D | 0 | 9 | 0 |
| Quadrant | Total seconds | Saturated seconds | Saturation percentage |
|---|---|---|---|
| A | 6232 | 59 | 0.946727% |
| B | 6233 | 113 | 1.812931% |
| C | 6233 | 104 | 1.668538% |
| D | 6233 | 415 | 6.658110% |
Noise dominated data is calculated using 1-second bins in cleaned event files. If a bin has >2000 counts, and if more than 50% of those come from <1% of pixels, then it is considered to be noise-dominated and hence unusable.
| Quadrant | # 1 sec bins | Bins with >0 counts | Bins with >2000 counts | High rate bins dominated by noise | Noise dominated (total time) | Noise dominated (detector-on time) | Marked lightcurve |
|---|---|---|---|---|---|---|---|
| A | 7157 | 6233 | 0 | 0 | 0.00% | 0.00% | 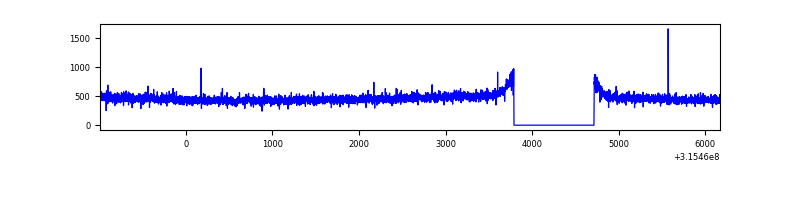 |
| B | 7158 | 6234 | 27 | 27 | 0.38% | 0.43% | 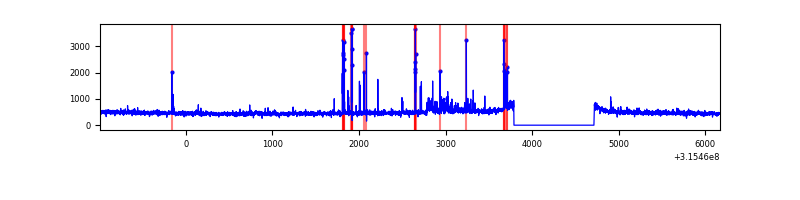 |
| C | 7158 | 6234 | 8 | 8 | 0.11% | 0.13% | 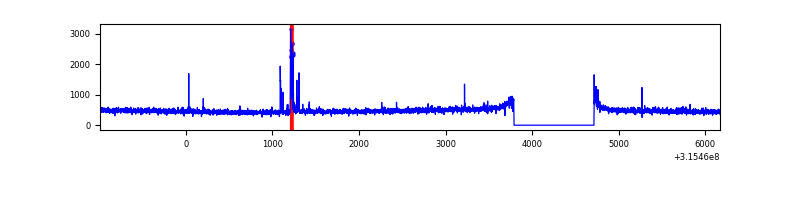 |
| D | 7158 | 6234 | 558 | 558 | 7.80% | 8.95% | 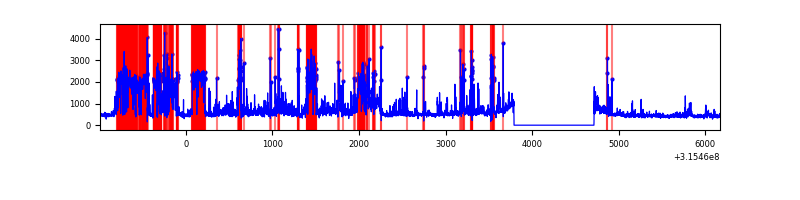 |
Top three noisy pixels from each quadrant. If the there are fewer than three noisy pixels in the level2.evt file, extra rows are filled as -1
| Pixel properties | Quadrant properties | ||||||
|---|---|---|---|---|---|---|---|
| Quadrant | DetID | PixID | Counts | Sigma | Mean | Median | Sigma |
| A | 13 | 254 | 8990 | 55.72 | 747 | 732 | 148.2 |
| A | 3 | 137 | 6494 | 38.88 | 747 | 732 | 148.2 |
| A | 0 | 226 | 6170 | 36.69 | 747 | 732 | 148.2 |
| B | 4 | 216 | 102966 | 724.23 | 746 | 727 | 141.2 |
| B | 7 | 219 | 52190 | 364.55 | 746 | 727 | 141.2 |
| B | 7 | 235 | 26906 | 185.45 | 746 | 727 | 141.2 |
| C | 14 | 238 | 114333 | 685.11 | 715 | 719 | 165.8 |
| C | 10 | 22 | 77686 | 464.12 | 715 | 719 | 165.8 |
| C | 7 | 247 | 11406 | 64.44 | 715 | 719 | 165.8 |
| D | 1 | 52 | 2219192 | 12798.26 | 712 | 689 | 173.3 |
| D | 13 | 153 | 159889 | 918.4 | 712 | 689 | 173.3 |
| D | 13 | 172 | 50860 | 289.43 | 712 | 689 | 173.3 |
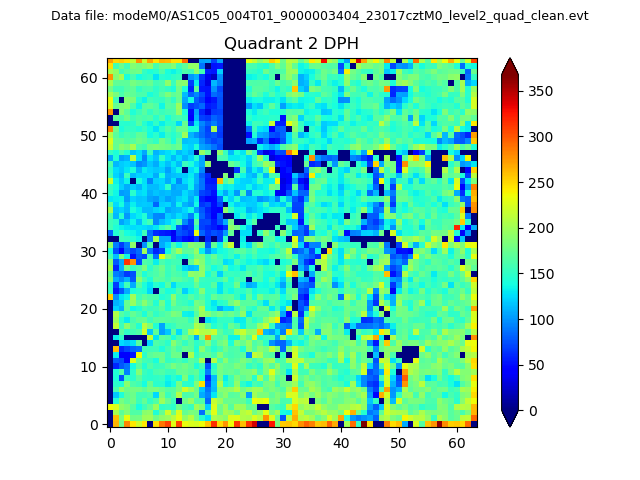
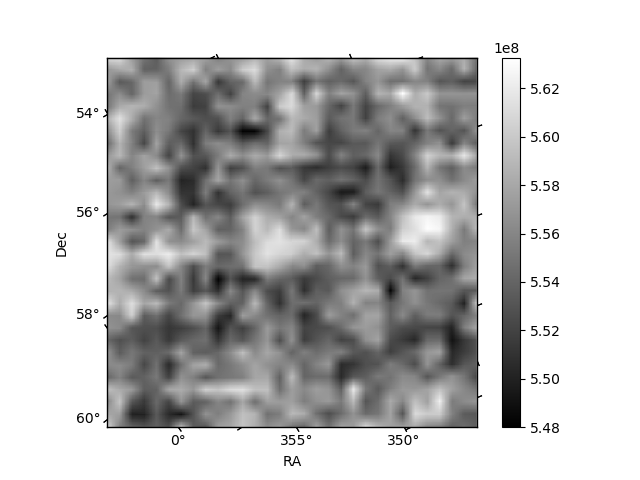
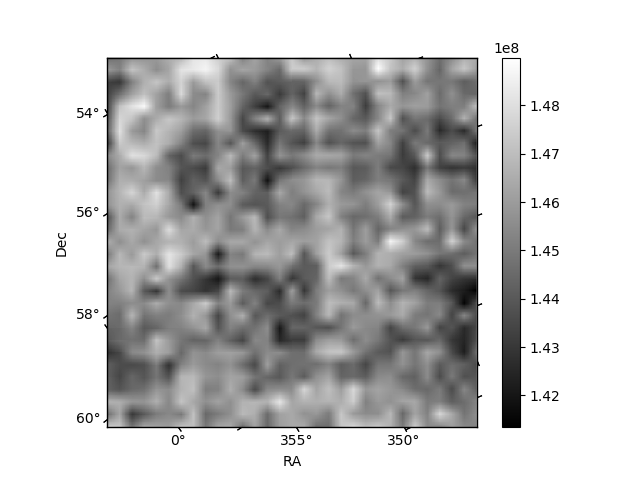
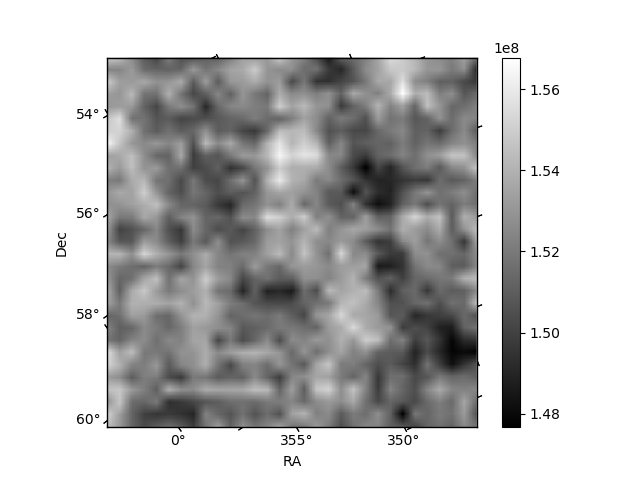
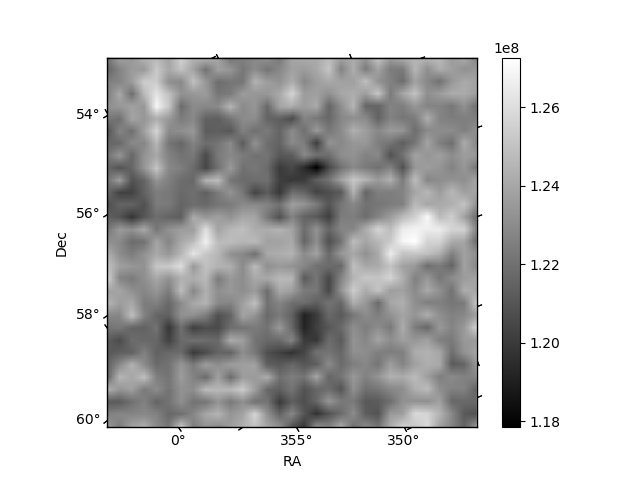
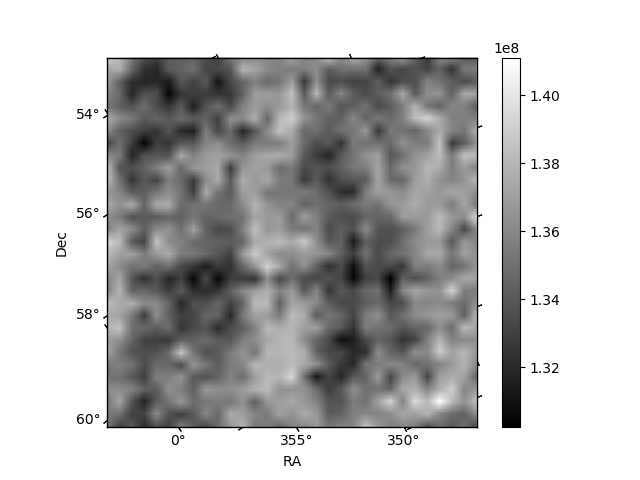
Histogram calculated using DETX and DETY for each event in the final _common_clean file
| Quadrant A | 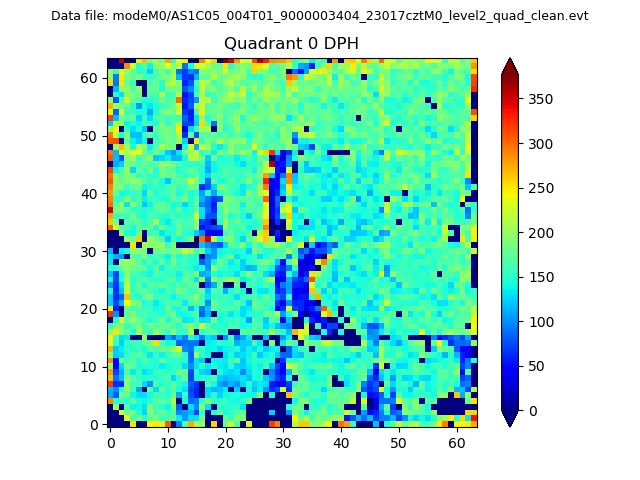 |
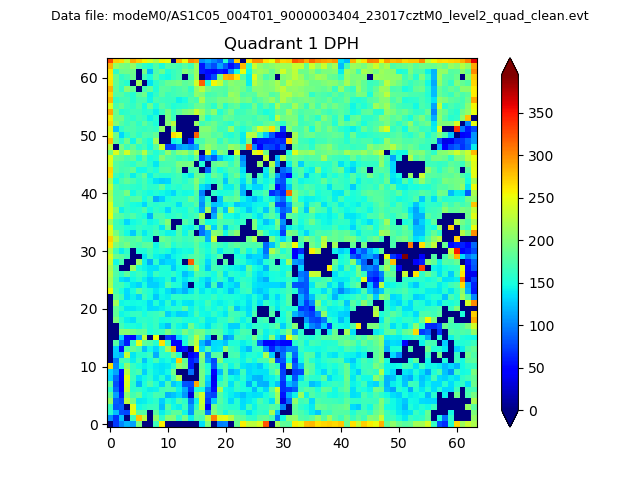 |
Quadrant B |
|---|---|---|---|
| Quadrant D | 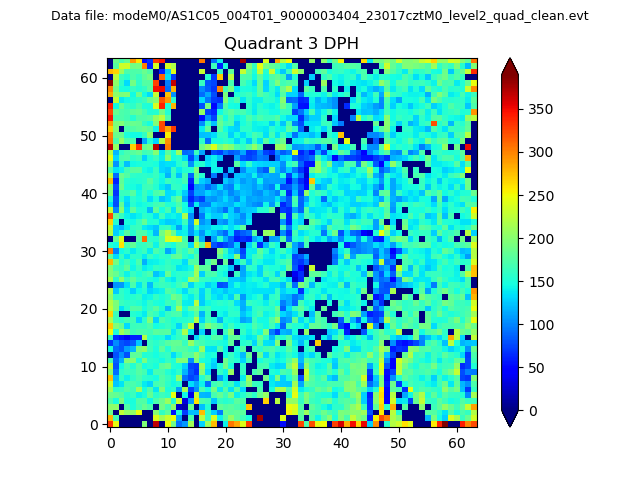 |
 |
Quadrant C |
| Plot type | Count rate plots | Images |
|---|---|---|
| Comparison with Poisson distribution Blue bars denote a histogram of data divided into 1 sec bins. Red curve is a Poisson curve with rate = median count rate of data. |
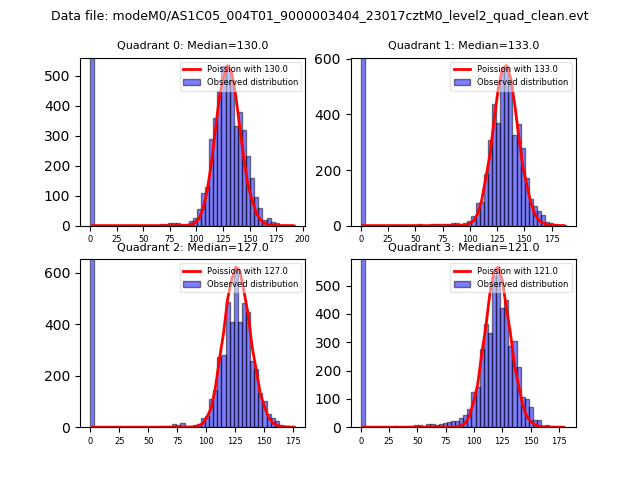 |
 |
| Quadrant-wise count rates Data is divided into 100 sec bins |
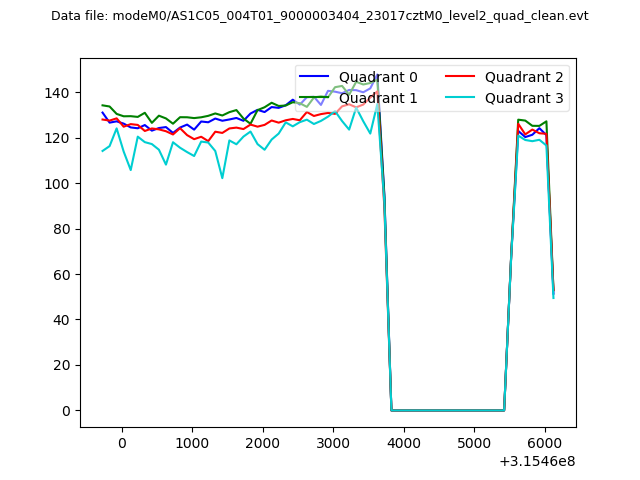 |
|
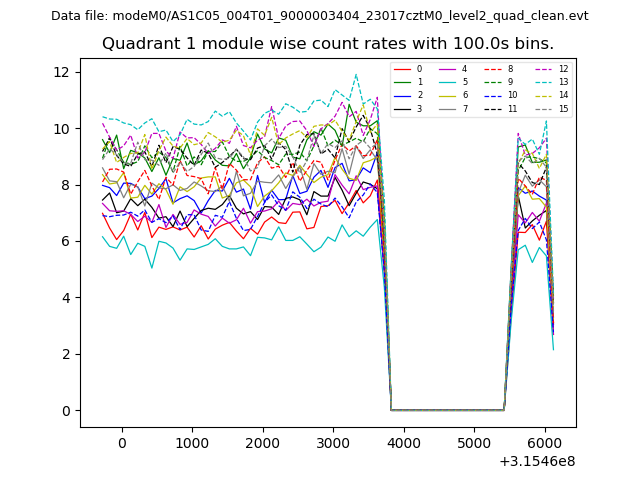
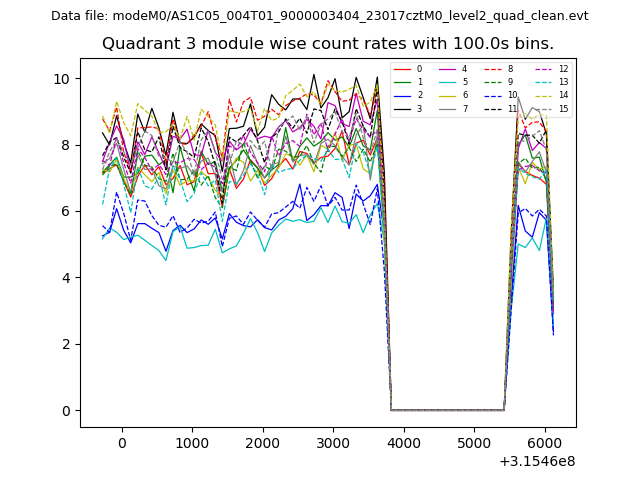
| Module-wise count rates for Quadrant A Data is divided into 100 sec bins |
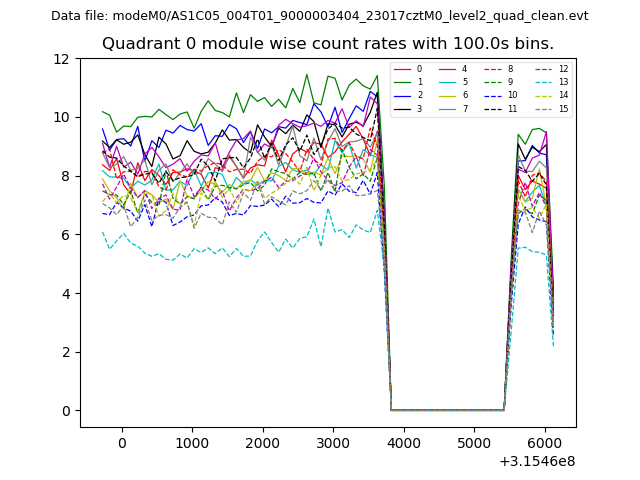 |
 |
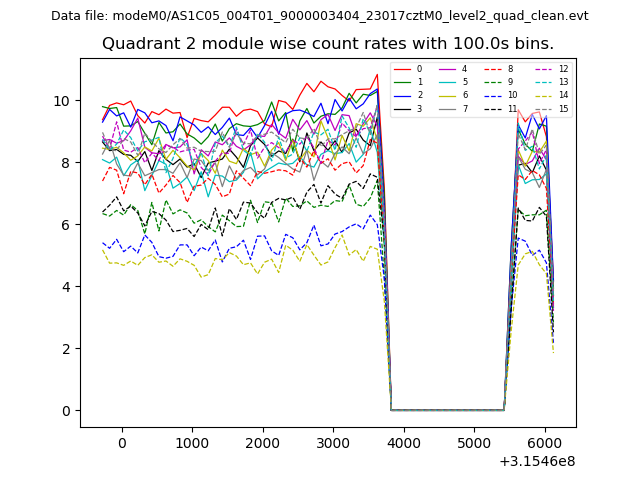
| Module-wise count rates for Quadrant B Data is divided into 100 sec bins |
 |
 |
| Module-wise count rates for Quadrant C Data is divided into 100 sec bins |
 |
 |
| Module-wise count rates for Quadrant D Data is divided into 100 sec bins |
 |
 |
| Parameter | Plot |
|---|---|
| CZT HV Monitor | 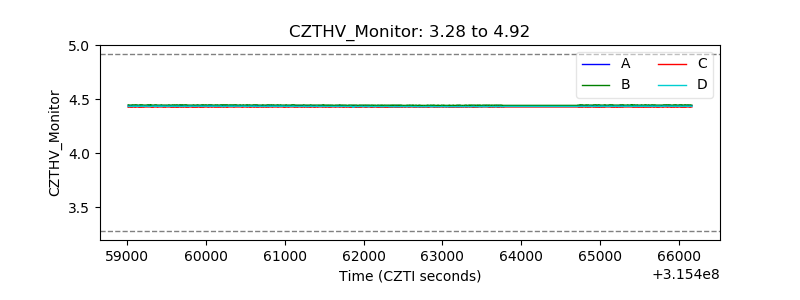 |
| D_VDD |  |
| Temperature 1 | 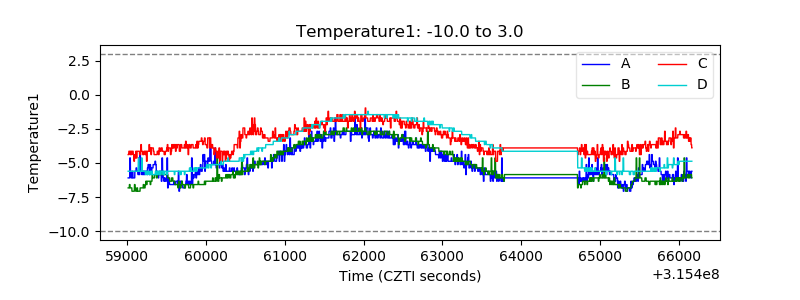 |
| Veto HV Monitor | 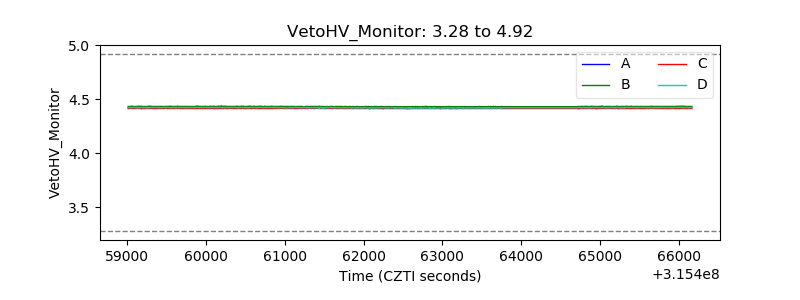 |
| Veto LLD | 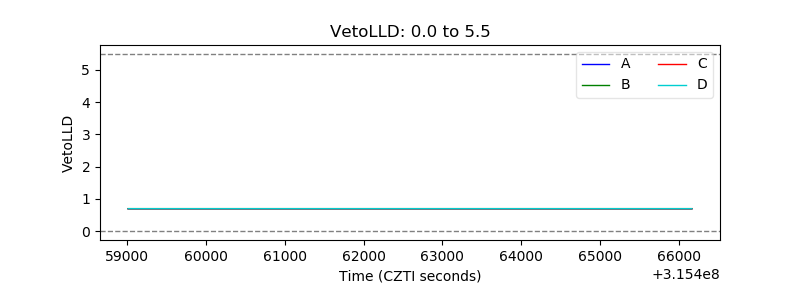 |
| Alpha Counter | 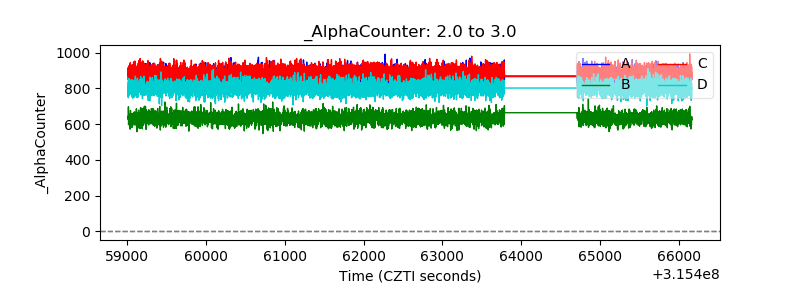 |
| _CPM_Rate | 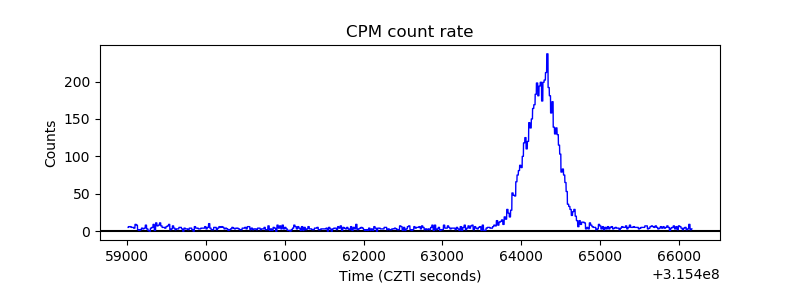 |
| CZT Counter | 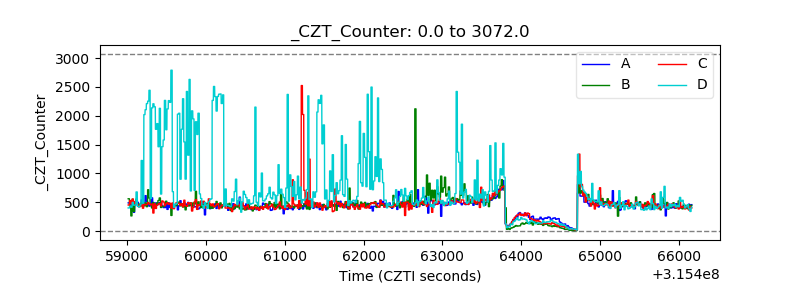 |
| +2.5 Volts monitor |  |
| +5 Volts monitor |  |
| _ROLL_ROT | 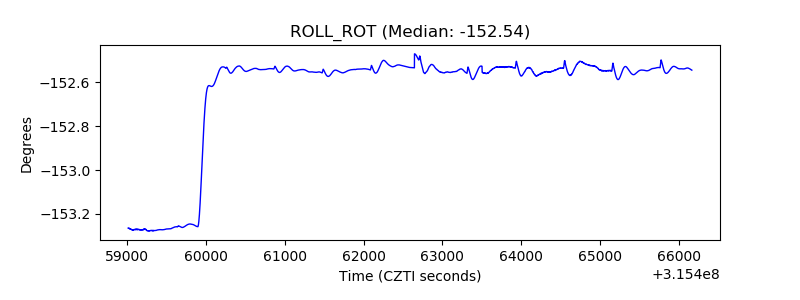 |
| _Roll_DEC | 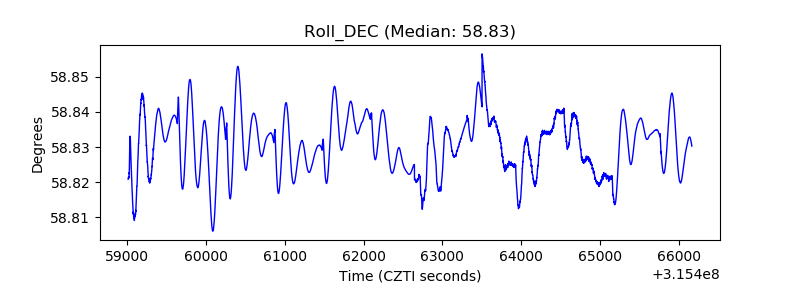 |
| _Roll_RA | 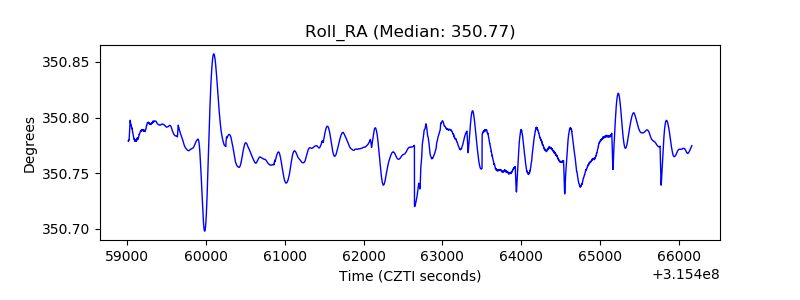 |
| Veto Counter | 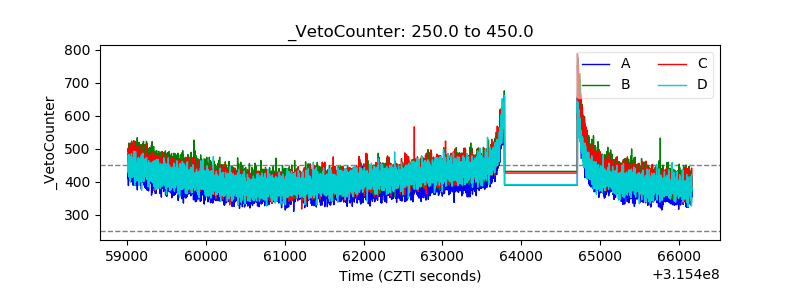 |