| Param | Original file | Final file |
|---|---|---|
| Filename | modeM0/AS1C05_004T01_9000003404_23018cztM0_level2.evt | modeM0/AS1C05_004T01_9000003404_23018cztM0_level2_quad_clean.evt |
| Size (bytes) | 484,822,080 | 108,083,520 |
| Size | 462.4 MB | 103.1 MB |
| Events in quadrant A | 3,329,126 | 701,349 |
| Events in quadrant B | 3,578,287 | 712,115 |
| Events in quadrant C | 3,398,298 | 685,392 |
| Events in quadrant D | 3,882,431 | 667,921 |
| Mode M0 | |||
|---|---|---|---|
| Quadrant | BADHDUFLAG | Total packets | Discarded packets |
| A | 0 | 14861 | 2 |
| B | 0 | 15399 | 2 |
| C | 0 | 14945 | 2 |
| D | 0 | 16557 | 2 |
| Mode SS | |||
|---|---|---|---|
| Quadrant | BADHDUFLAG | Total packets | Discarded packets |
| A | 0 | 146 | 0 |
| B | 0 | 146 | 0 |
| C | 0 | 146 | 0 |
| D | 0 | 146 | 0 |
| Mode M9 | |||
|---|---|---|---|
| Quadrant | BADHDUFLAG | Total packets | Discarded packets |
| A | 0 | 11 | 0 |
| B | 0 | 12 | 0 |
| C | 0 | 12 | 0 |
| D | 0 | 12 | 0 |
| Quadrant | Total seconds | Saturated seconds | Saturation percentage |
|---|---|---|---|
| A | 7282 | 77 | 1.057402% |
| B | 7282 | 158 | 2.169734% |
| C | 7282 | 114 | 1.565504% |
| D | 7282 | 98 | 1.345784% |
Noise dominated data is calculated using 1-second bins in cleaned event files. If a bin has >2000 counts, and if more than 50% of those come from <1% of pixels, then it is considered to be noise-dominated and hence unusable.
| Quadrant | # 1 sec bins | Bins with >0 counts | Bins with >2000 counts | High rate bins dominated by noise | Noise dominated (total time) | Noise dominated (detector-on time) | Marked lightcurve |
|---|---|---|---|---|---|---|---|
| A | 7747 | 7283 | 0 | 0 | 0.00% | 0.00% | 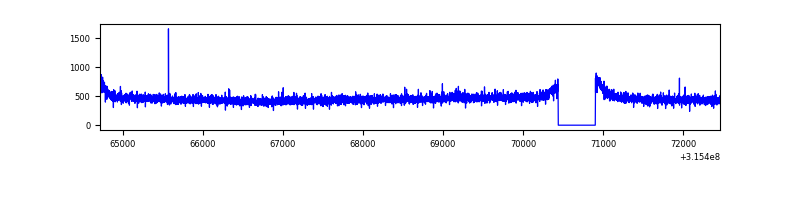 |
| B | 7747 | 7283 | 28 | 28 | 0.36% | 0.38% | 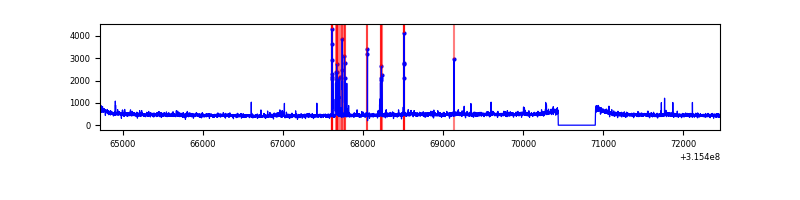 |
| C | 7747 | 7283 | 0 | 0 | 0.00% | 0.00% | 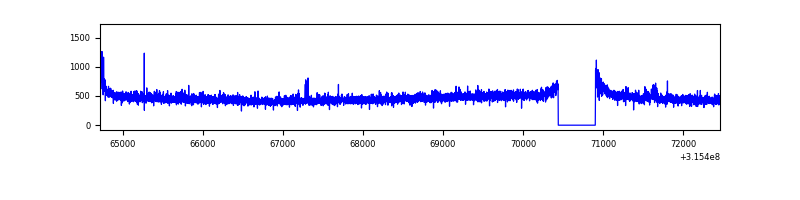 |
| D | 7747 | 7283 | 45 | 45 | 0.58% | 0.62% | 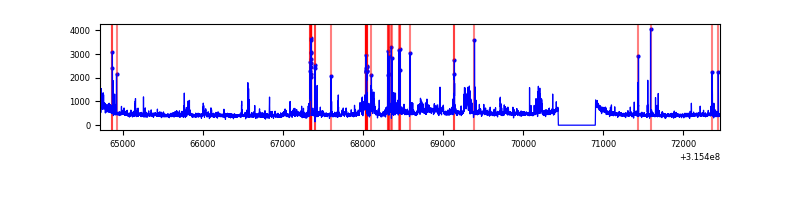 |
Top three noisy pixels from each quadrant. If the there are fewer than three noisy pixels in the level2.evt file, extra rows are filled as -1
| Pixel properties | Quadrant properties | ||||||
|---|---|---|---|---|---|---|---|
| Quadrant | DetID | PixID | Counts | Sigma | Mean | Median | Sigma |
| A | 13 | 254 | 10012 | 52.88 | 863 | 842 | 173.4 |
| A | 3 | 137 | 7602 | 38.98 | 863 | 842 | 173.4 |
| A | 0 | 226 | 7221 | 36.79 | 863 | 842 | 173.4 |
| B | 4 | 216 | 136901 | 828.61 | 860 | 838 | 164.2 |
| B | 0 | 189 | 39438 | 235.07 | 860 | 838 | 164.2 |
| B | 12 | 111 | 20084 | 117.21 | 860 | 838 | 164.2 |
| C | 14 | 238 | 131411 | 679.81 | 826 | 830 | 192.1 |
| C | 10 | 9 | 18768 | 93.38 | 826 | 830 | 192.1 |
| C | 7 | 247 | 17497 | 86.77 | 826 | 830 | 192.1 |
| D | 1 | 52 | 302172 | 1475.37 | 834 | 805 | 204.3 |
| D | 13 | 174 | 119471 | 580.94 | 834 | 805 | 204.3 |
| D | 13 | 153 | 111017 | 539.55 | 834 | 805 | 204.3 |
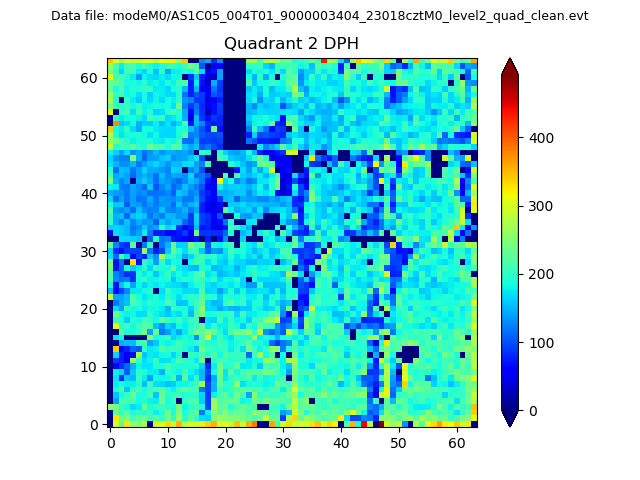
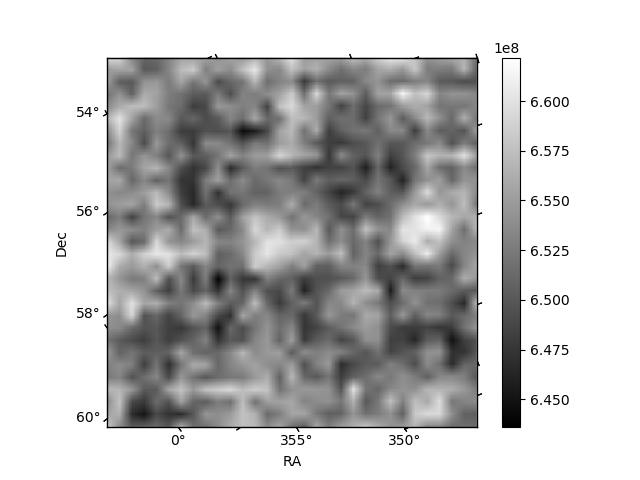
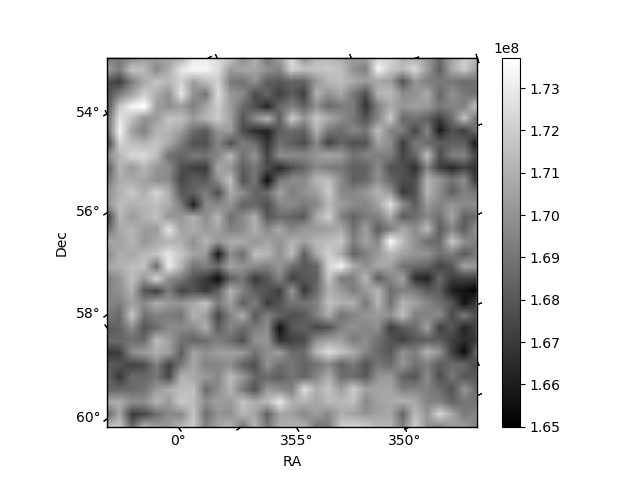
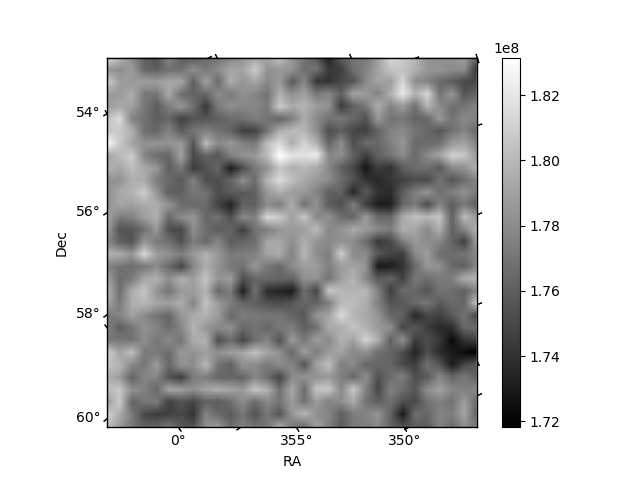
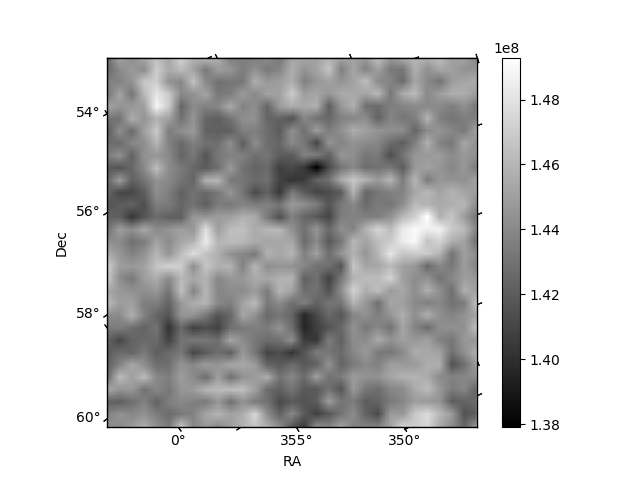
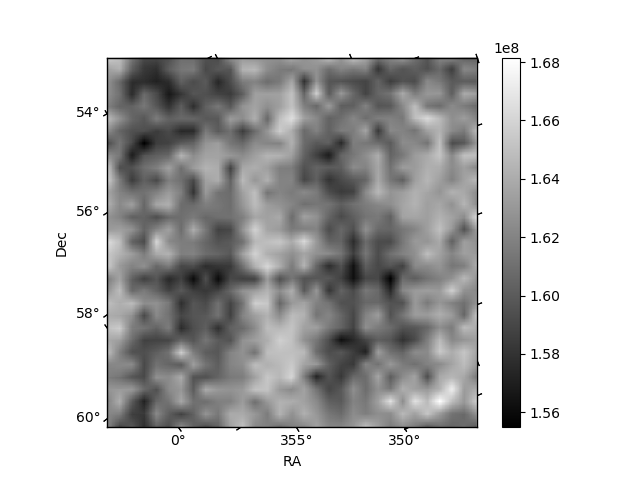
Histogram calculated using DETX and DETY for each event in the final _common_clean file
| Quadrant A | 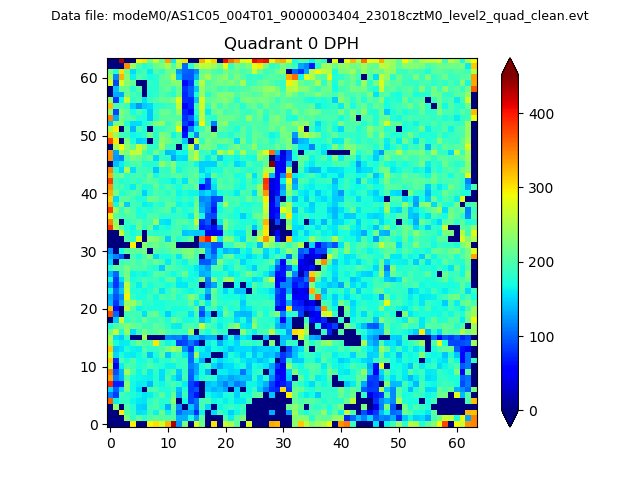 |
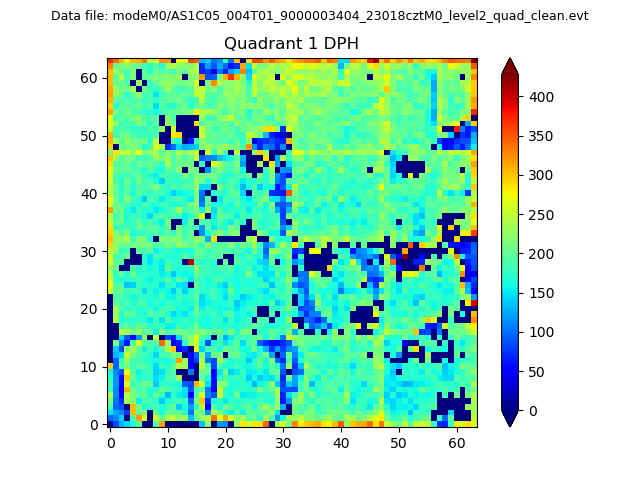 |
Quadrant B |
|---|---|---|---|
| Quadrant D | 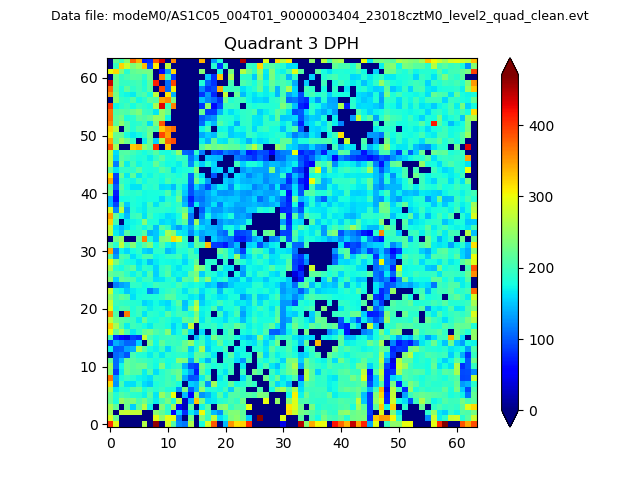 |
 |
Quadrant C |
| Plot type | Count rate plots | Images |
|---|---|---|
| Comparison with Poisson distribution Blue bars denote a histogram of data divided into 1 sec bins. Red curve is a Poisson curve with rate = median count rate of data. |
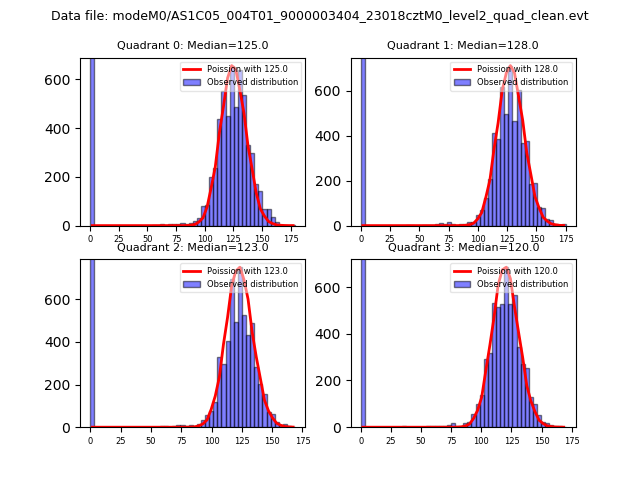 |
 |
| Quadrant-wise count rates Data is divided into 100 sec bins |
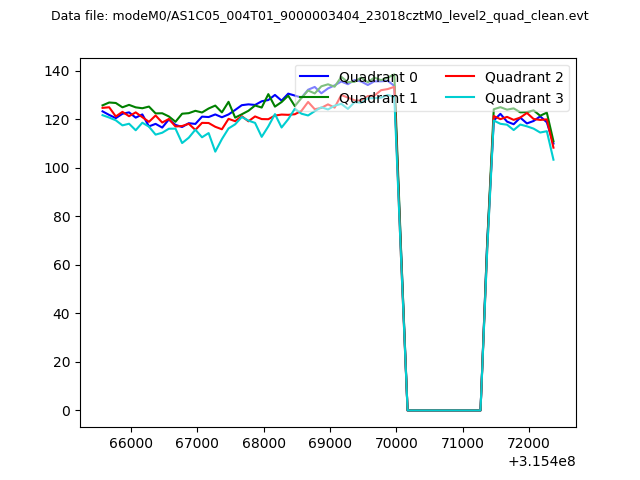 |
|
| Module-wise count rates for Quadrant A Data is divided into 100 sec bins |
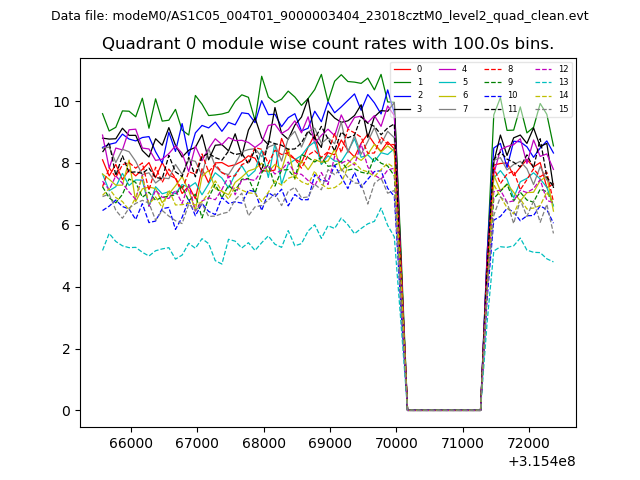 |
 |
| Module-wise count rates for Quadrant B Data is divided into 100 sec bins |
 |
 |
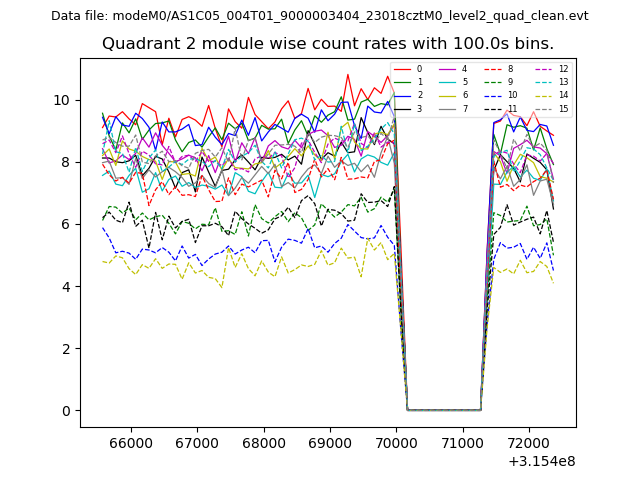
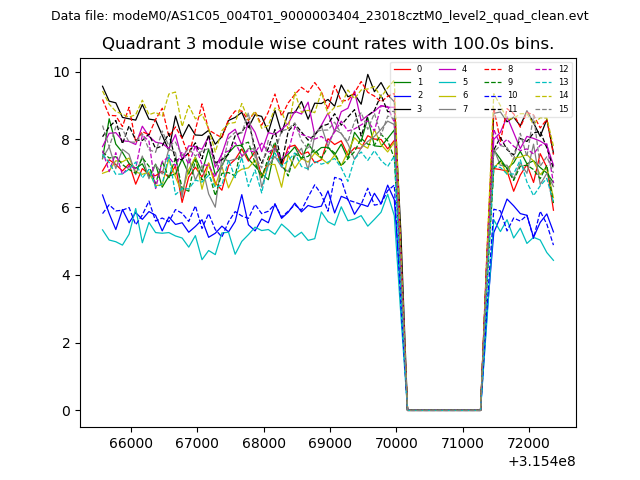
| Module-wise count rates for Quadrant C Data is divided into 100 sec bins |
 |
 |
| Module-wise count rates for Quadrant D Data is divided into 100 sec bins |
 |
 |
| Parameter | Plot |
|---|---|
| CZT HV Monitor | 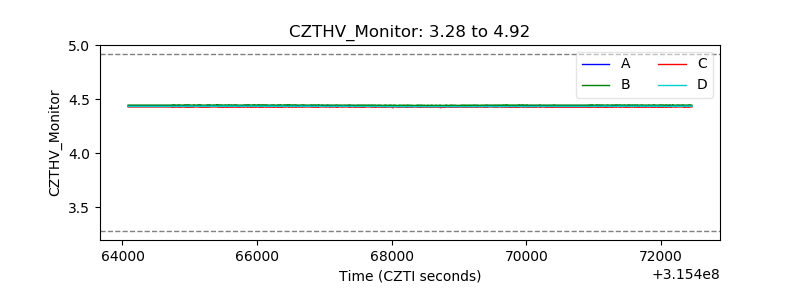 |
| D_VDD | 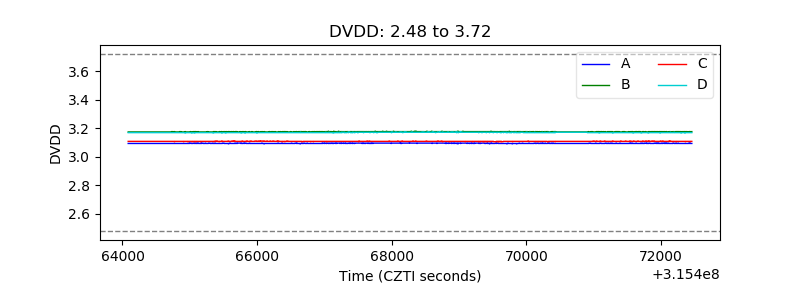 |
| Temperature 1 | 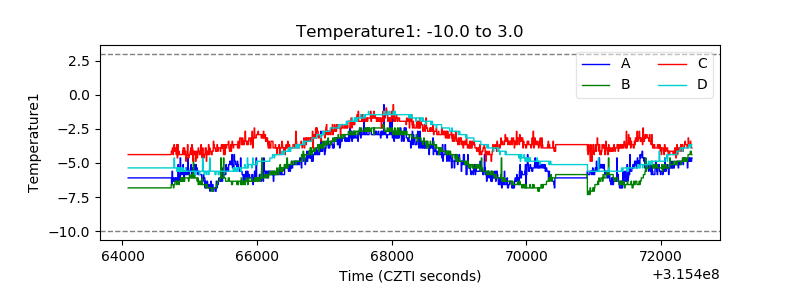 |
| Veto HV Monitor | 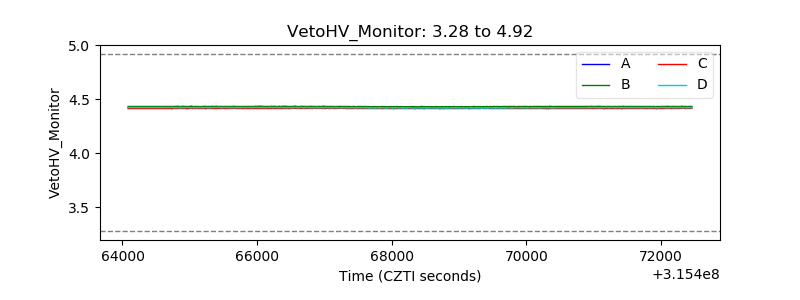 |
| Veto LLD | 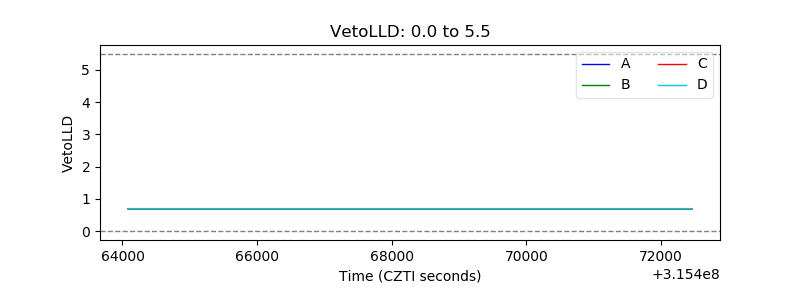 |
| Alpha Counter | 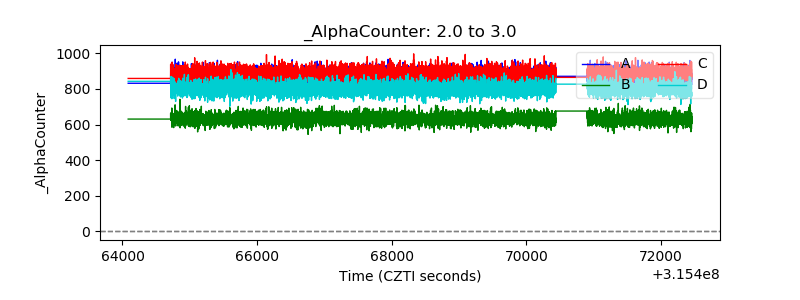 |
| _CPM_Rate | 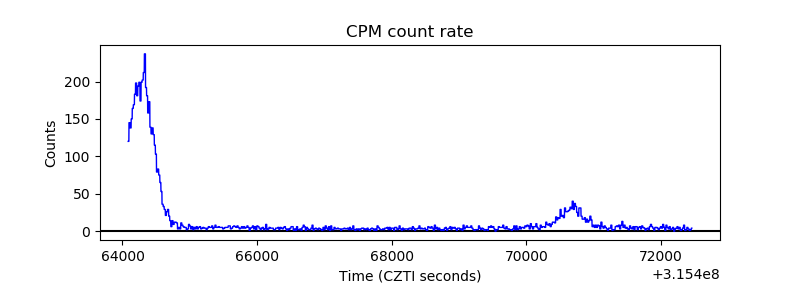 |
| CZT Counter | 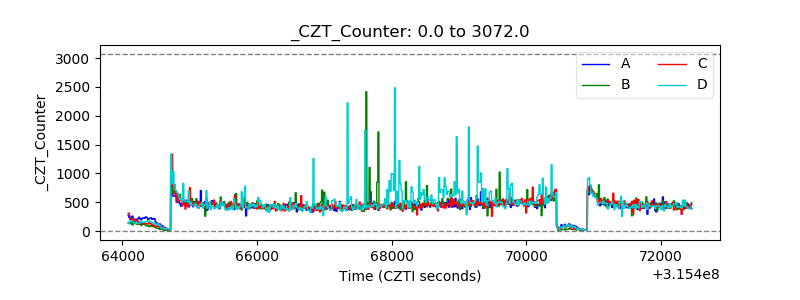 |
| +2.5 Volts monitor |  |
| +5 Volts monitor |  |
| _ROLL_ROT | 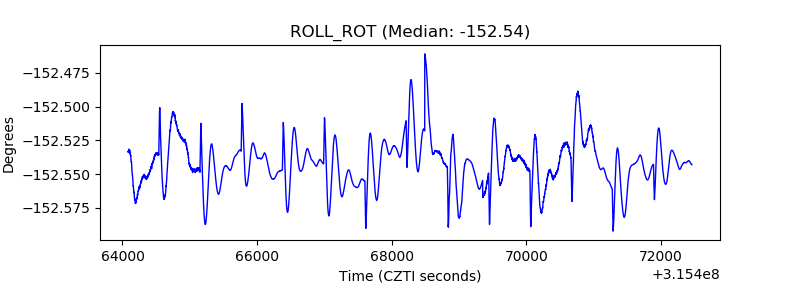 |
| _Roll_DEC | 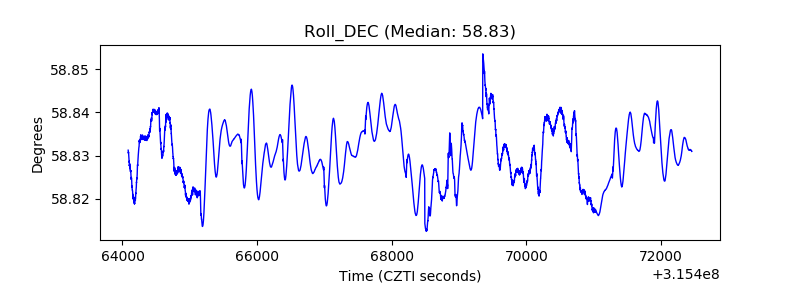 |
| _Roll_RA | 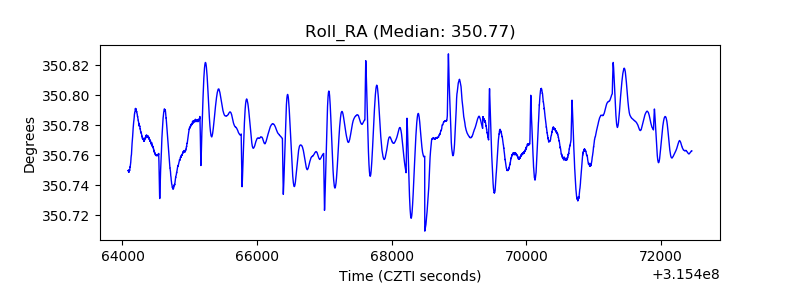 |
| Veto Counter | 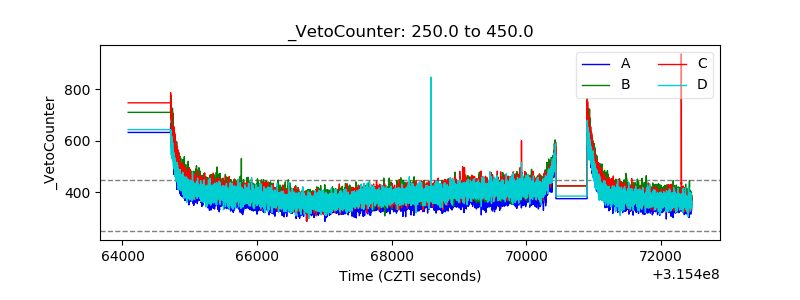 |