| Param | Original file | Final file |
|---|---|---|
| Filename | modeM0/AS1C05_004T01_9000003404_23019cztM0_level2.evt | modeM0/AS1C05_004T01_9000003404_23019cztM0_level2_quad_clean.evt |
| Size (bytes) | 493,205,760 | 112,567,680 |
| Size | 470.4 MB | 107.4 MB |
| Events in quadrant A | 3,338,400 | 737,754 |
| Events in quadrant B | 3,615,387 | 746,880 |
| Events in quadrant C | 3,462,866 | 718,066 |
| Events in quadrant D | 4,026,822 | 701,482 |
| Mode M0 | |||
|---|---|---|---|
| Quadrant | BADHDUFLAG | Total packets | Discarded packets |
| A | 0 | 14950 | 1 |
| B | 0 | 15568 | 1 |
| C | 0 | 15166 | 1 |
| D | 0 | 16978 | 1 |
| Mode SS | |||
|---|---|---|---|
| Quadrant | BADHDUFLAG | Total packets | Discarded packets |
| A | 0 | 146 | 0 |
| B | 0 | 146 | 0 |
| C | 0 | 146 | 0 |
| D | 0 | 146 | 0 |
| Quadrant | Total seconds | Saturated seconds | Saturation percentage |
|---|---|---|---|
| A | 7254 | 200 | 2.757100% |
| B | 7254 | 267 | 3.680728% |
| C | 7254 | 207 | 2.853598% |
| D | 7254 | 204 | 2.812242% |
Noise dominated data is calculated using 1-second bins in cleaned event files. If a bin has >2000 counts, and if more than 50% of those come from <1% of pixels, then it is considered to be noise-dominated and hence unusable.
| Quadrant | # 1 sec bins | Bins with >0 counts | Bins with >2000 counts | High rate bins dominated by noise | Noise dominated (total time) | Noise dominated (detector-on time) | Marked lightcurve |
|---|---|---|---|---|---|---|---|
| A | 7299 | 7255 | 0 | 0 | 0.00% | 0.00% | 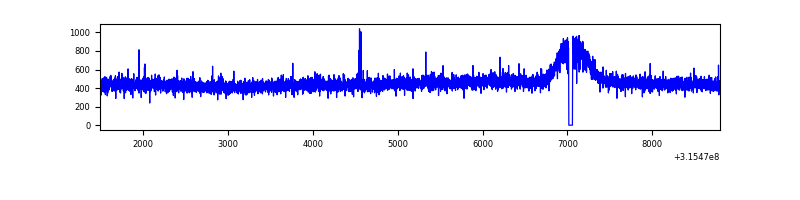 |
| B | 7299 | 7255 | 45 | 45 | 0.62% | 0.62% | 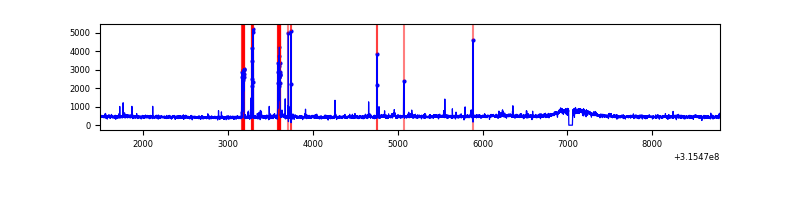 |
| C | 7299 | 7255 | 1 | 1 | 0.01% | 0.01% | 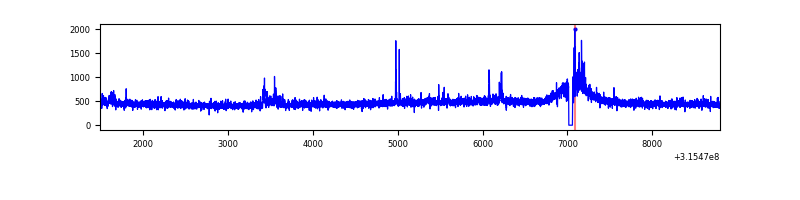 |
| D | 7299 | 7255 | 53 | 53 | 0.73% | 0.73% | 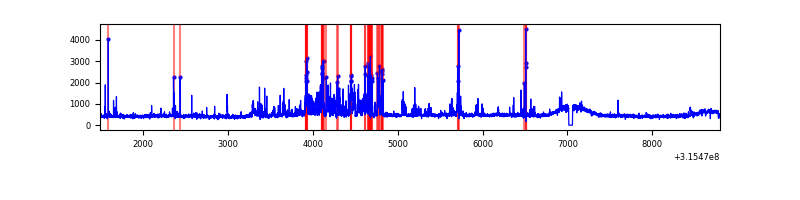 |
Top three noisy pixels from each quadrant. If the there are fewer than three noisy pixels in the level2.evt file, extra rows are filled as -1
| Pixel properties | Quadrant properties | ||||||
|---|---|---|---|---|---|---|---|
| Quadrant | DetID | PixID | Counts | Sigma | Mean | Median | Sigma |
| A | 13 | 254 | 10073 | 52.84 | 865 | 846 | 174.6 |
| A | 3 | 137 | 8003 | 40.99 | 865 | 846 | 174.6 |
| A | 0 | 226 | 7406 | 37.57 | 865 | 846 | 174.6 |
| B | 4 | 216 | 188849 | 1146.69 | 857 | 835 | 164.0 |
| B | 0 | 189 | 26992 | 159.53 | 857 | 835 | 164.0 |
| B | 12 | 111 | 20358 | 119.07 | 857 | 835 | 164.0 |
| C | 14 | 238 | 131040 | 675.55 | 823 | 827 | 192.8 |
| C | 7 | 247 | 91009 | 467.87 | 823 | 827 | 192.8 |
| C | 8 | 222 | 12359 | 59.83 | 823 | 827 | 192.8 |
| D | 1 | 52 | 533240 | 2598.17 | 840 | 814 | 204.9 |
| D | 2 | 152 | 143946 | 698.47 | 840 | 814 | 204.9 |
| D | 13 | 153 | 121909 | 590.93 | 840 | 814 | 204.9 |
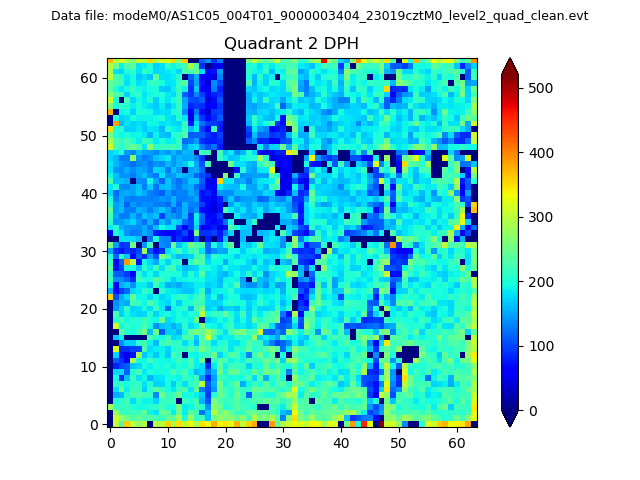
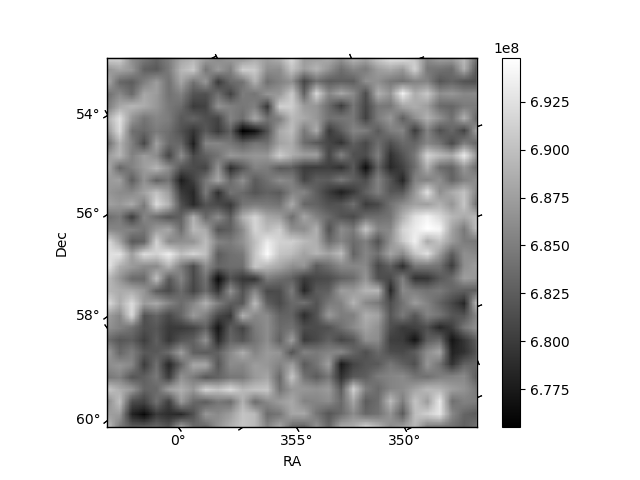
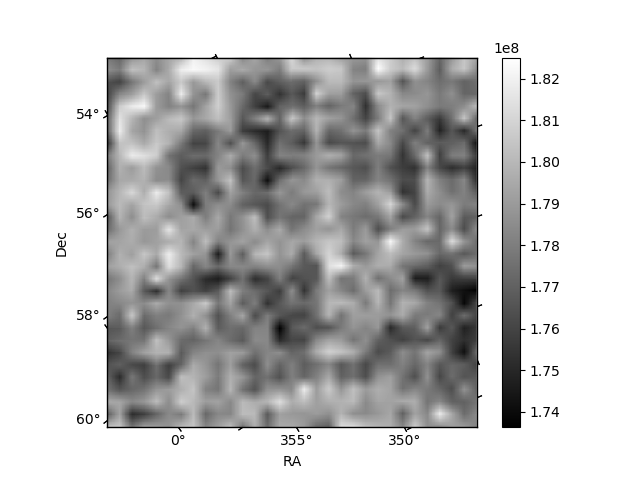
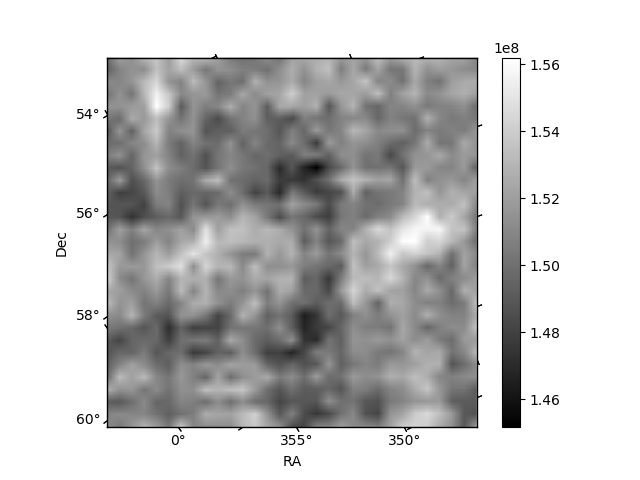
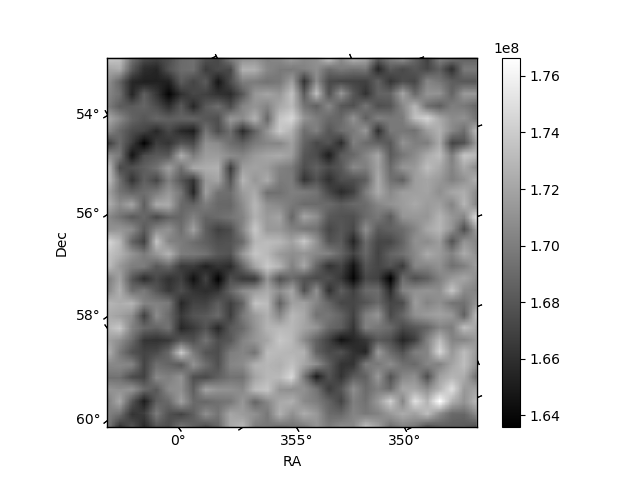
Histogram calculated using DETX and DETY for each event in the final _common_clean file
| Quadrant A | 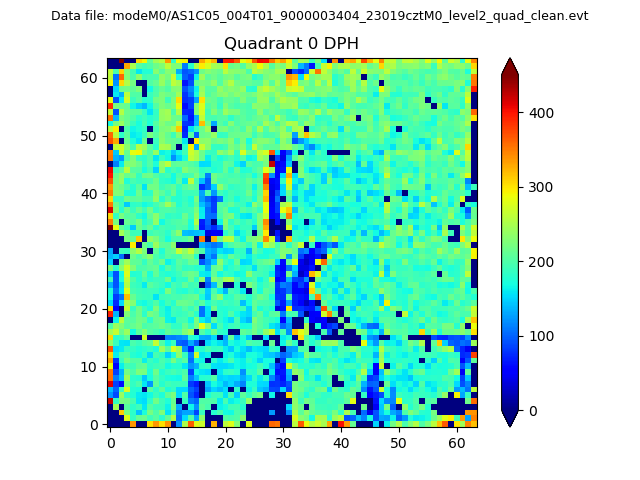 |
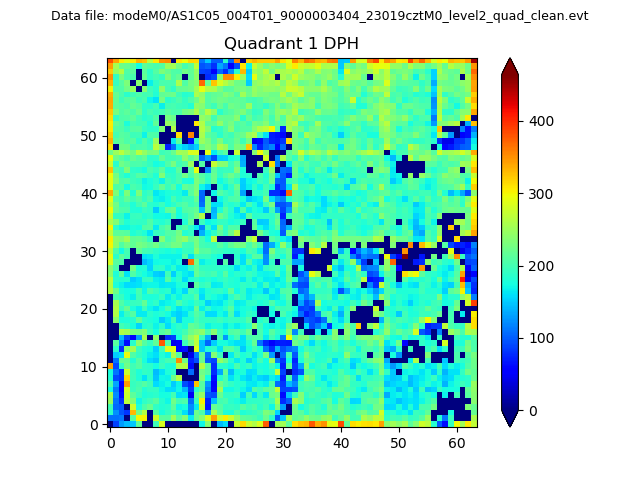 |
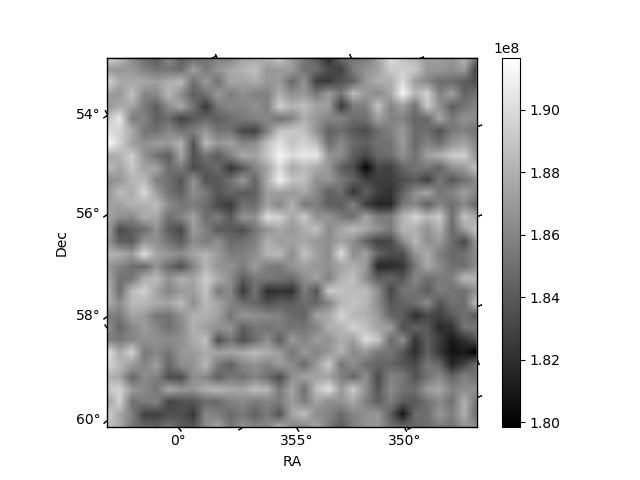
Quadrant B |
|---|---|---|---|
| Quadrant D | 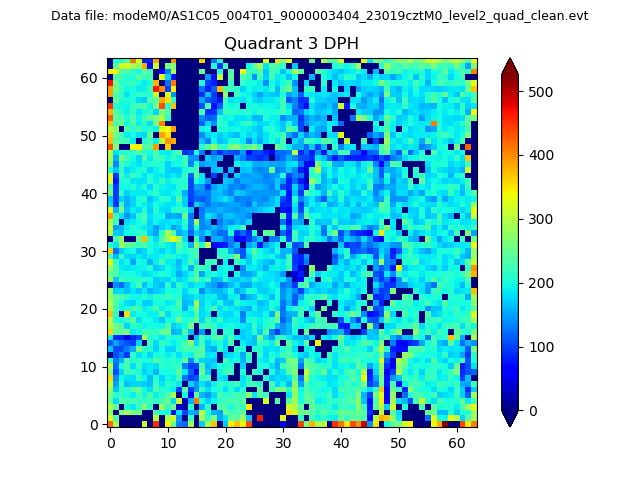 |
 |
Quadrant C |
| Plot type | Count rate plots | Images |
|---|---|---|
| Comparison with Poisson distribution Blue bars denote a histogram of data divided into 1 sec bins. Red curve is a Poisson curve with rate = median count rate of data. |
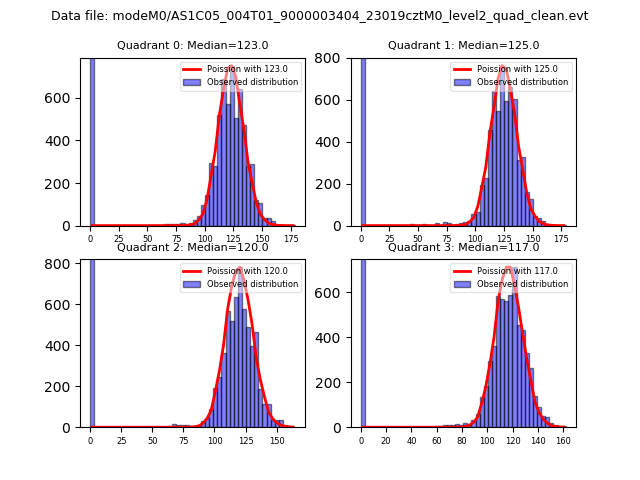 |
 |
| Quadrant-wise count rates Data is divided into 100 sec bins |
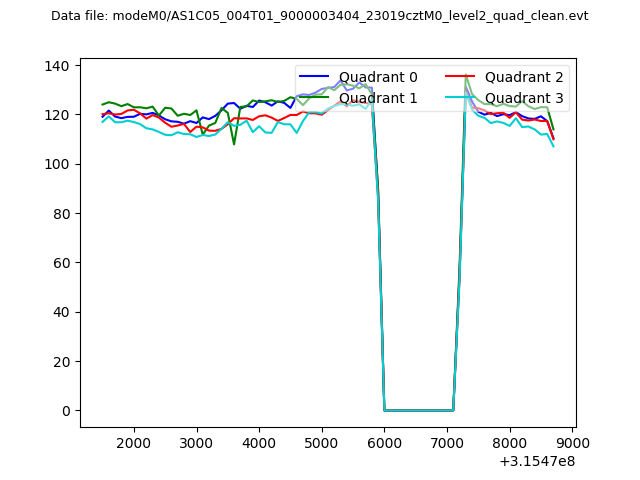 |
|
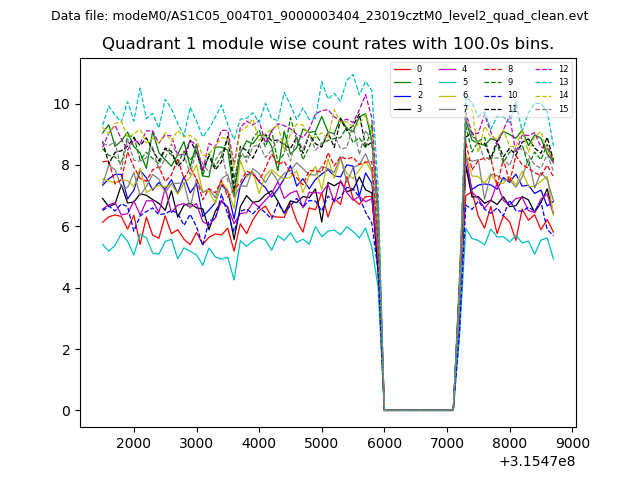
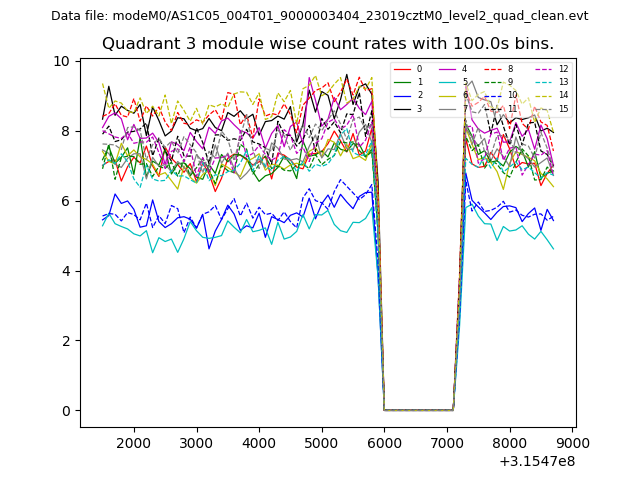
| Module-wise count rates for Quadrant A Data is divided into 100 sec bins |
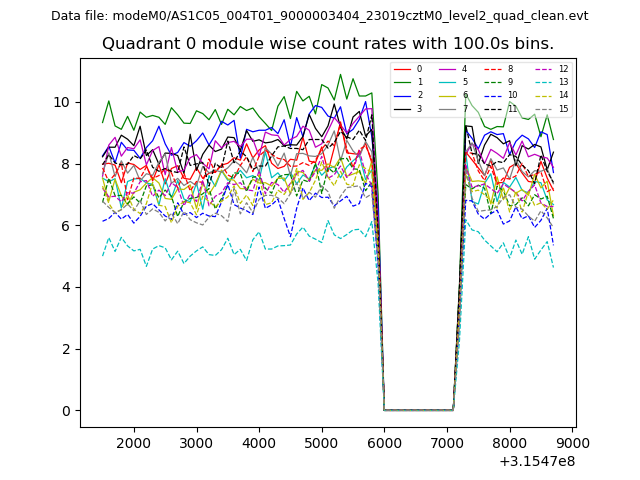 |
 |
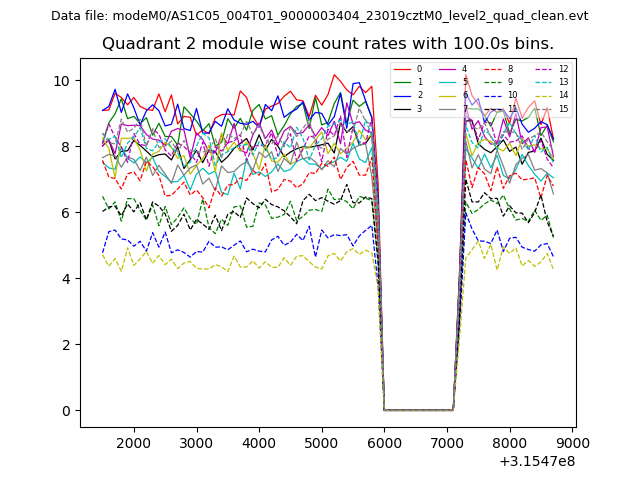
| Module-wise count rates for Quadrant B Data is divided into 100 sec bins |
 |
 |
| Module-wise count rates for Quadrant C Data is divided into 100 sec bins |
 |
 |
| Module-wise count rates for Quadrant D Data is divided into 100 sec bins |
 |
 |
| Parameter | Plot |
|---|---|
| CZT HV Monitor | 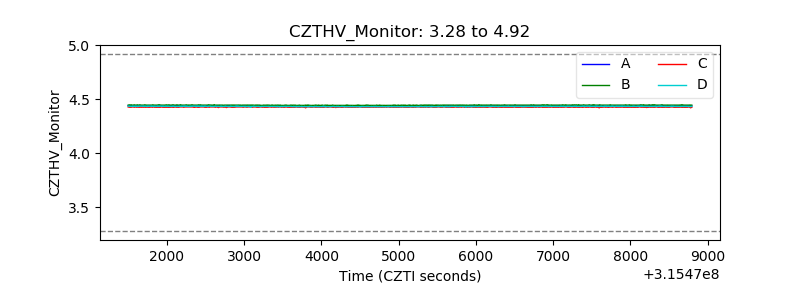 |
| D_VDD | 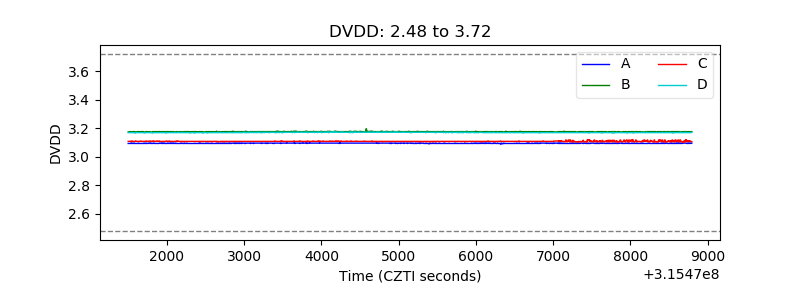 |
| Temperature 1 | 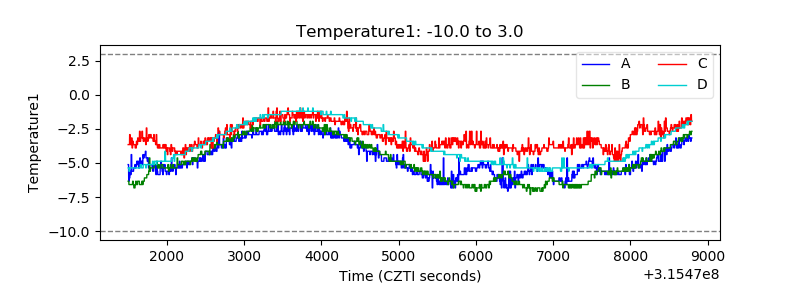 |
| Veto HV Monitor | 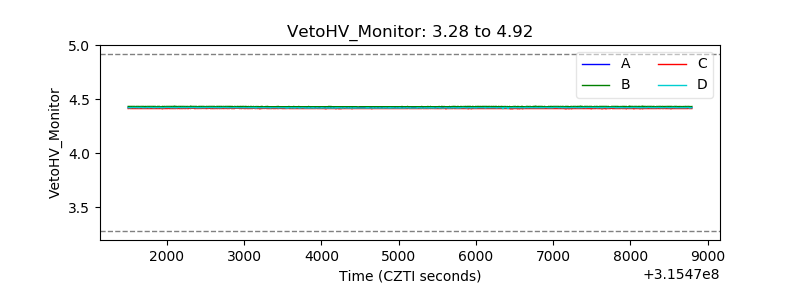 |
| Veto LLD | 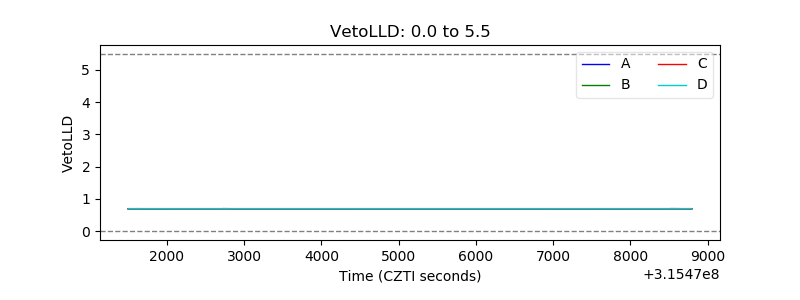 |
| Alpha Counter | 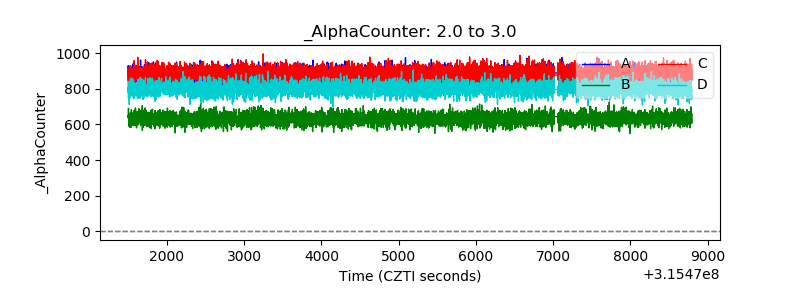 |
| _CPM_Rate | 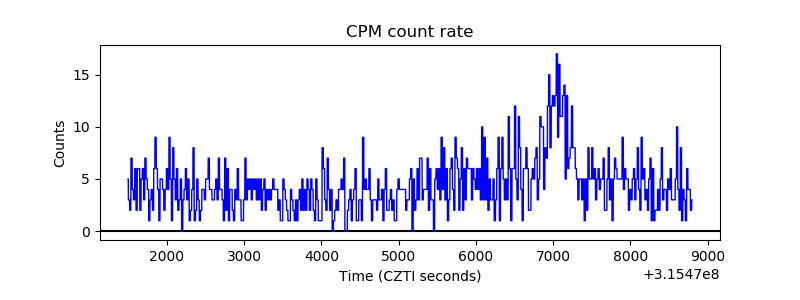 |
| CZT Counter | 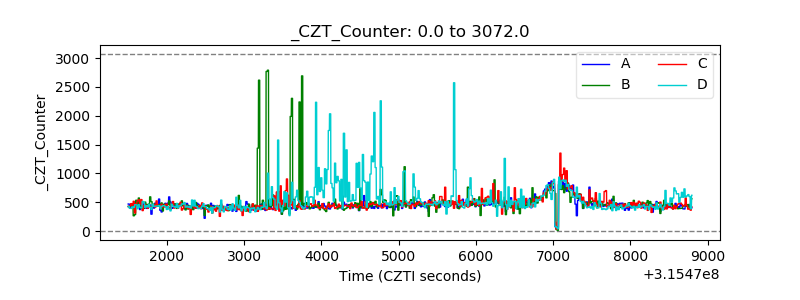 |
| +2.5 Volts monitor |  |
| +5 Volts monitor | 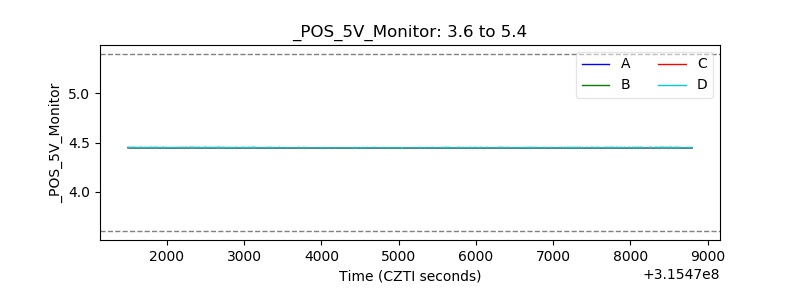 |
| _ROLL_ROT | 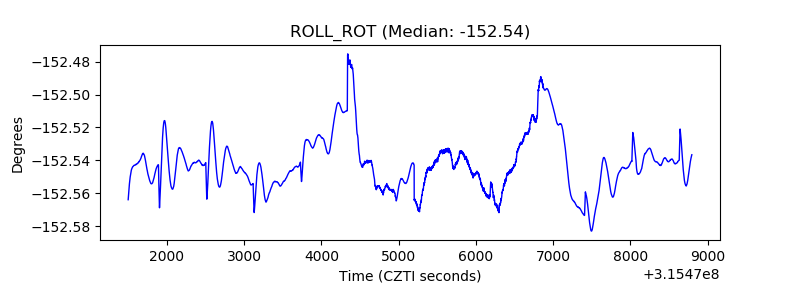 |
| _Roll_DEC | 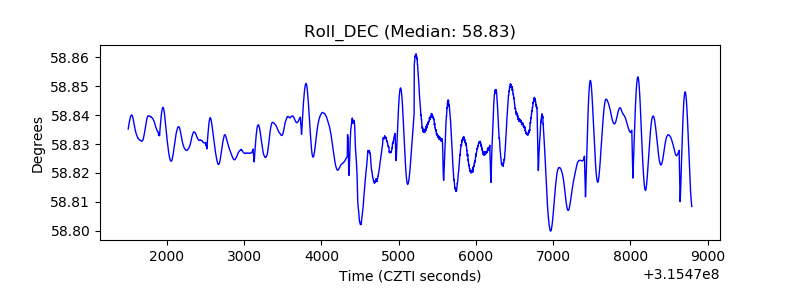 |
| _Roll_RA | 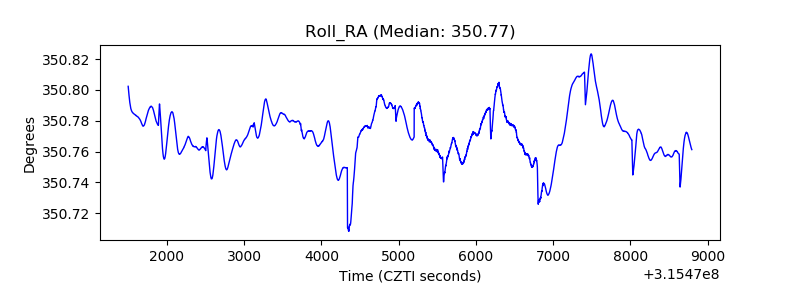 |
| Veto Counter | 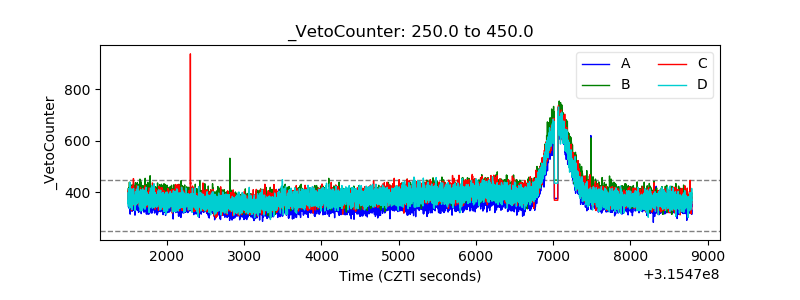 |