| Param | Original file | Final file |
|---|---|---|
| Filename | modeM0/AS1C05_004T01_9000003404_23020cztM0_level2.evt | modeM0/AS1C05_004T01_9000003404_23020cztM0_level2_quad_clean.evt |
| Size (bytes) | 524,232,000 | 117,498,240 |
| Size | 499.9 MB | 112.1 MB |
| Events in quadrant A | 3,482,629 | 771,525 |
| Events in quadrant B | 3,699,113 | 780,521 |
| Events in quadrant C | 3,553,825 | 749,532 |
| Events in quadrant D | 4,626,428 | 729,985 |
| Mode M0 | |||
|---|---|---|---|
| Quadrant | BADHDUFLAG | Total packets | Discarded packets |
| A | 0 | 15541 | 1 |
| B | 0 | 16009 | 1 |
| C | 0 | 15574 | 1 |
| D | 0 | 18882 | 1 |
| Mode SS | |||
|---|---|---|---|
| Quadrant | BADHDUFLAG | Total packets | Discarded packets |
| A | 0 | 154 | 0 |
| B | 0 | 154 | 0 |
| C | 0 | 154 | 0 |
| D | 0 | 154 | 0 |
| Mode M9 | |||
|---|---|---|---|
| Quadrant | BADHDUFLAG | Total packets | Discarded packets |
| A | 0 | 2 | 0 |
| B | 0 | 2 | 0 |
| C | 0 | 2 | 0 |
| D | 0 | 2 | 0 |
| Quadrant | Total seconds | Saturated seconds | Saturation percentage |
|---|---|---|---|
| A | 7569 | 170 | 2.246003% |
| B | 7570 | 207 | 2.734478% |
| C | 7570 | 181 | 2.391017% |
| D | 7570 | 303 | 4.002642% |
Noise dominated data is calculated using 1-second bins in cleaned event files. If a bin has >2000 counts, and if more than 50% of those come from <1% of pixels, then it is considered to be noise-dominated and hence unusable.
| Quadrant | # 1 sec bins | Bins with >0 counts | Bins with >2000 counts | High rate bins dominated by noise | Noise dominated (total time) | Noise dominated (detector-on time) | Marked lightcurve |
|---|---|---|---|---|---|---|---|
| A | 7744 | 7571 | 3 | 3 | 0.04% | 0.04% | 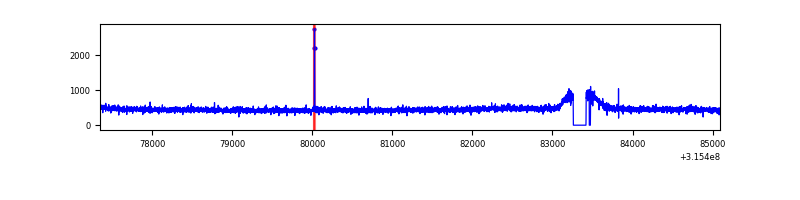 |
| B | 7745 | 7572 | 31 | 31 | 0.40% | 0.41% |  |
| C | 7745 | 7572 | 0 | 0 | 0.00% | 0.00% | 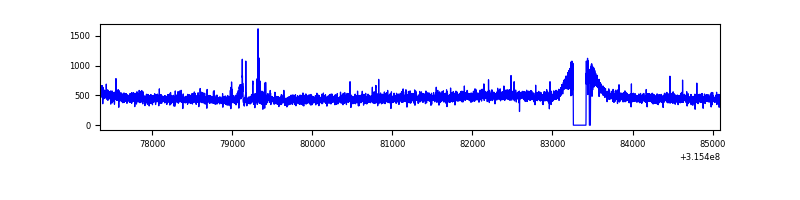 |
| D | 7745 | 7572 | 159 | 159 | 2.05% | 2.10% | 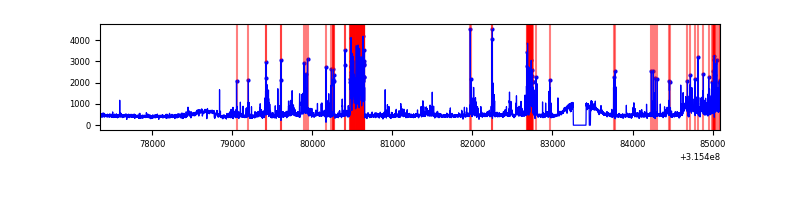 |
Top three noisy pixels from each quadrant. If the there are fewer than three noisy pixels in the level2.evt file, extra rows are filled as -1
| Pixel properties | Quadrant properties | ||||||
|---|---|---|---|---|---|---|---|
| Quadrant | DetID | PixID | Counts | Sigma | Mean | Median | Sigma |
| A | 13 | 254 | 10824 | 54.94 | 900 | 879 | 181.0 |
| A | 15 | 174 | 10814 | 54.88 | 900 | 879 | 181.0 |
| A | 3 | 137 | 8205 | 40.47 | 900 | 879 | 181.0 |
| B | 4 | 216 | 135558 | 784.49 | 891 | 867 | 171.7 |
| B | 0 | 189 | 31048 | 175.79 | 891 | 867 | 171.7 |
| B | 0 | 190 | 25377 | 142.76 | 891 | 867 | 171.7 |
| C | 14 | 238 | 135991 | 666.16 | 860 | 861 | 202.8 |
| C | 7 | 247 | 42724 | 206.38 | 860 | 861 | 202.8 |
| C | 8 | 128 | 12478 | 57.27 | 860 | 861 | 202.8 |
| D | 1 | 52 | 748594 | 3524.92 | 872 | 847 | 212.1 |
| D | 13 | 174 | 186098 | 873.28 | 872 | 847 | 212.1 |
| D | 13 | 153 | 148136 | 694.33 | 872 | 847 | 212.1 |
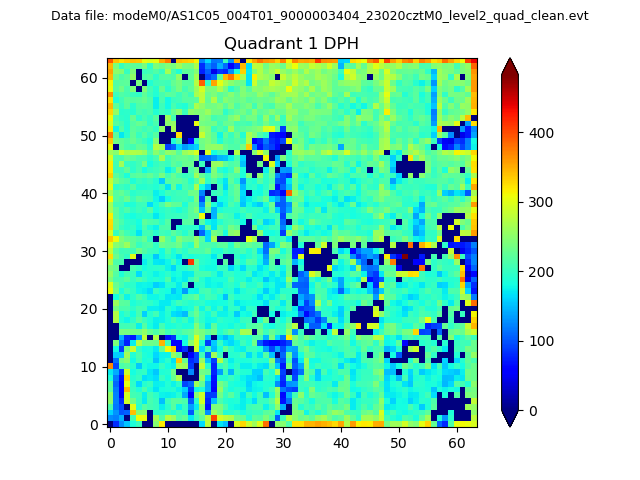
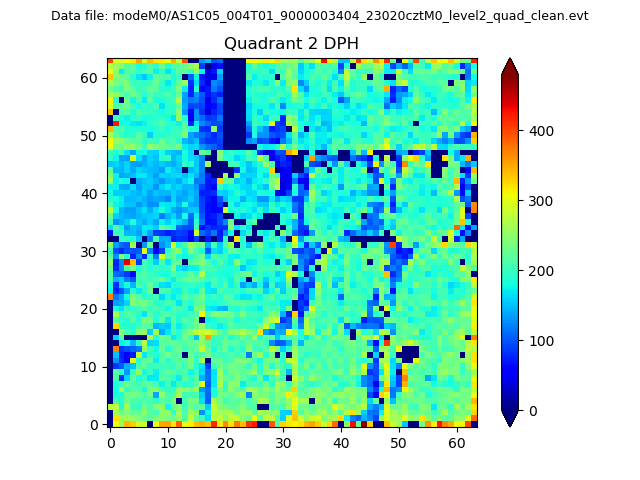
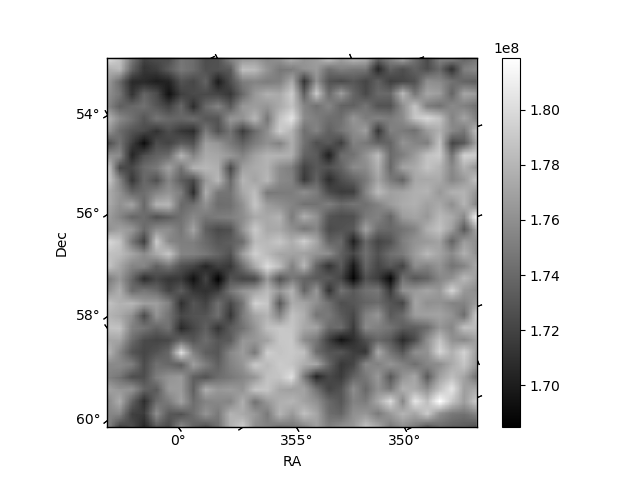
Histogram calculated using DETX and DETY for each event in the final _common_clean file
| Quadrant A | 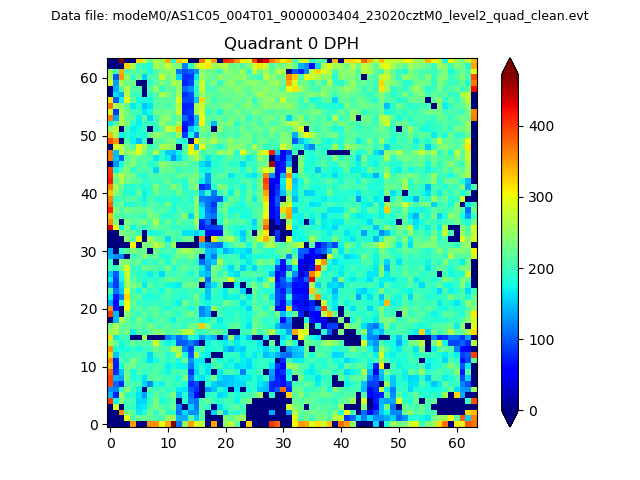 |
 |
Quadrant B |
|---|---|---|---|
| Quadrant D | 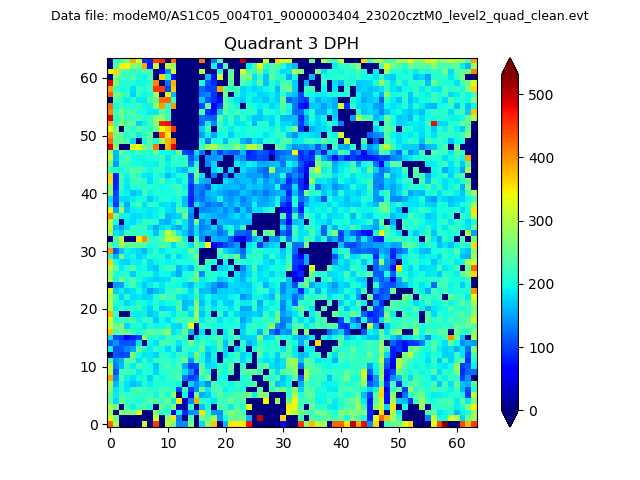 |
 |
Quadrant C |
| Plot type | Count rate plots | Images |
|---|---|---|
| Comparison with Poisson distribution Blue bars denote a histogram of data divided into 1 sec bins. Red curve is a Poisson curve with rate = median count rate of data. |
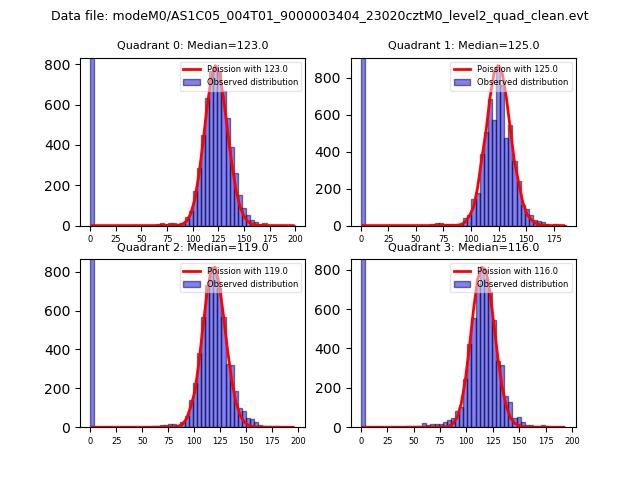 |
 |
| Quadrant-wise count rates Data is divided into 100 sec bins |
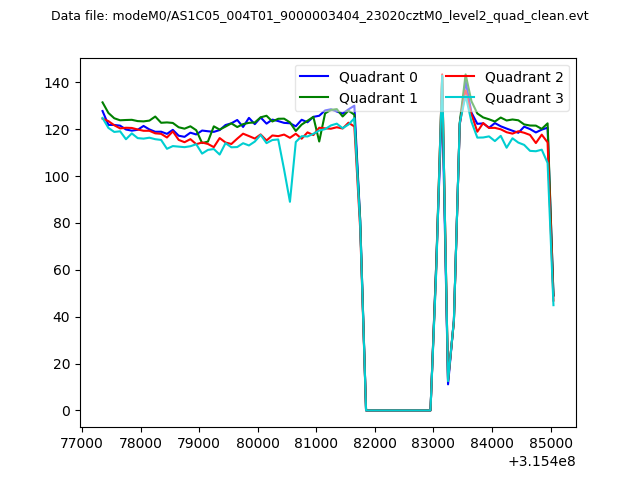 |
|
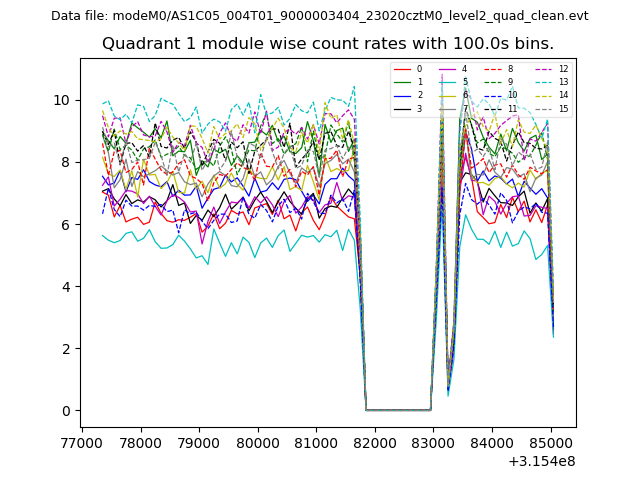
| Module-wise count rates for Quadrant A Data is divided into 100 sec bins |
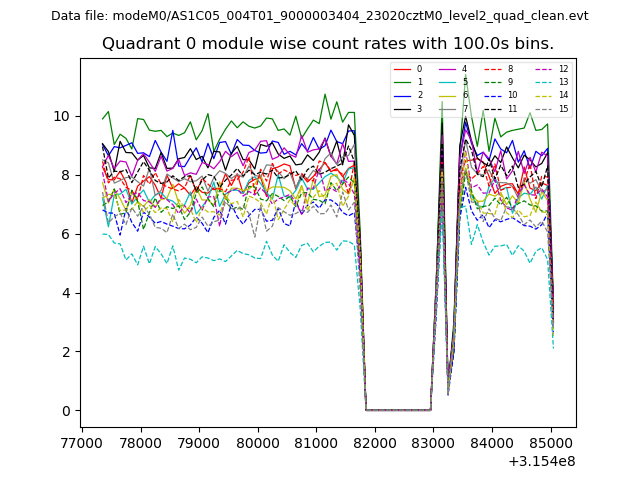 |
 |
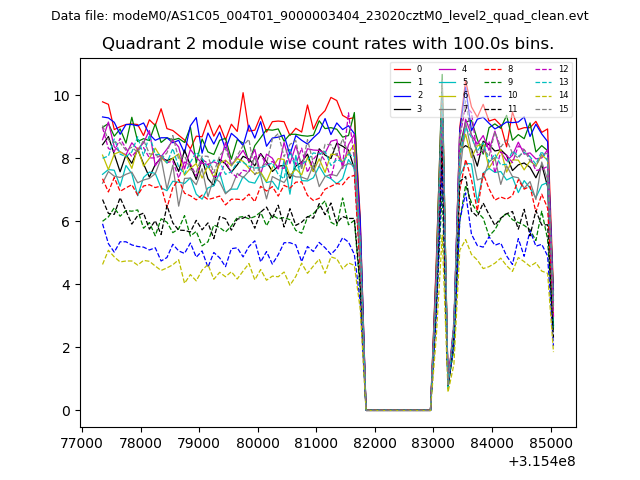
| Module-wise count rates for Quadrant B Data is divided into 100 sec bins |
 |
 |
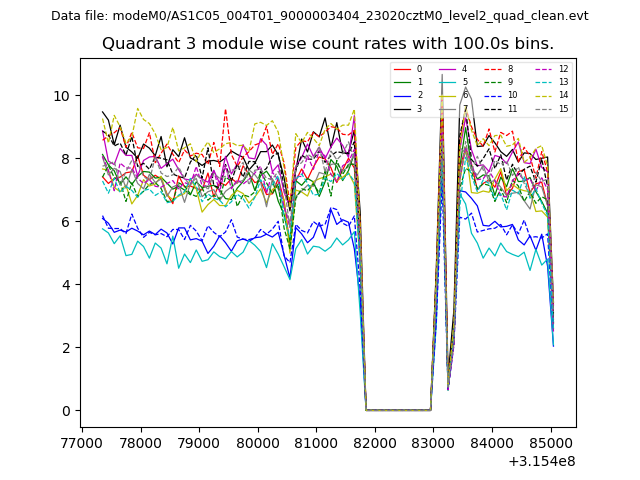
| Module-wise count rates for Quadrant C Data is divided into 100 sec bins |
 |
 |
| Module-wise count rates for Quadrant D Data is divided into 100 sec bins |
 |
 |
| Parameter | Plot |
|---|---|
| CZT HV Monitor | 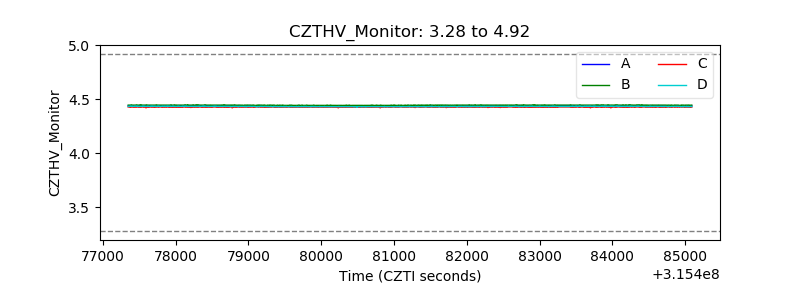 |
| D_VDD | 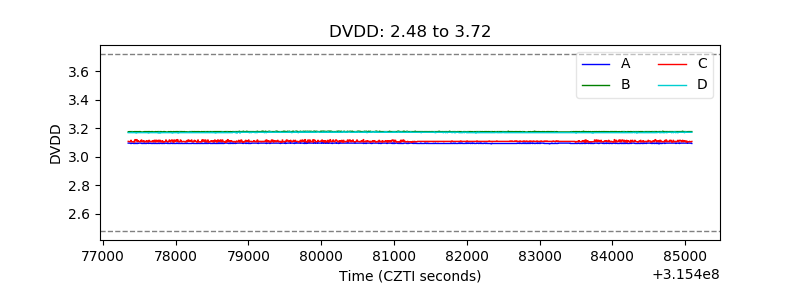 |
| Temperature 1 | 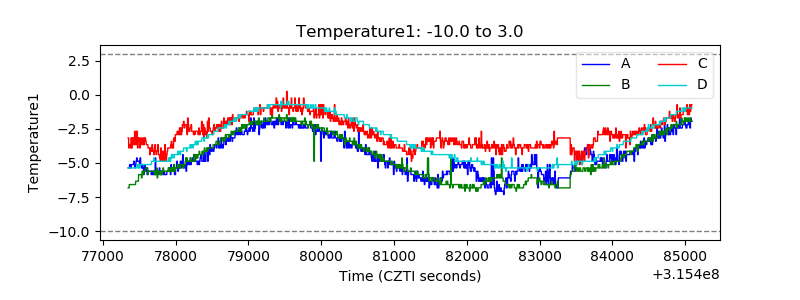 |
| Veto HV Monitor | 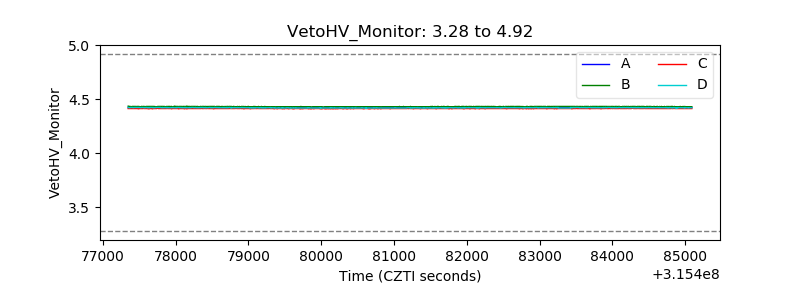 |
| Veto LLD | 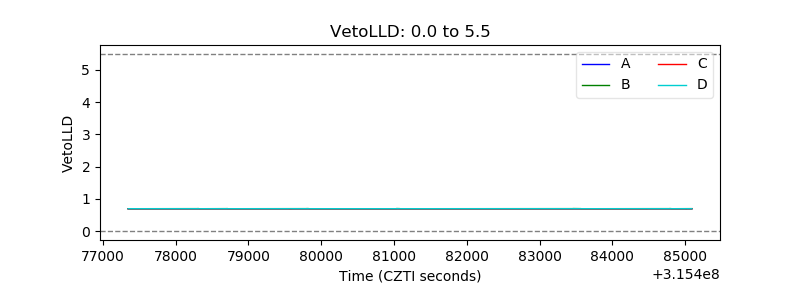 |
| Alpha Counter | 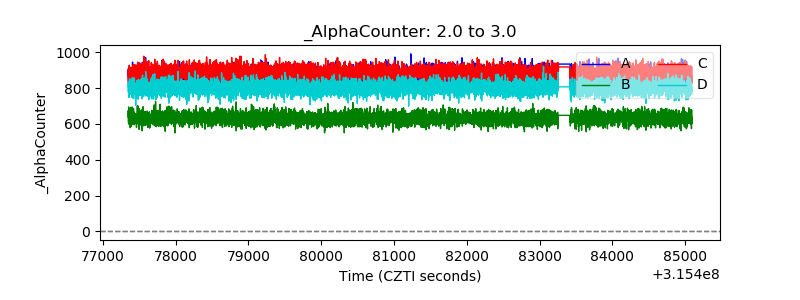 |
| _CPM_Rate | 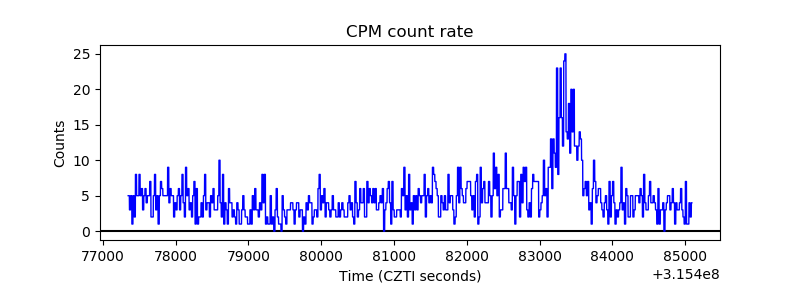 |
| CZT Counter | 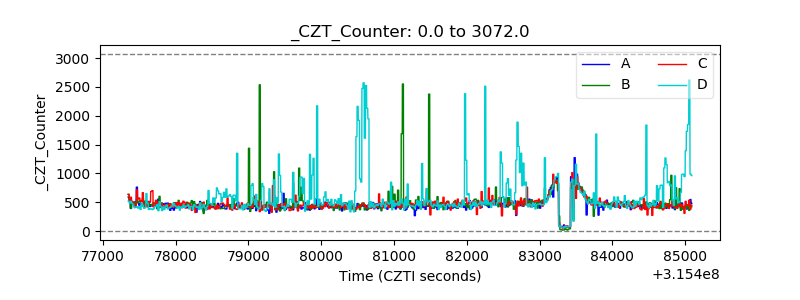 |
| +2.5 Volts monitor |  |
| +5 Volts monitor | 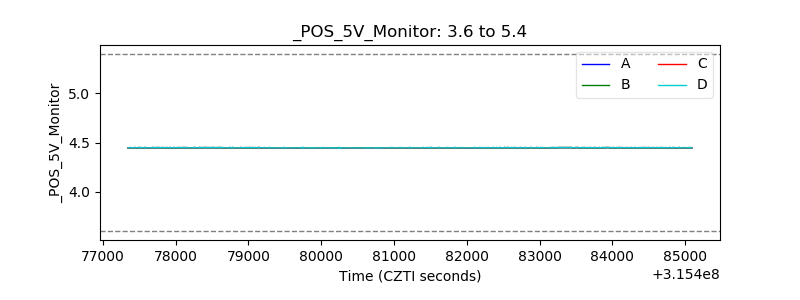 |
| _ROLL_ROT | 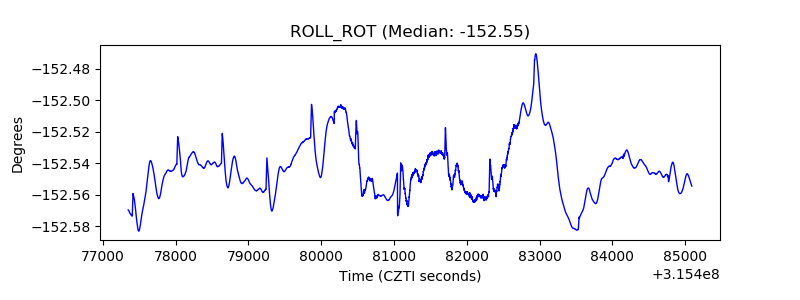 |
| _Roll_DEC | 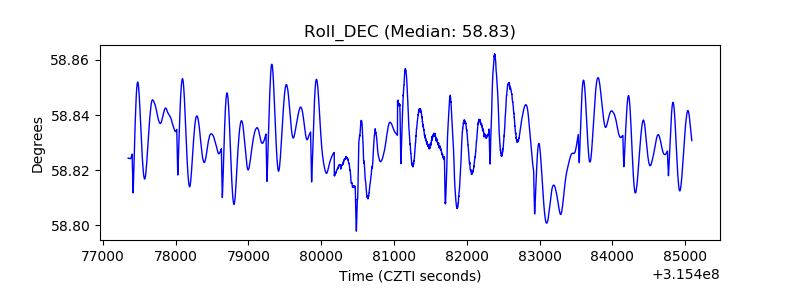 |
| _Roll_RA | 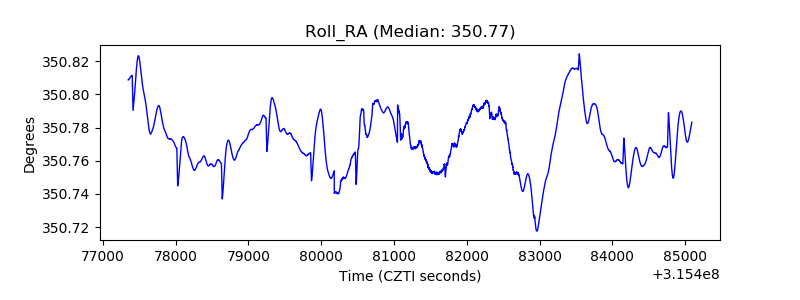 |
| Veto Counter | 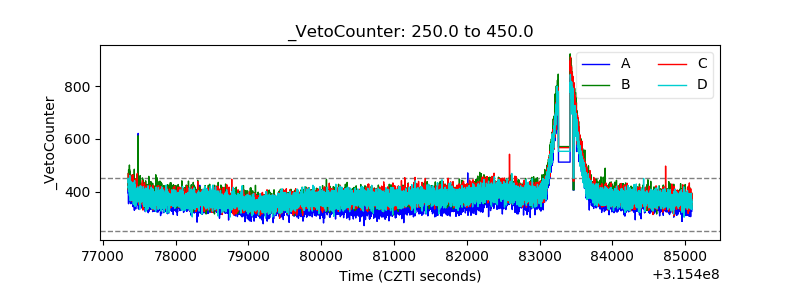 |