| Param | Original file | Final file |
|---|---|---|
| Filename | modeM0/AS1C05_004T01_9000003404_23023cztM0_level2.evt | modeM0/AS1C05_004T01_9000003404_23023cztM0_level2_quad_clean.evt |
| Size (bytes) | 1,281,237,120 | 266,086,080 |
| Size | 1.2 GB | 253.8 MB |
| Events in quadrant A | 8,139,377 | 1,752,787 |
| Events in quadrant B | 8,912,576 | 1,761,218 |
| Events in quadrant C | 8,355,491 | 1,684,952 |
| Events in quadrant D | 12,182,390 | 1,623,985 |
| Mode M0 | |||
|---|---|---|---|
| Quadrant | BADHDUFLAG | Total packets | Discarded packets |
| A | 0 | 36488 | 3 |
| B | 0 | 38296 | 3 |
| C | 0 | 36693 | 3 |
| D | 0 | 47977 | 3 |
| Mode SS | |||
|---|---|---|---|
| Quadrant | BADHDUFLAG | Total packets | Discarded packets |
| A | 0 | 368 | 0 |
| B | 0 | 368 | 0 |
| C | 0 | 368 | 0 |
| D | 0 | 368 | 0 |
| Mode M9 | |||
|---|---|---|---|
| Quadrant | BADHDUFLAG | Total packets | Discarded packets |
| A | 0 | 18 | 0 |
| B | 0 | 18 | 0 |
| C | 0 | 18 | 0 |
| D | 0 | 18 | 0 |
| Quadrant | Total seconds | Saturated seconds | Saturation percentage |
|---|---|---|---|
| A | 17926 | 157 | 0.875823% |
| B | 17927 | 366 | 2.041613% |
| C | 17927 | 225 | 1.255090% |
| D | 17927 | 541 | 3.017794% |
Noise dominated data is calculated using 1-second bins in cleaned event files. If a bin has >2000 counts, and if more than 50% of those come from <1% of pixels, then it is considered to be noise-dominated and hence unusable.
| Quadrant | # 1 sec bins | Bins with >0 counts | Bins with >2000 counts | High rate bins dominated by noise | Noise dominated (total time) | Noise dominated (detector-on time) | Marked lightcurve |
|---|---|---|---|---|---|---|---|
| A | 19851 | 17929 | 4 | 4 | 0.02% | 0.02% | 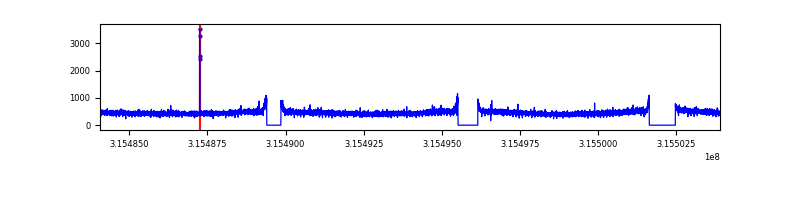 |
| B | 19852 | 17930 | 147 | 147 | 0.74% | 0.82% | 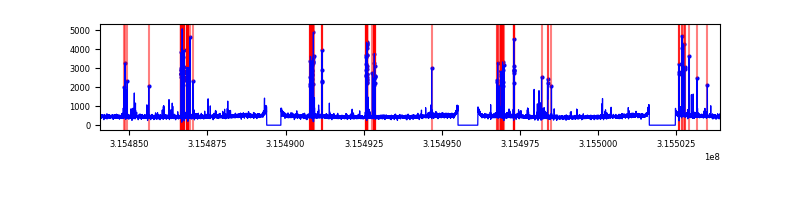 |
| C | 19852 | 17930 | 2 | 2 | 0.01% | 0.01% | 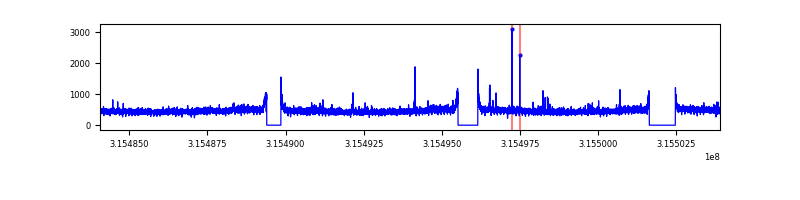 |
| D | 19852 | 17930 | 365 | 365 | 1.84% | 2.04% |  |
Top three noisy pixels from each quadrant. If the there are fewer than three noisy pixels in the level2.evt file, extra rows are filled as -1
| Pixel properties | Quadrant properties | ||||||
|---|---|---|---|---|---|---|---|
| Quadrant | DetID | PixID | Counts | Sigma | Mean | Median | Sigma |
| A | 13 | 254 | 25661 | 55.87 | 2106 | 2058 | 422.5 |
| A | 15 | 174 | 19534 | 41.37 | 2106 | 2058 | 422.5 |
| A | 3 | 137 | 19059 | 40.24 | 2106 | 2058 | 422.5 |
| B | 4 | 216 | 570258 | 1428.03 | 2087 | 2030 | 397.9 |
| B | 0 | 190 | 70625 | 172.39 | 2087 | 2030 | 397.9 |
| B | 0 | 189 | 69488 | 169.53 | 2087 | 2030 | 397.9 |
| C | 14 | 238 | 320723 | 676.3 | 2023 | 2033 | 471.2 |
| C | 10 | 9 | 33945 | 67.72 | 2023 | 2033 | 471.2 |
| C | 0 | 10 | 31544 | 62.63 | 2023 | 2033 | 471.2 |
| D | 1 | 52 | 2529832 | 5079.54 | 2043 | 1981 | 497.7 |
| D | 13 | 174 | 643747 | 1289.58 | 2043 | 1981 | 497.7 |
| D | 13 | 153 | 393956 | 787.65 | 2043 | 1981 | 497.7 |
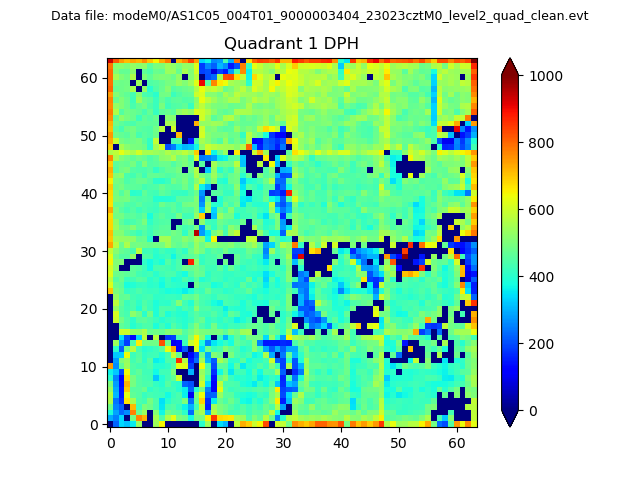
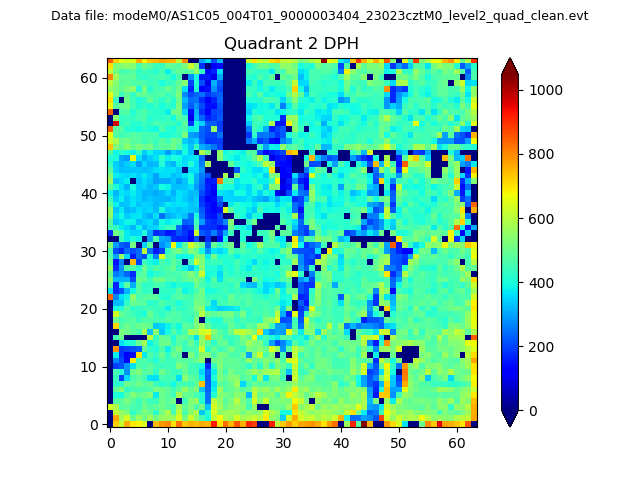
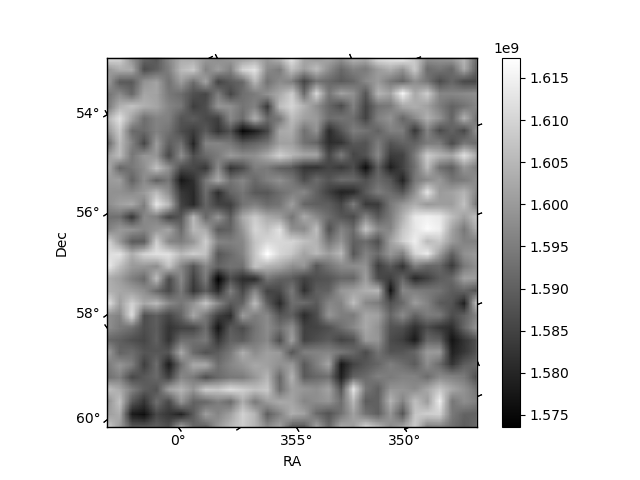
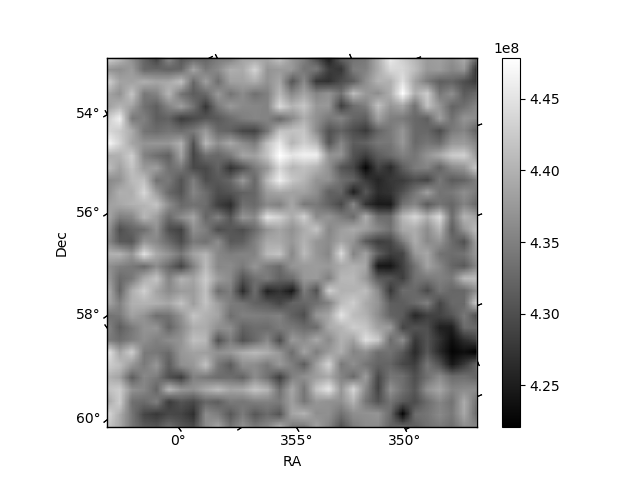
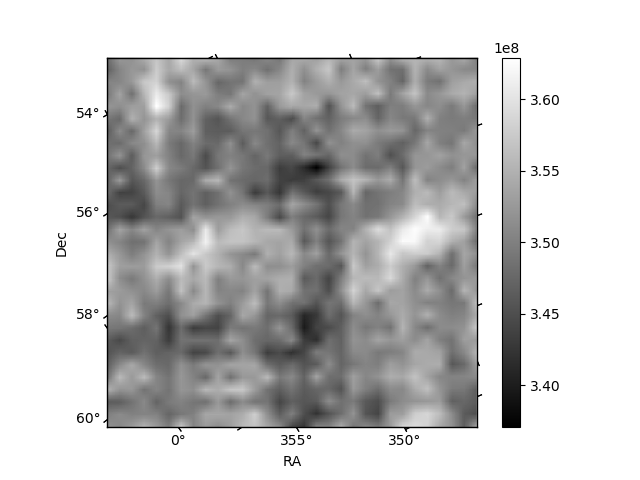
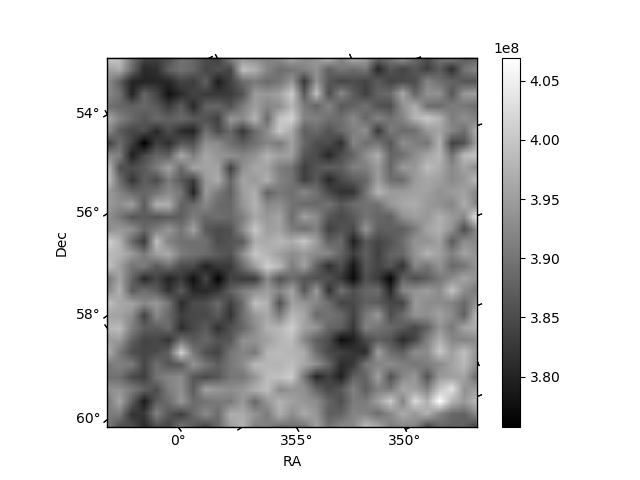
Histogram calculated using DETX and DETY for each event in the final _common_clean file
| Quadrant A | 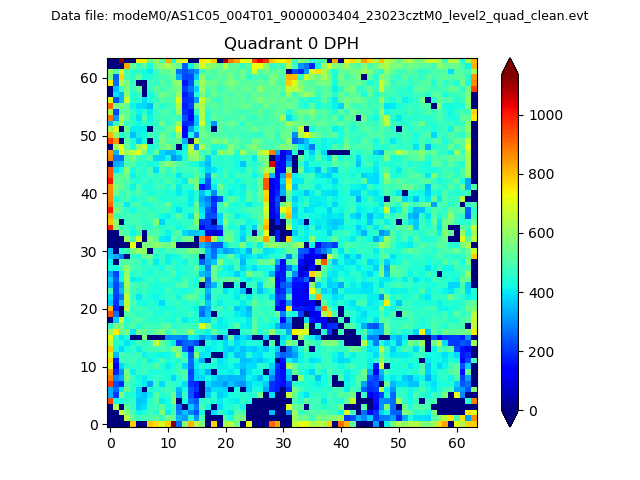 |
 |
Quadrant B |
|---|---|---|---|
| Quadrant D | 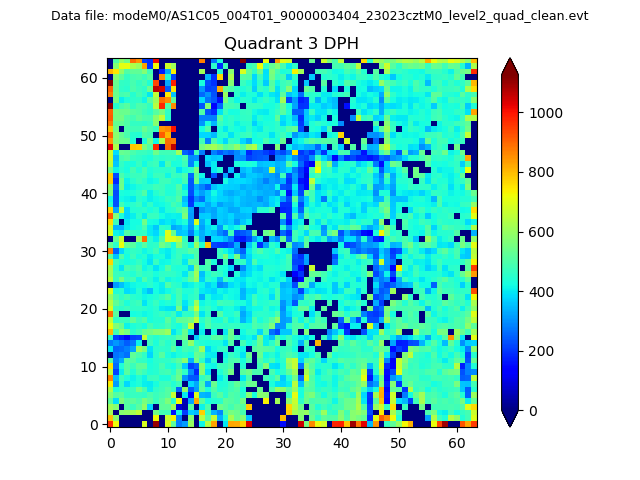 |
 |
Quadrant C |
| Plot type | Count rate plots | Images |
|---|---|---|
| Comparison with Poisson distribution Blue bars denote a histogram of data divided into 1 sec bins. Red curve is a Poisson curve with rate = median count rate of data. |
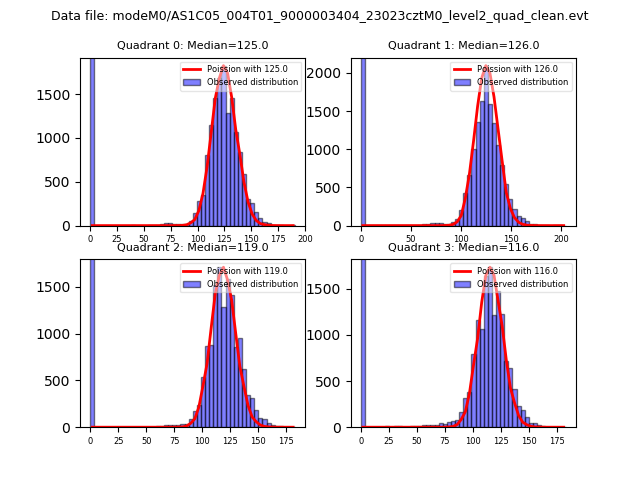 |
 |
| Quadrant-wise count rates Data is divided into 100 sec bins |
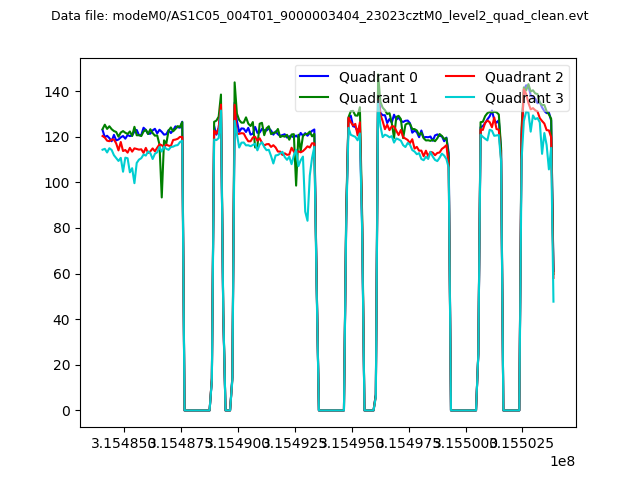 |
|
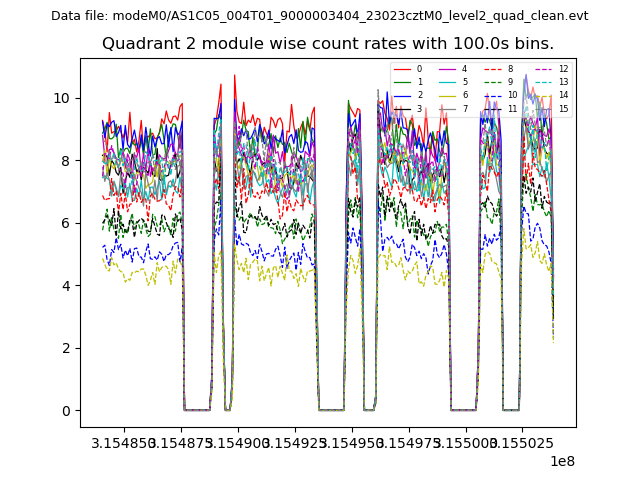
| Module-wise count rates for Quadrant A Data is divided into 100 sec bins |
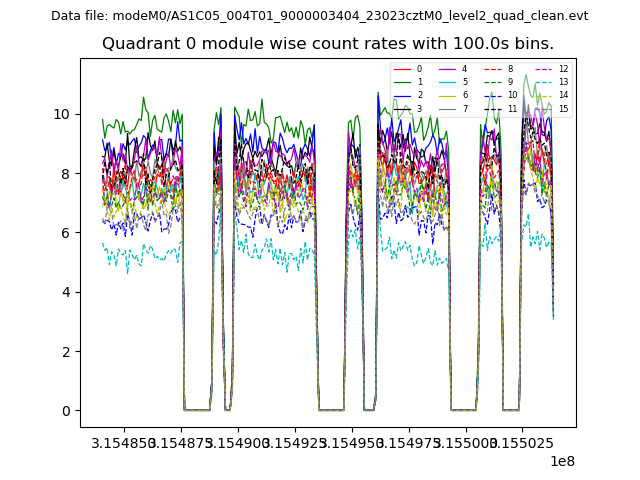 |
 |
| Module-wise count rates for Quadrant B Data is divided into 100 sec bins |
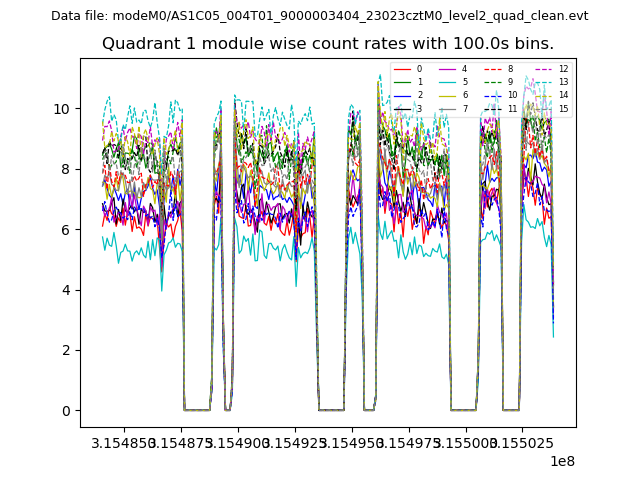 |
 |
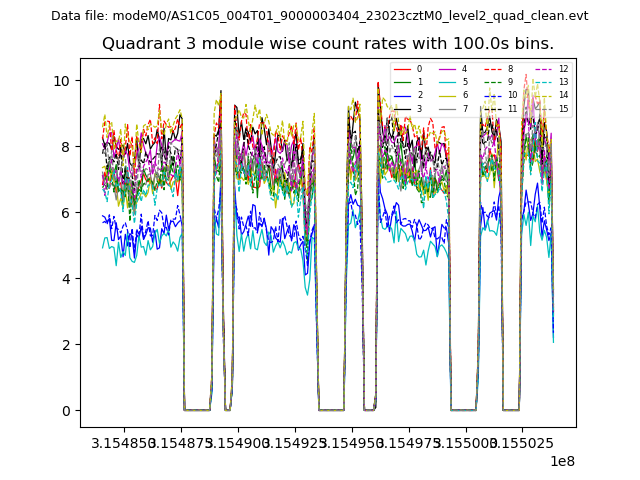
| Module-wise count rates for Quadrant C Data is divided into 100 sec bins |
 |
 |
| Module-wise count rates for Quadrant D Data is divided into 100 sec bins |
 |
 |
| Parameter | Plot |
|---|---|
| CZT HV Monitor | 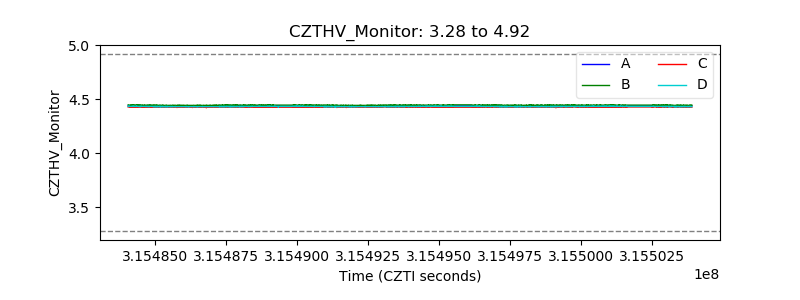 |
| D_VDD |  |
| Temperature 1 | 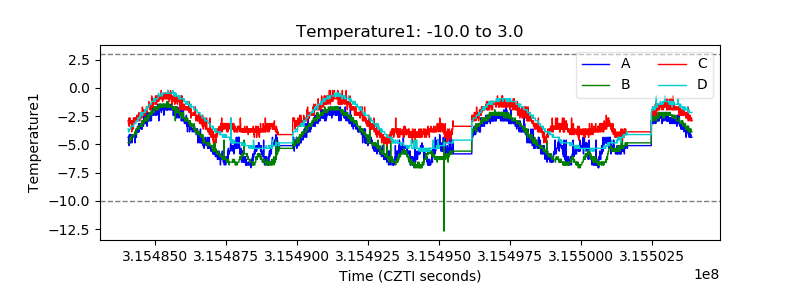 |
| Veto HV Monitor | 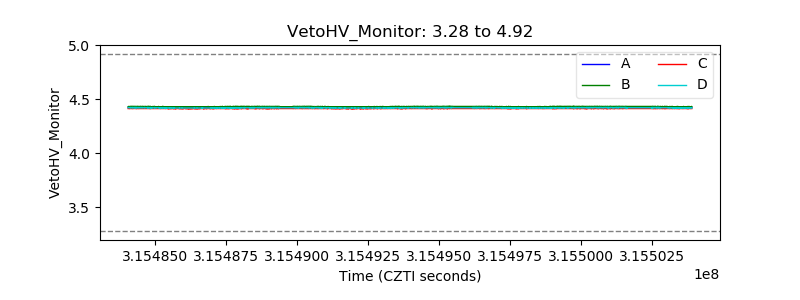 |
| Veto LLD | 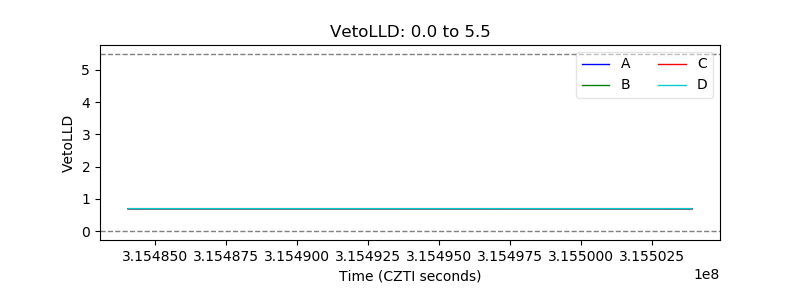 |
| Alpha Counter | 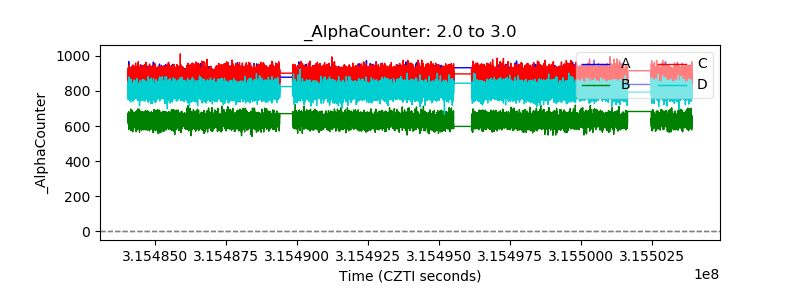 |
| _CPM_Rate | 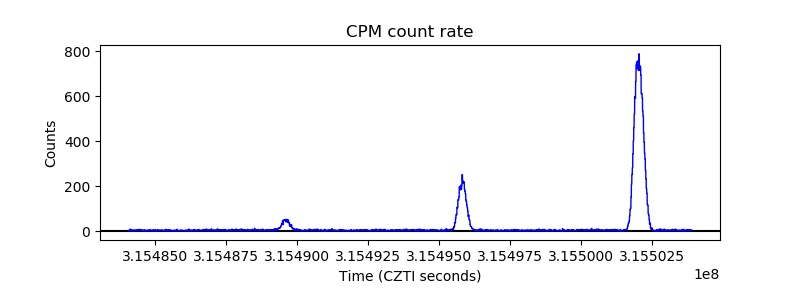 |
| CZT Counter | 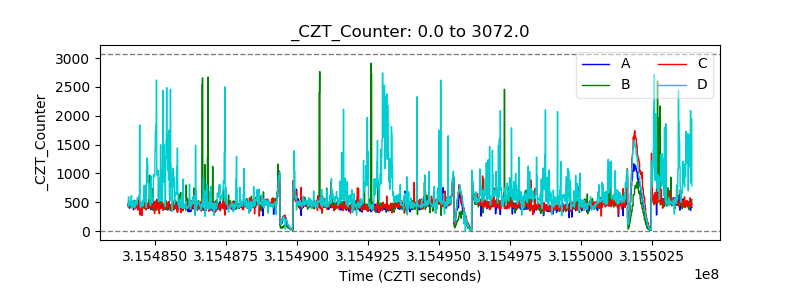 |
| +2.5 Volts monitor |  |
| +5 Volts monitor |  |
| _ROLL_ROT | 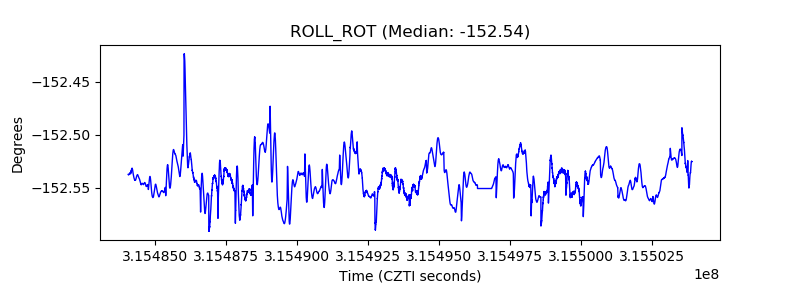 |
| _Roll_DEC | 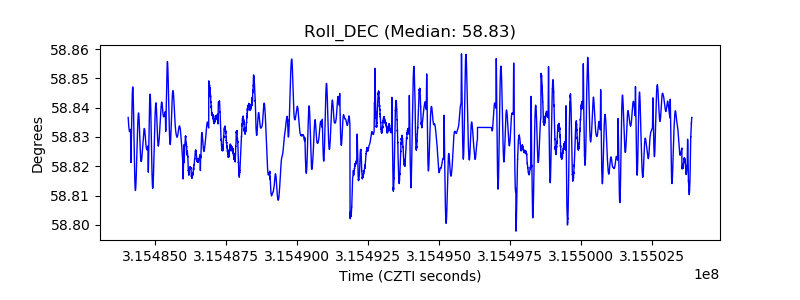 |
| _Roll_RA | 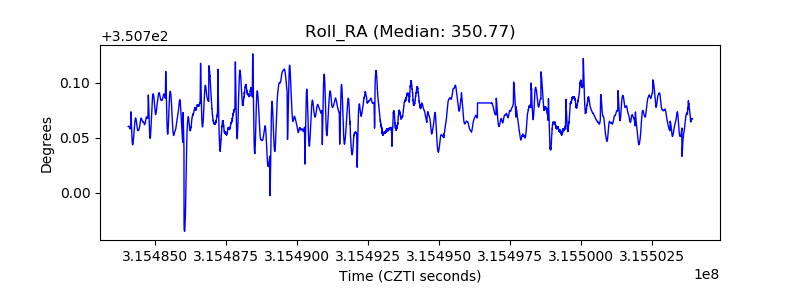 |
| Veto Counter | 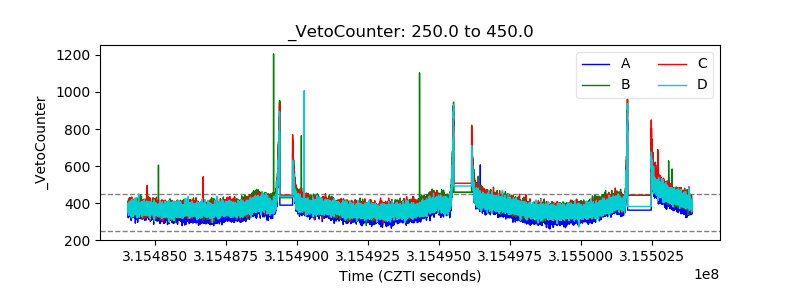 |