| Param | Original file | Final file |
|---|---|---|
| Filename | modeM0/AS1C05_004T01_9000003404_23024cztM0_level2.evt | modeM0/AS1C05_004T01_9000003404_23024cztM0_level2_quad_clean.evt |
| Size (bytes) | 446,711,040 | 99,216,000 |
| Size | 426.0 MB | 94.6 MB |
| Events in quadrant A | 2,875,700 | 655,144 |
| Events in quadrant B | 3,055,578 | 662,086 |
| Events in quadrant C | 3,005,504 | 634,997 |
| Events in quadrant D | 4,166,865 | 615,935 |
| Mode M0 | |||
|---|---|---|---|
| Quadrant | BADHDUFLAG | Total packets | Discarded packets |
| A | 0 | 12754 | 1 |
| B | 0 | 13200 | 1 |
| C | 0 | 12979 | 1 |
| D | 0 | 16589 | 1 |
| Mode SS | |||
|---|---|---|---|
| Quadrant | BADHDUFLAG | Total packets | Discarded packets |
| A | 0 | 124 | 0 |
| B | 0 | 124 | 0 |
| C | 0 | 126 | 0 |
| D | 0 | 126 | 0 |
| Mode M9 | |||
|---|---|---|---|
| Quadrant | BADHDUFLAG | Total packets | Discarded packets |
| A | 0 | 11 | 0 |
| B | 0 | 11 | 0 |
| C | 0 | 11 | 0 |
| D | 0 | 11 | 0 |
| Quadrant | Total seconds | Saturated seconds | Saturation percentage |
|---|---|---|---|
| A | 6263 | 27 | 0.431103% |
| B | 6263 | 70 | 1.117675% |
| C | 6264 | 62 | 0.989783% |
| D | 6263 | 184 | 2.937889% |
Noise dominated data is calculated using 1-second bins in cleaned event files. If a bin has >2000 counts, and if more than 50% of those come from <1% of pixels, then it is considered to be noise-dominated and hence unusable.
| Quadrant | # 1 sec bins | Bins with >0 counts | Bins with >2000 counts | High rate bins dominated by noise | Noise dominated (total time) | Noise dominated (detector-on time) | Marked lightcurve |
|---|---|---|---|---|---|---|---|
| A | 7283 | 6264 | 0 | 0 | 0.00% | 0.00% | 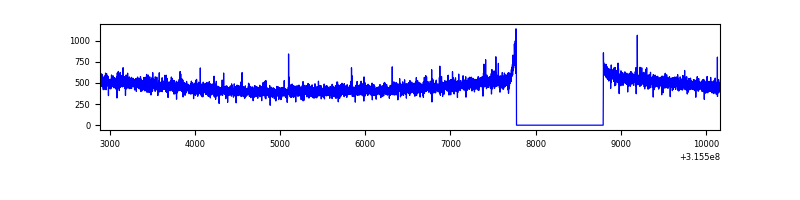 |
| B | 7283 | 6264 | 25 | 25 | 0.34% | 0.40% | 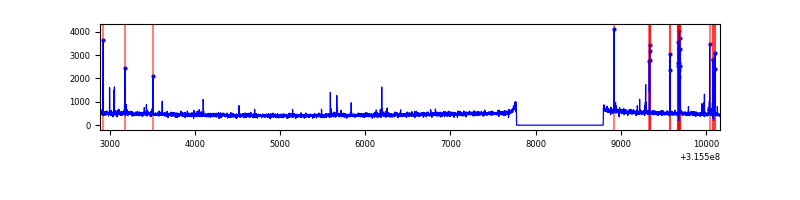 |
| C | 7284 | 6265 | 3 | 3 | 0.04% | 0.05% | 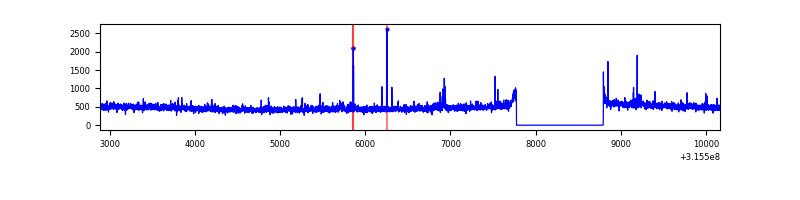 |
| D | 7283 | 6264 | 135 | 135 | 1.85% | 2.16% | 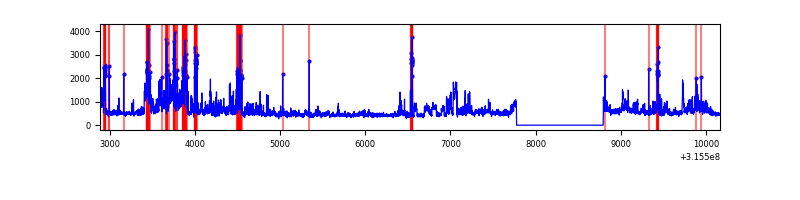 |
Top three noisy pixels from each quadrant. If the there are fewer than three noisy pixels in the level2.evt file, extra rows are filled as -1
| Pixel properties | Quadrant properties | ||||||
|---|---|---|---|---|---|---|---|
| Quadrant | DetID | PixID | Counts | Sigma | Mean | Median | Sigma |
| A | 13 | 254 | 8807 | 53.73 | 743 | 728 | 150.4 |
| A | 6 | 16 | 7583 | 45.59 | 743 | 728 | 150.4 |
| A | 3 | 137 | 6440 | 37.99 | 743 | 728 | 150.4 |
| B | 4 | 216 | 108395 | 761.61 | 739 | 719 | 141.4 |
| B | 0 | 190 | 22602 | 154.78 | 739 | 719 | 141.4 |
| B | 0 | 189 | 18768 | 127.66 | 739 | 719 | 141.4 |
| C | 14 | 238 | 115446 | 681.1 | 720 | 725 | 168.4 |
| C | 0 | 207 | 49740 | 291.0 | 720 | 725 | 168.4 |
| C | 0 | 10 | 12090 | 67.47 | 720 | 725 | 168.4 |
| D | 9 | 85 | 443291 | 2526.86 | 724 | 704 | 175.2 |
| D | 1 | 52 | 372866 | 2124.78 | 724 | 704 | 175.2 |
| D | 12 | 227 | 256369 | 1459.67 | 724 | 704 | 175.2 |
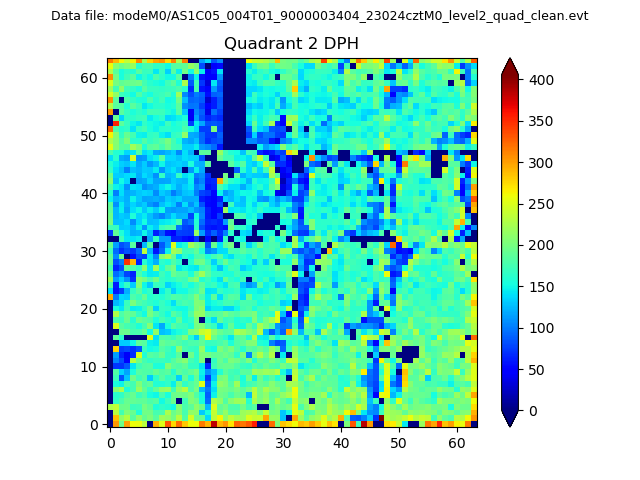
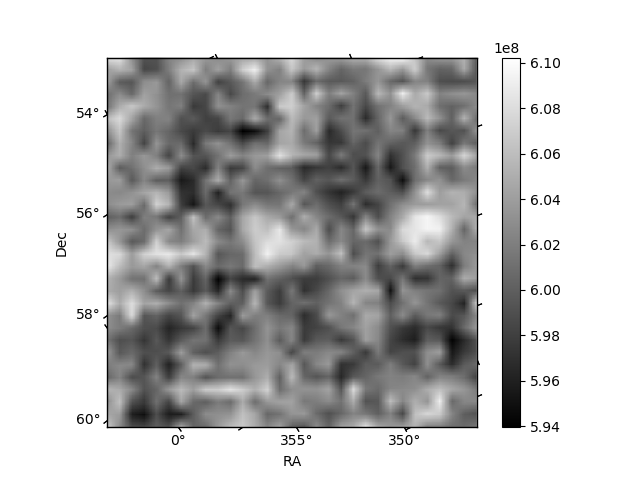
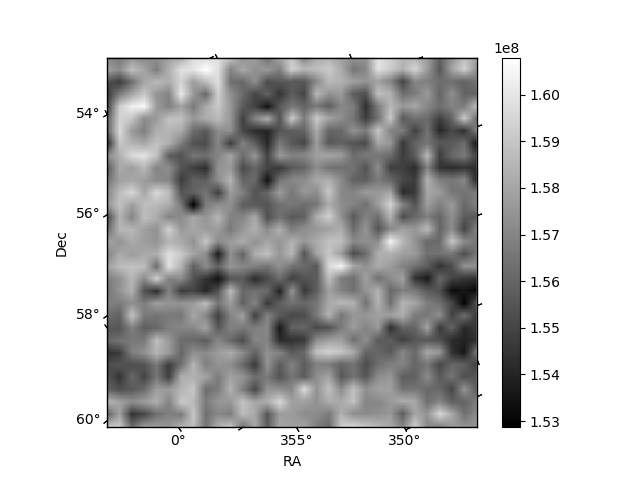
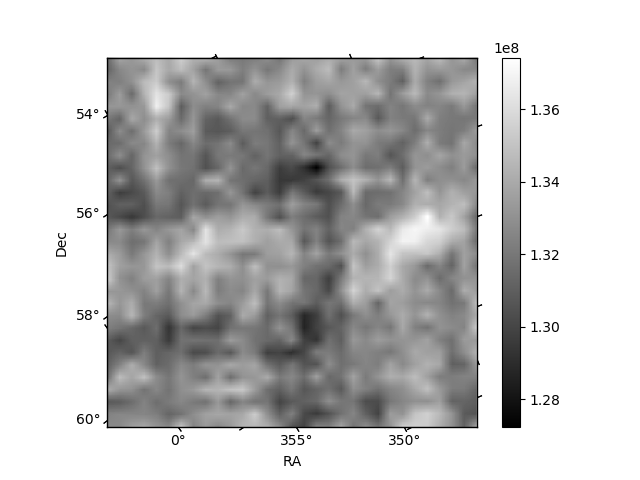
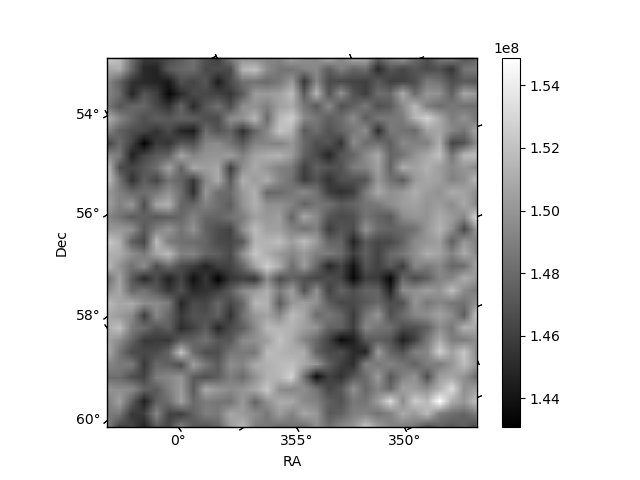
Histogram calculated using DETX and DETY for each event in the final _common_clean file
| Quadrant A | 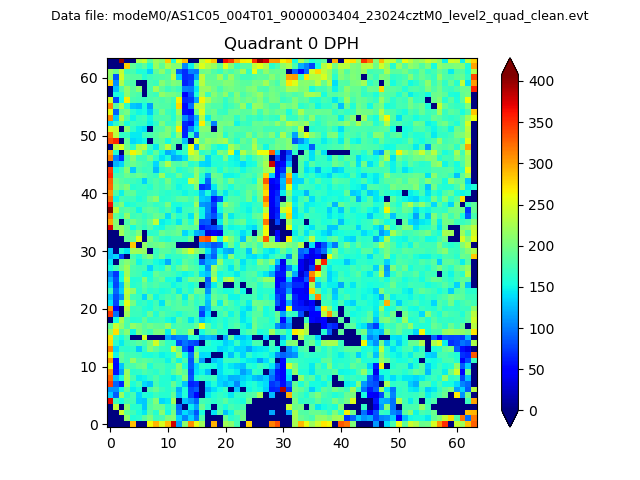 |
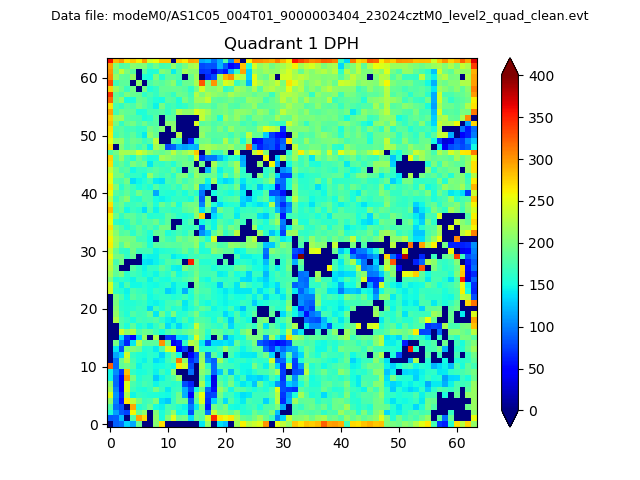 |
Quadrant B |
|---|---|---|---|
| Quadrant D | 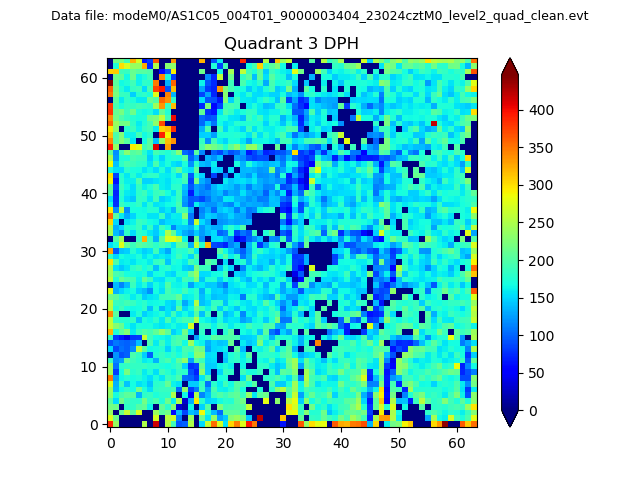 |
 |
Quadrant C |
| Plot type | Count rate plots | Images |
|---|---|---|
| Comparison with Poisson distribution Blue bars denote a histogram of data divided into 1 sec bins. Red curve is a Poisson curve with rate = median count rate of data. |
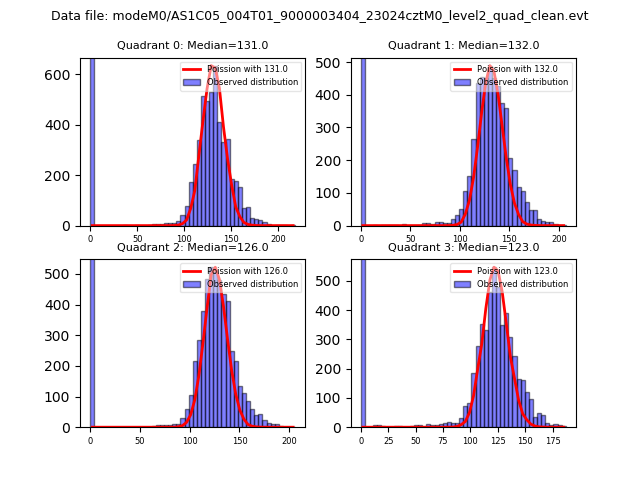 |
 |
| Quadrant-wise count rates Data is divided into 100 sec bins |
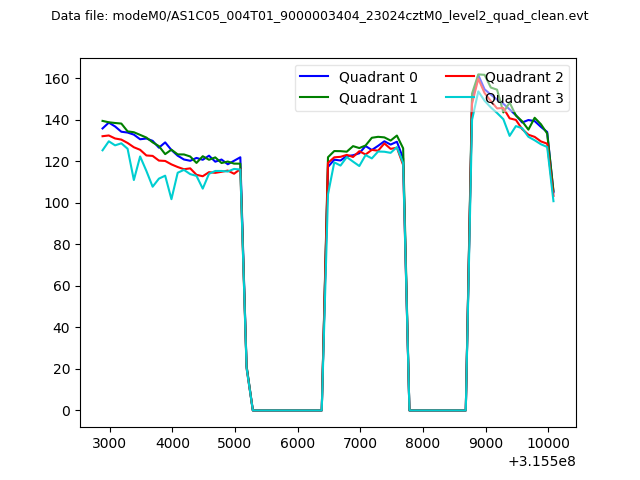 |
|
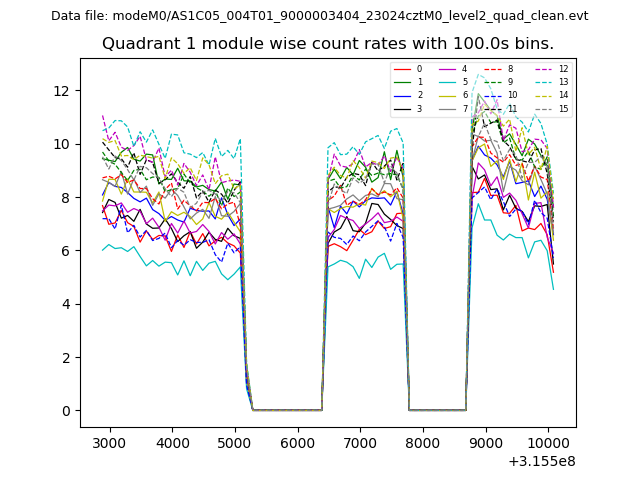
| Module-wise count rates for Quadrant A Data is divided into 100 sec bins |
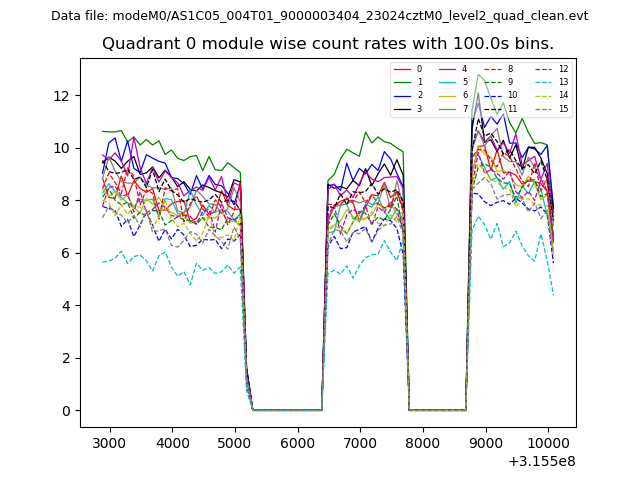 |
 |
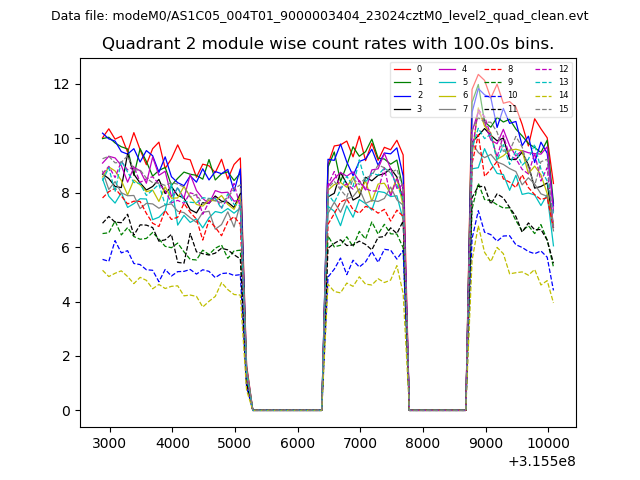
| Module-wise count rates for Quadrant B Data is divided into 100 sec bins |
 |
 |
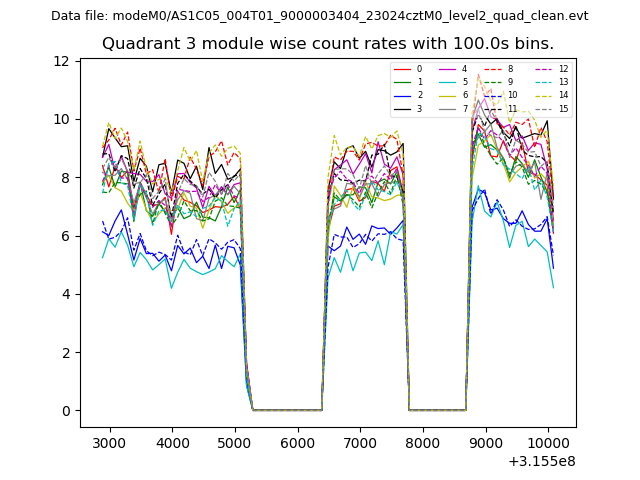
| Module-wise count rates for Quadrant C Data is divided into 100 sec bins |
 |
 |
| Module-wise count rates for Quadrant D Data is divided into 100 sec bins |
 |
 |
| Parameter | Plot |
|---|---|
| CZT HV Monitor |  |
| D_VDD | 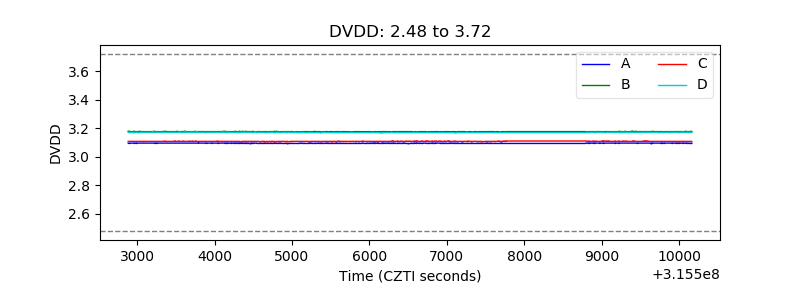 |
| Temperature 1 | 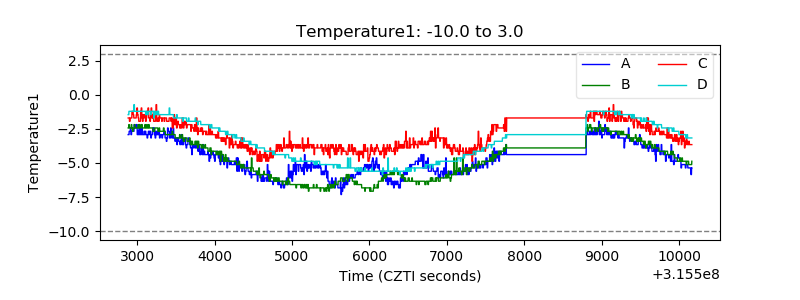 |
| Veto HV Monitor | 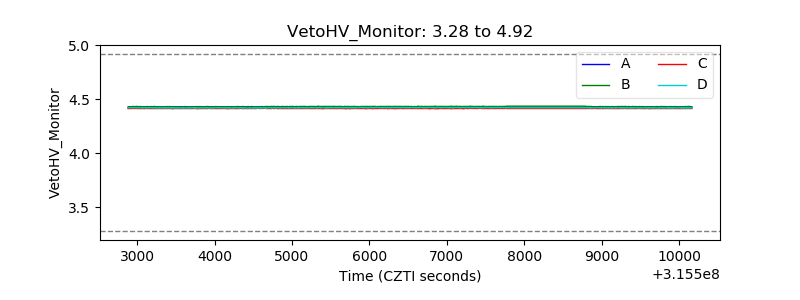 |
| Veto LLD | 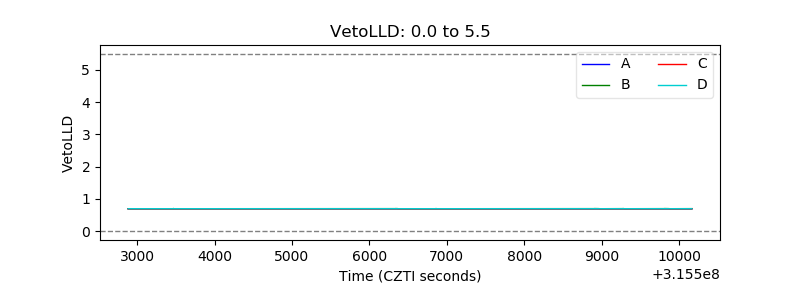 |
| Alpha Counter | 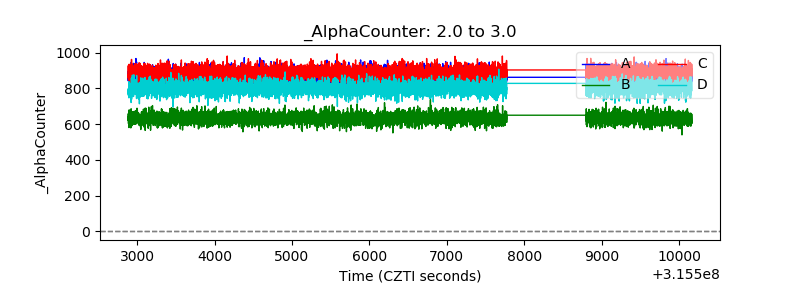 |
| _CPM_Rate | 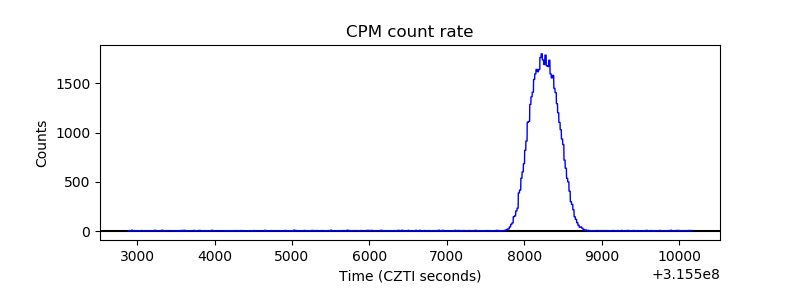 |
| CZT Counter | 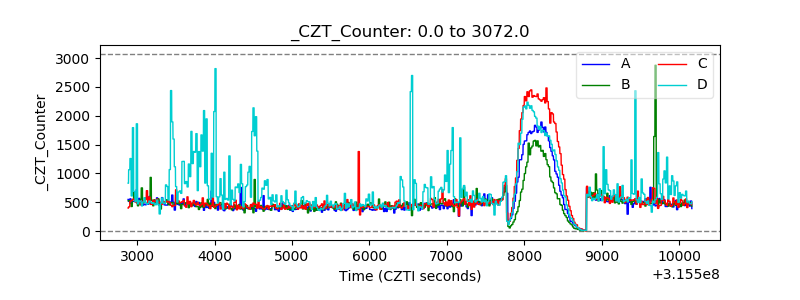 |
| +2.5 Volts monitor |  |
| +5 Volts monitor |  |
| _ROLL_ROT | 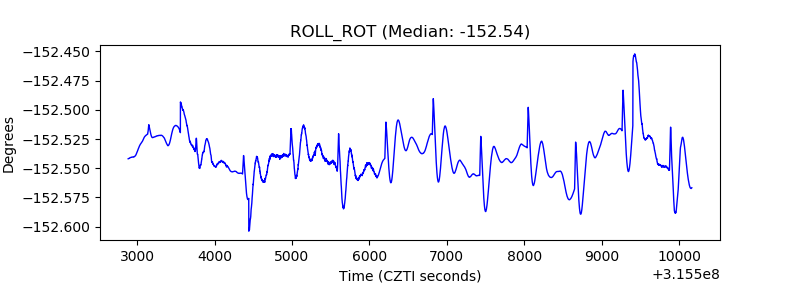 |
| _Roll_DEC | 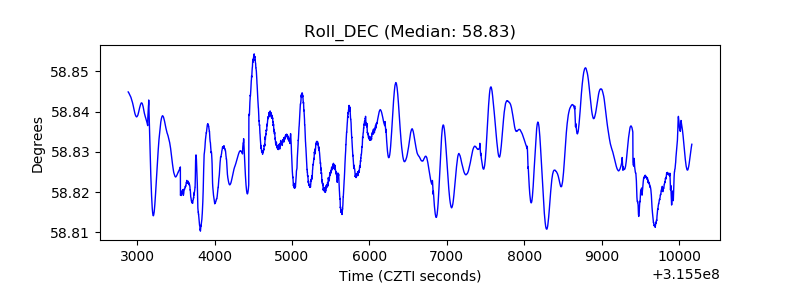 |
| _Roll_RA | 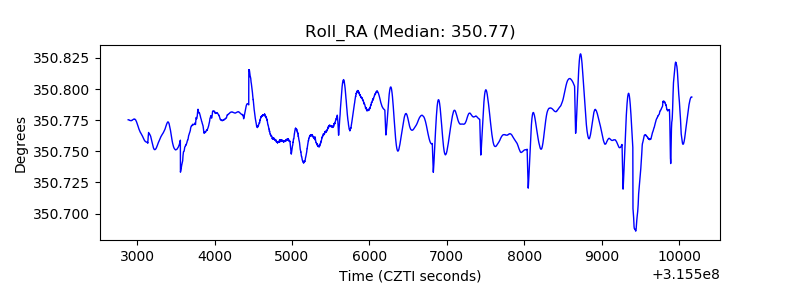 |
| Veto Counter | 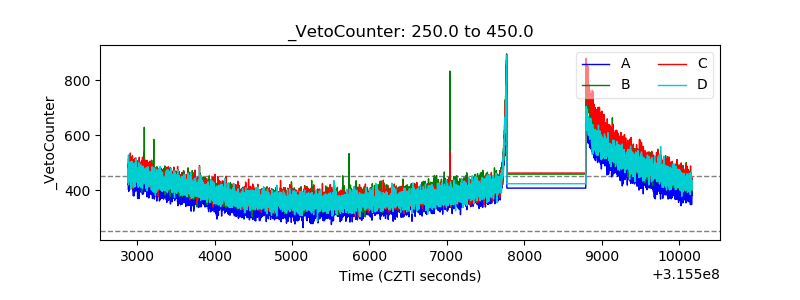 |