| Param | Original file | Final file |
|---|---|---|
| Filename | modeM0/AS1C05_004T01_9000003404_23026cztM0_level2.evt | modeM0/AS1C05_004T01_9000003404_23026cztM0_level2_quad_clean.evt |
| Size (bytes) | 469,837,440 | 102,317,760 |
| Size | 448.1 MB | 97.6 MB |
| Events in quadrant A | 2,905,762 | 681,614 |
| Events in quadrant B | 3,119,530 | 694,356 |
| Events in quadrant C | 3,652,523 | 653,225 |
| Events in quadrant D | 4,130,355 | 636,807 |
| Mode M0 | |||
|---|---|---|---|
| Quadrant | BADHDUFLAG | Total packets | Discarded packets |
| A | 0 | 12756 | 1 |
| B | 0 | 13304 | 1 |
| C | 0 | 14857 | 1 |
| D | 0 | 16642 | 1 |
| Mode SS | |||
|---|---|---|---|
| Quadrant | BADHDUFLAG | Total packets | Discarded packets |
| A | 0 | 126 | 0 |
| B | 0 | 126 | 0 |
| C | 0 | 126 | 0 |
| D | 0 | 126 | 0 |
| Mode M9 | |||
|---|---|---|---|
| Quadrant | BADHDUFLAG | Total packets | Discarded packets |
| A | 0 | 11 | 0 |
| B | 0 | 11 | 0 |
| C | 0 | 11 | 0 |
| D | 0 | 11 | 0 |
| Quadrant | Total seconds | Saturated seconds | Saturation percentage |
|---|---|---|---|
| A | 6197 | 21 | 0.338874% |
| B | 6198 | 69 | 1.113262% |
| C | 6198 | 253 | 4.081962% |
| D | 6198 | 225 | 3.630203% |
Noise dominated data is calculated using 1-second bins in cleaned event files. If a bin has >2000 counts, and if more than 50% of those come from <1% of pixels, then it is considered to be noise-dominated and hence unusable.
| Quadrant | # 1 sec bins | Bins with >0 counts | Bins with >2000 counts | High rate bins dominated by noise | Noise dominated (total time) | Noise dominated (detector-on time) | Marked lightcurve |
|---|---|---|---|---|---|---|---|
| A | 7352 | 6198 | 0 | 0 | 0.00% | 0.00% | 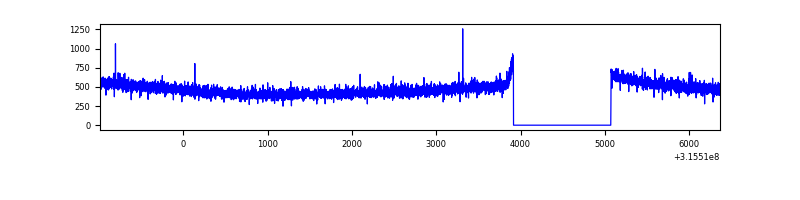 |
| B | 7353 | 6199 | 27 | 27 | 0.37% | 0.44% | 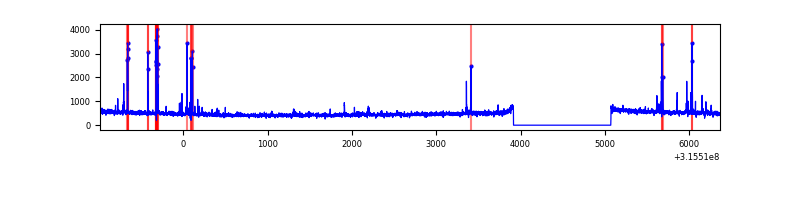 |
| C | 7353 | 6199 | 148 | 148 | 2.01% | 2.39% | 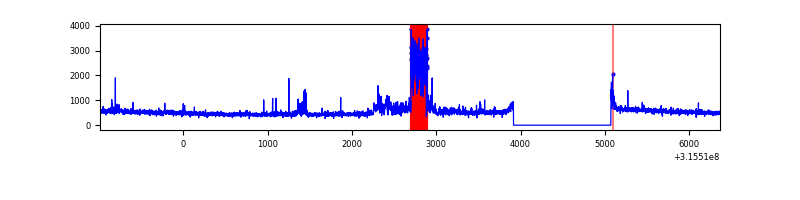 |
| D | 7353 | 6199 | 129 | 129 | 1.75% | 2.08% | 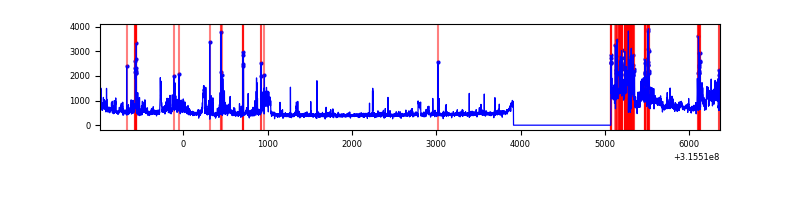 |
Top three noisy pixels from each quadrant. If the there are fewer than three noisy pixels in the level2.evt file, extra rows are filled as -1
| Pixel properties | Quadrant properties | ||||||
|---|---|---|---|---|---|---|---|
| Quadrant | DetID | PixID | Counts | Sigma | Mean | Median | Sigma |
| A | 13 | 254 | 9220 | 56.01 | 752 | 735 | 151.5 |
| A | 0 | 226 | 6506 | 38.1 | 752 | 735 | 151.5 |
| A | 3 | 137 | 6224 | 36.24 | 752 | 735 | 151.5 |
| B | 4 | 216 | 122711 | 871.43 | 750 | 732 | 140.0 |
| B | 0 | 189 | 30429 | 212.16 | 750 | 732 | 140.0 |
| B | 12 | 111 | 16944 | 115.82 | 750 | 732 | 140.0 |
| C | 10 | 9 | 581902 | 3434.66 | 726 | 731 | 169.2 |
| C | 14 | 238 | 115699 | 679.45 | 726 | 731 | 169.2 |
| C | 0 | 207 | 74878 | 438.2 | 726 | 731 | 169.2 |
| D | 9 | 85 | 519039 | 2931.65 | 733 | 712 | 176.8 |
| D | 1 | 52 | 315850 | 1782.41 | 733 | 712 | 176.8 |
| D | 12 | 227 | 257798 | 1454.07 | 733 | 712 | 176.8 |
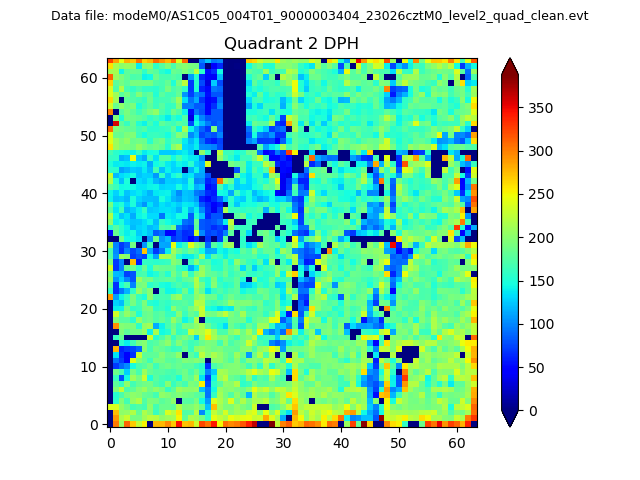
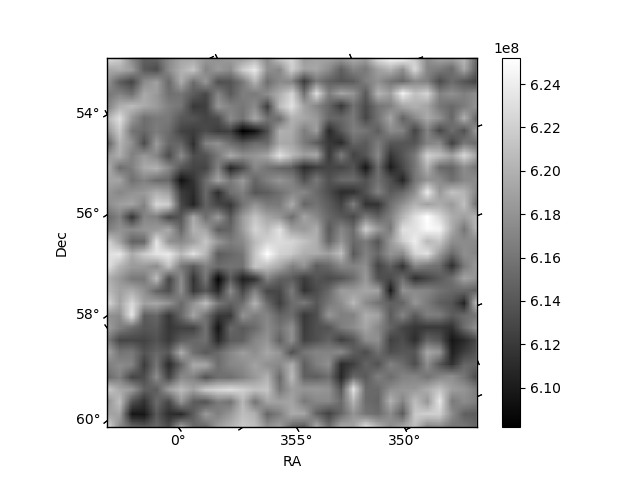
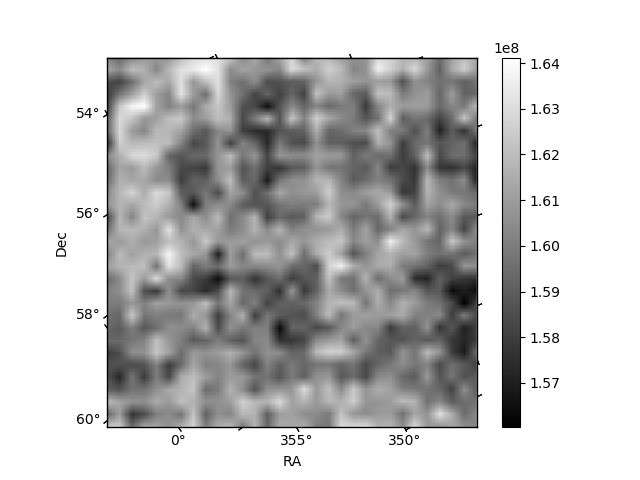
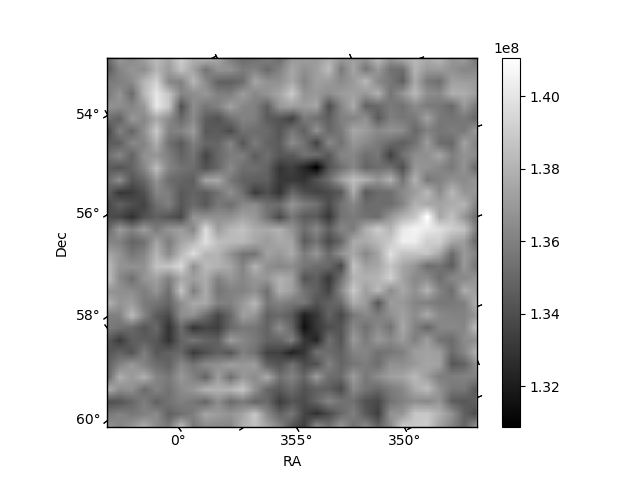
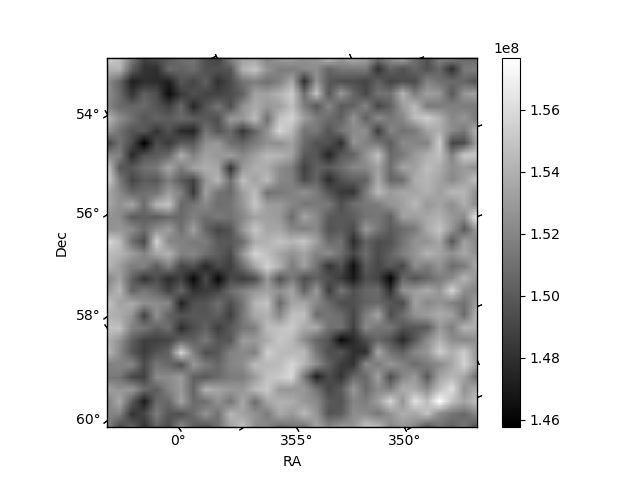
Histogram calculated using DETX and DETY for each event in the final _common_clean file
| Quadrant A | 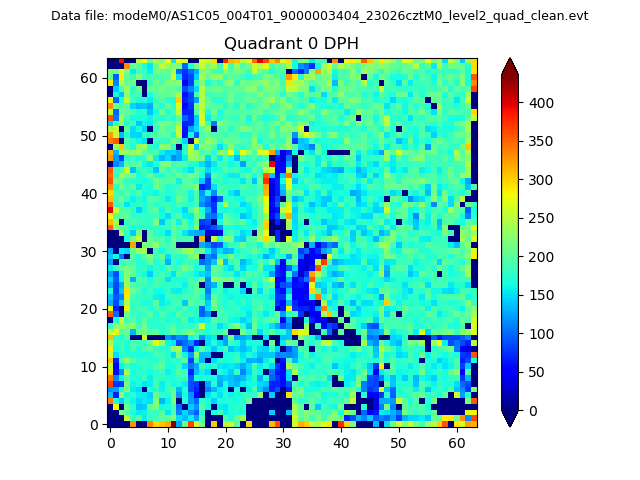 |
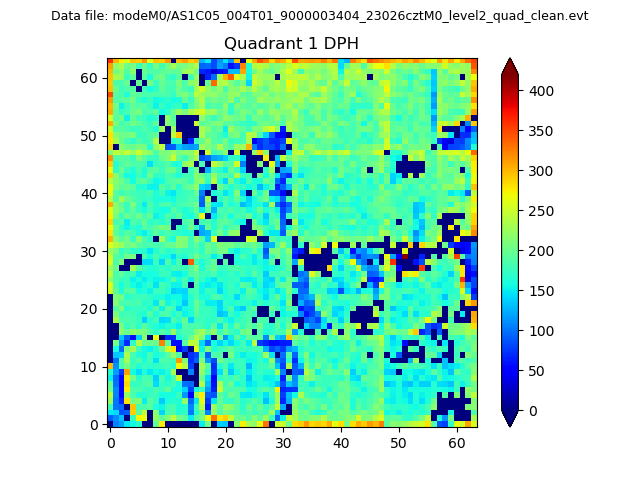 |
Quadrant B |
|---|---|---|---|
| Quadrant D | 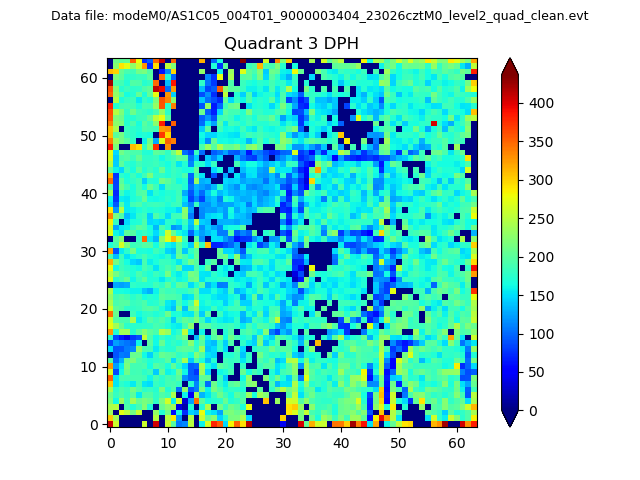 |
 |
Quadrant C |
| Plot type | Count rate plots | Images |
|---|---|---|
| Comparison with Poisson distribution Blue bars denote a histogram of data divided into 1 sec bins. Red curve is a Poisson curve with rate = median count rate of data. |
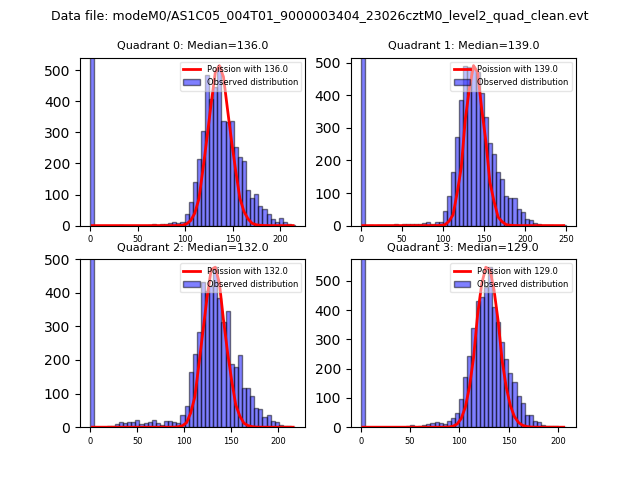 |
 |
| Quadrant-wise count rates Data is divided into 100 sec bins |
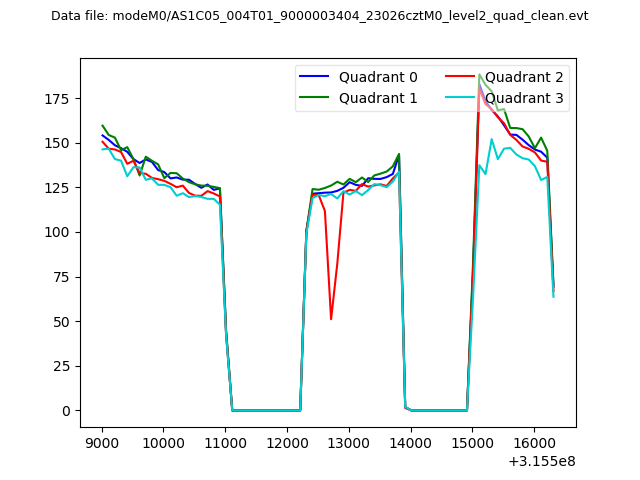 |
|
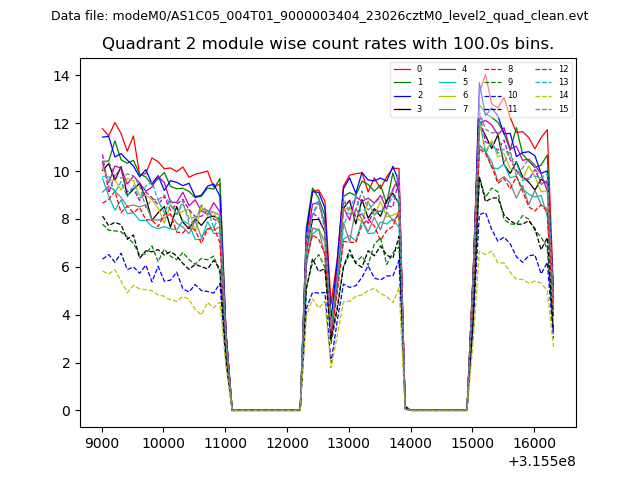
| Module-wise count rates for Quadrant A Data is divided into 100 sec bins |
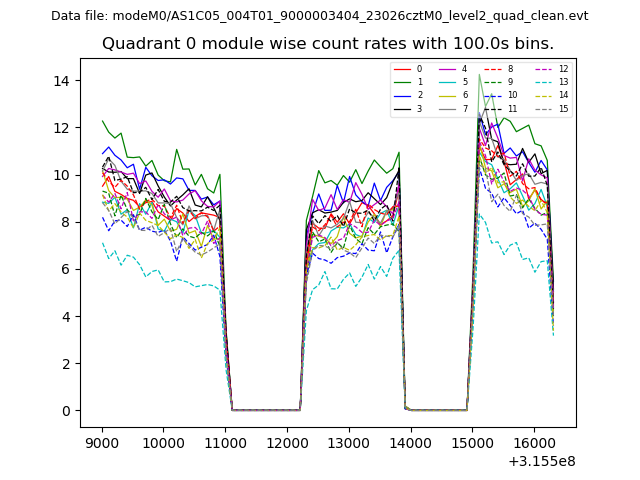 |
 |
| Module-wise count rates for Quadrant B Data is divided into 100 sec bins |
 |
 |
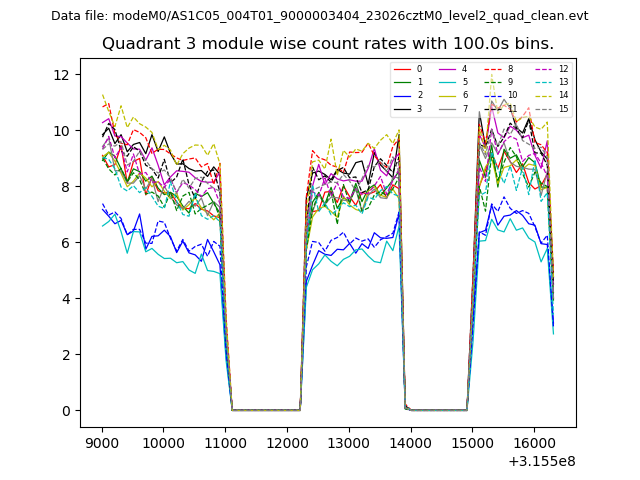
| Module-wise count rates for Quadrant C Data is divided into 100 sec bins |
 |
 |
| Module-wise count rates for Quadrant D Data is divided into 100 sec bins |
 |
 |
| Parameter | Plot |
|---|---|
| CZT HV Monitor | 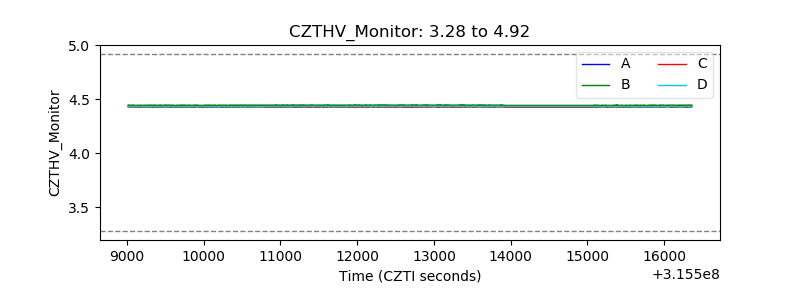 |
| D_VDD |  |
| Temperature 1 | 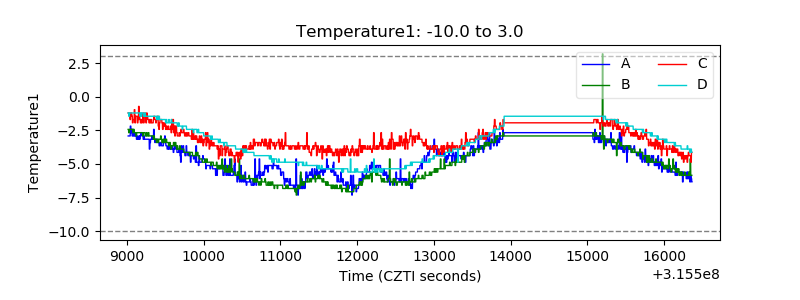 |
| Veto HV Monitor | 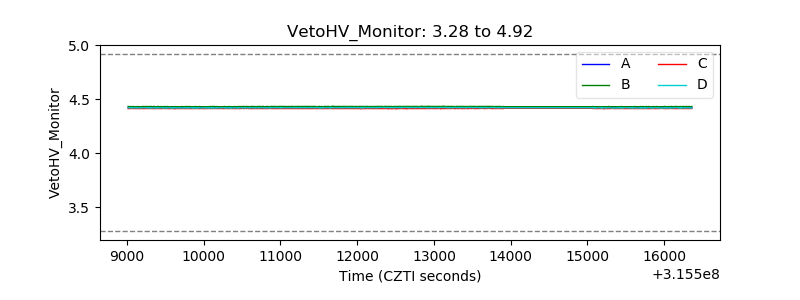 |
| Veto LLD | 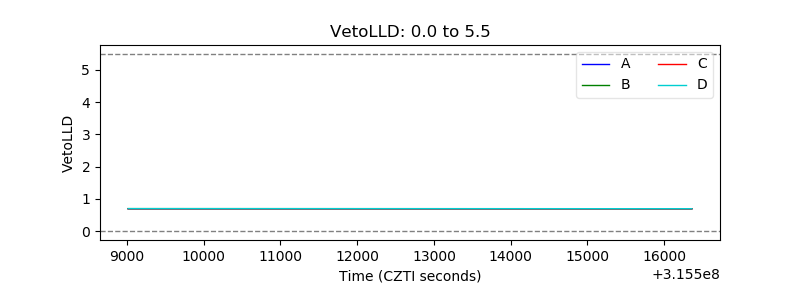 |
| Alpha Counter | 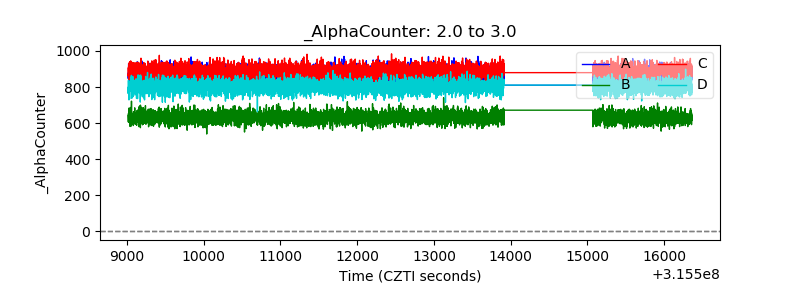 |
| _CPM_Rate | 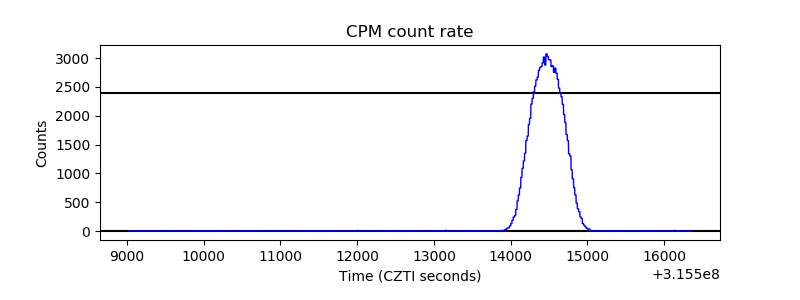 |
| CZT Counter | 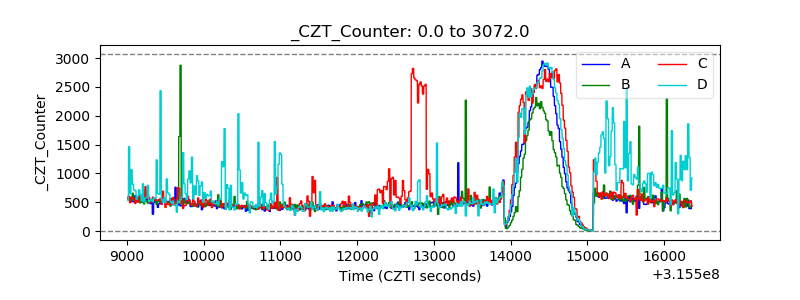 |
| +2.5 Volts monitor |  |
| +5 Volts monitor |  |
| _ROLL_ROT | 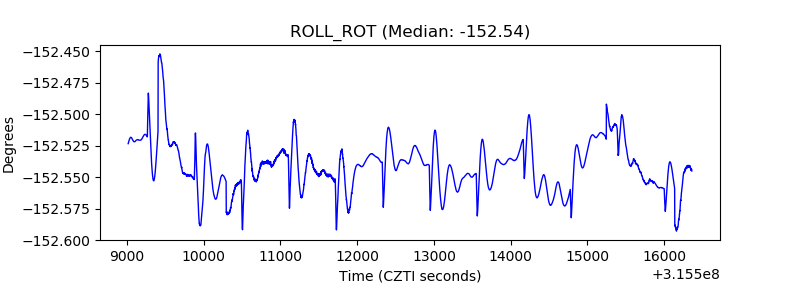 |
| _Roll_DEC | 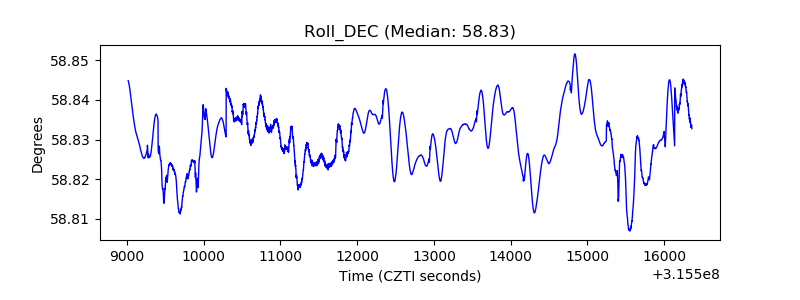 |
| _Roll_RA | 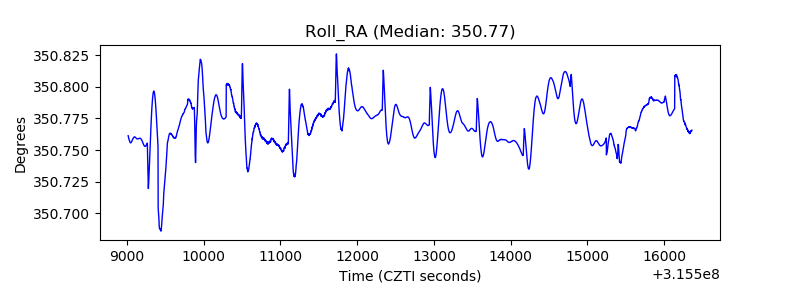 |
| Veto Counter | 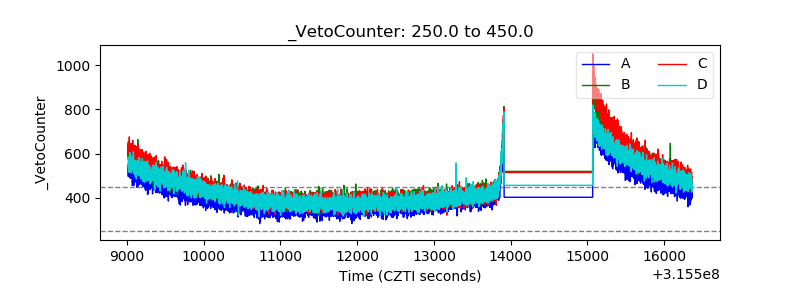 |