| Param | Original file | Final file |
|---|---|---|
| Filename | modeM0/AS1C05_004T01_9000003404_23027cztM0_level2.evt | modeM0/AS1C05_004T01_9000003404_23027cztM0_level2_quad_clean.evt |
| Size (bytes) | 503,259,840 | 107,573,760 |
| Size | 479.9 MB | 102.6 MB |
| Events in quadrant A | 2,983,627 | 719,940 |
| Events in quadrant B | 3,207,001 | 743,057 |
| Events in quadrant C | 3,217,308 | 712,655 |
| Events in quadrant D | 5,414,717 | 651,326 |
| Mode M0 | |||
|---|---|---|---|
| Quadrant | BADHDUFLAG | Total packets | Discarded packets |
| A | 0 | 12946 | 2 |
| B | 0 | 13563 | 2 |
| C | 0 | 13586 | 2 |
| D | 0 | 20306 | 2 |
| Mode SS | |||
|---|---|---|---|
| Quadrant | BADHDUFLAG | Total packets | Discarded packets |
| A | 0 | 126 | 0 |
| B | 0 | 126 | 0 |
| C | 0 | 126 | 0 |
| D | 0 | 126 | 0 |
| Mode M9 | |||
|---|---|---|---|
| Quadrant | BADHDUFLAG | Total packets | Discarded packets |
| A | 0 | 21 | 0 |
| B | 0 | 22 | 0 |
| C | 0 | 22 | 0 |
| D | 0 | 22 | 0 |
| Quadrant | Total seconds | Saturated seconds | Saturation percentage |
|---|---|---|---|
| A | 6171 | 18 | 0.291687% |
| B | 6171 | 47 | 0.761627% |
| C | 6171 | 89 | 1.442230% |
| D | 6170 | 482 | 7.811994% |
Noise dominated data is calculated using 1-second bins in cleaned event files. If a bin has >2000 counts, and if more than 50% of those come from <1% of pixels, then it is considered to be noise-dominated and hence unusable.
| Quadrant | # 1 sec bins | Bins with >0 counts | Bins with >2000 counts | High rate bins dominated by noise | Noise dominated (total time) | Noise dominated (detector-on time) | Marked lightcurve |
|---|---|---|---|---|---|---|---|
| A | 7441 | 6172 | 0 | 0 | 0.00% | 0.00% | 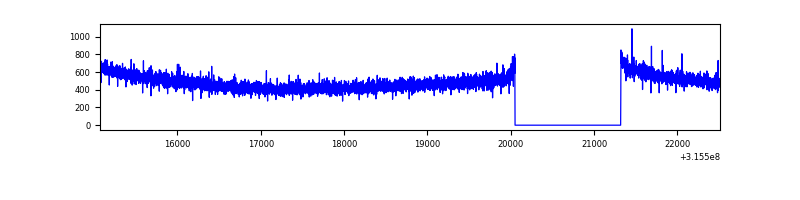 |
| B | 7441 | 6172 | 19 | 19 | 0.26% | 0.31% | 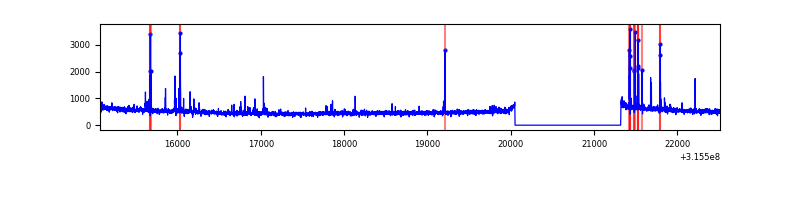 |
| C | 7441 | 6172 | 8 | 8 | 0.11% | 0.13% | 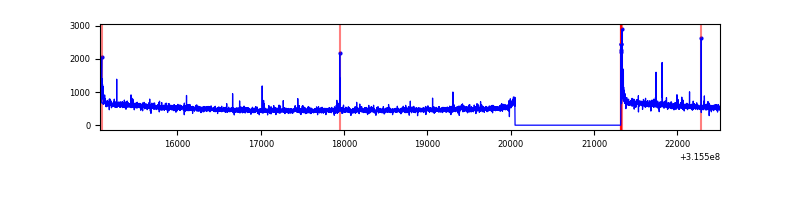 |
| D | 7440 | 6171 | 313 | 313 | 4.21% | 5.07% | 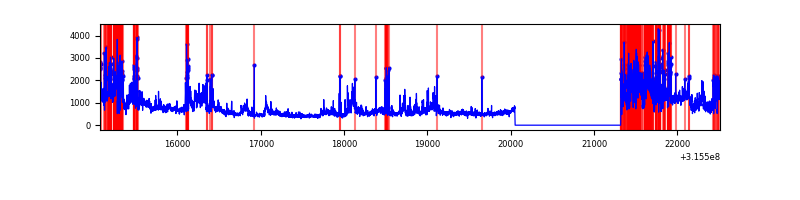 |
Top three noisy pixels from each quadrant. If the there are fewer than three noisy pixels in the level2.evt file, extra rows are filled as -1
| Pixel properties | Quadrant properties | ||||||
|---|---|---|---|---|---|---|---|
| Quadrant | DetID | PixID | Counts | Sigma | Mean | Median | Sigma |
| A | 13 | 254 | 8796 | 52.61 | 773 | 759 | 152.8 |
| A | 0 | 226 | 6560 | 37.98 | 773 | 759 | 152.8 |
| A | 3 | 137 | 6536 | 37.82 | 773 | 759 | 152.8 |
| B | 4 | 216 | 100476 | 693.15 | 778 | 760 | 143.9 |
| B | 0 | 189 | 31043 | 210.5 | 778 | 760 | 143.9 |
| B | 3 | 209 | 20124 | 134.6 | 778 | 760 | 143.9 |
| C | 14 | 238 | 123323 | 696.69 | 763 | 769 | 175.9 |
| C | 0 | 207 | 65120 | 365.82 | 763 | 769 | 175.9 |
| C | 0 | 10 | 41448 | 231.25 | 763 | 769 | 175.9 |
| D | 9 | 85 | 940912 | 5316.14 | 742 | 723 | 176.9 |
| D | 12 | 227 | 639770 | 3613.38 | 742 | 723 | 176.9 |
| D | 1 | 52 | 599774 | 3387.23 | 742 | 723 | 176.9 |
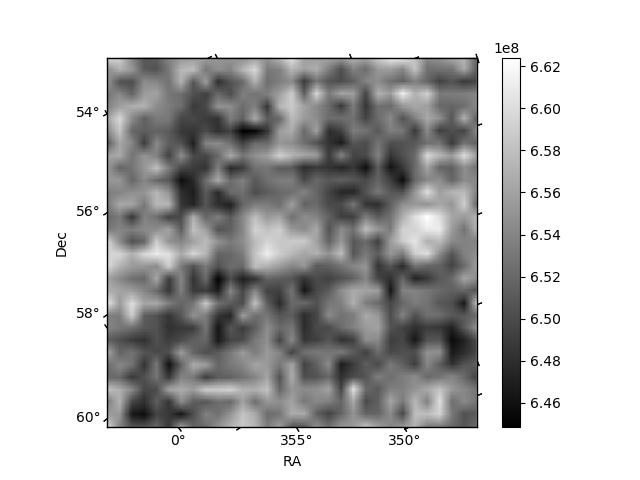
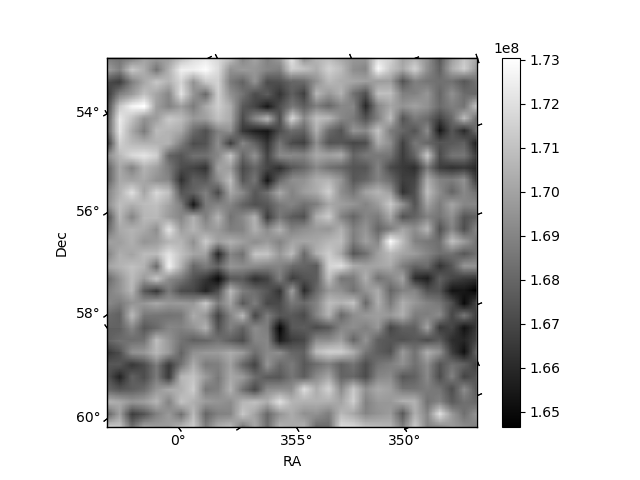
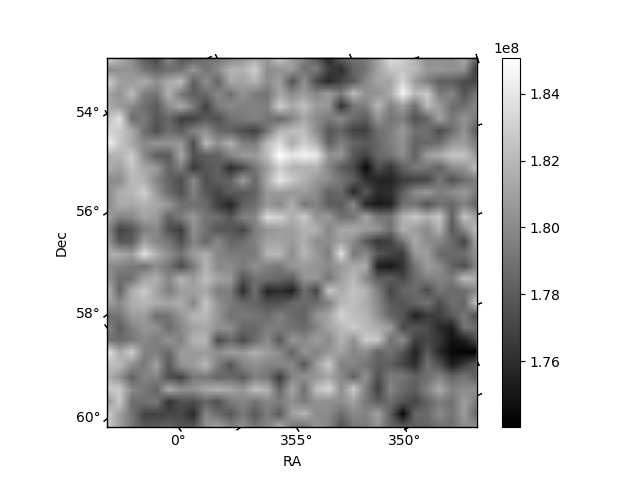
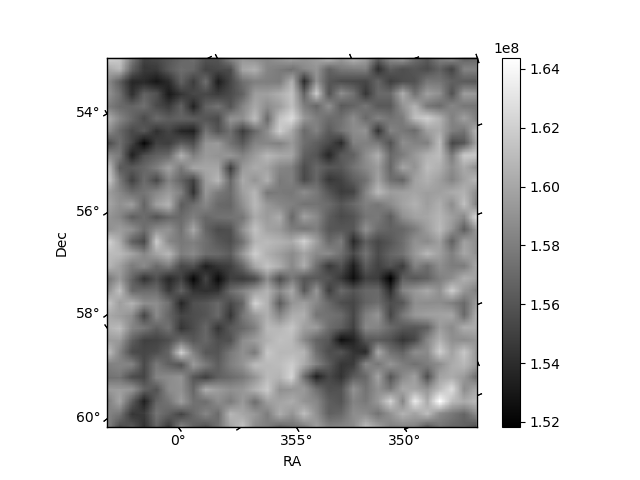
Histogram calculated using DETX and DETY for each event in the final _common_clean file
| Quadrant A | 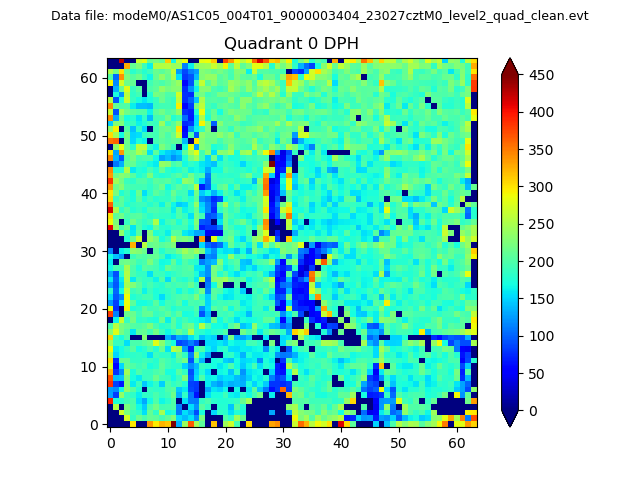 |
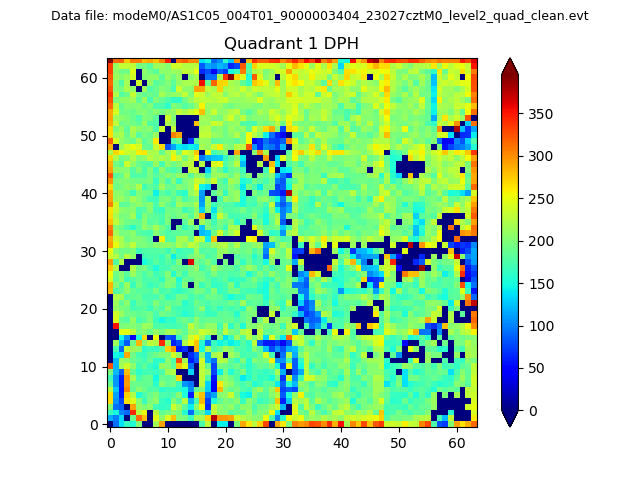 |
Quadrant B |
|---|---|---|---|
| Quadrant D | 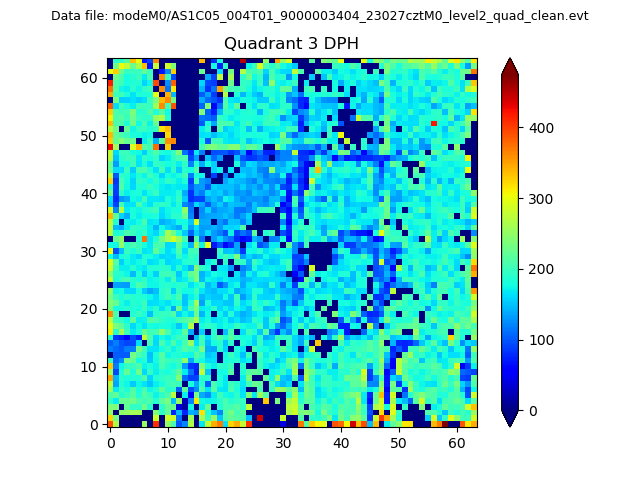 |
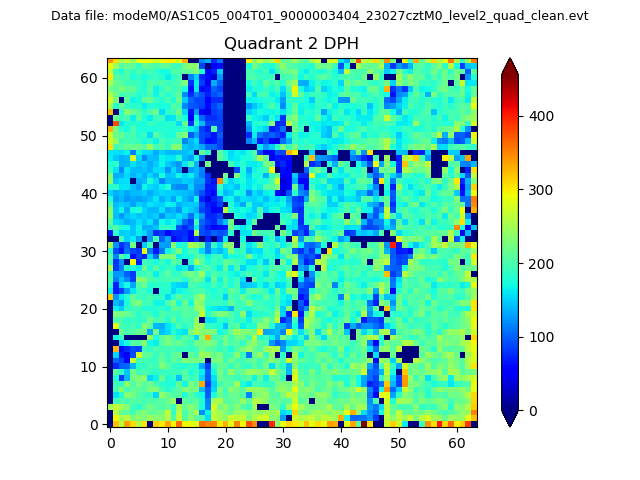 |
Quadrant C |
| Plot type | Count rate plots | Images |
|---|---|---|
| Comparison with Poisson distribution Blue bars denote a histogram of data divided into 1 sec bins. Red curve is a Poisson curve with rate = median count rate of data. |
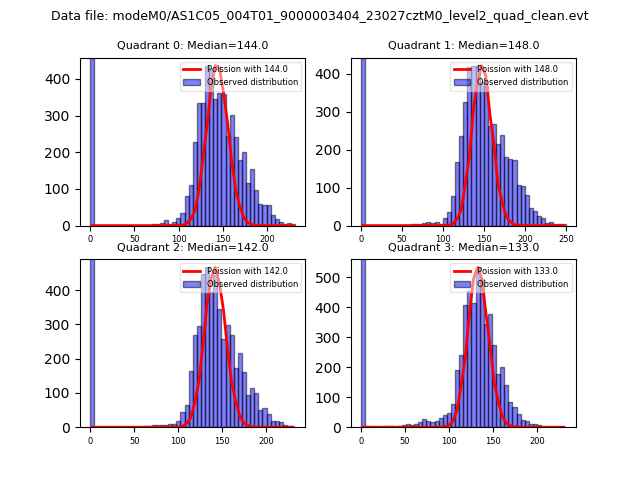 |
 |
| Quadrant-wise count rates Data is divided into 100 sec bins |
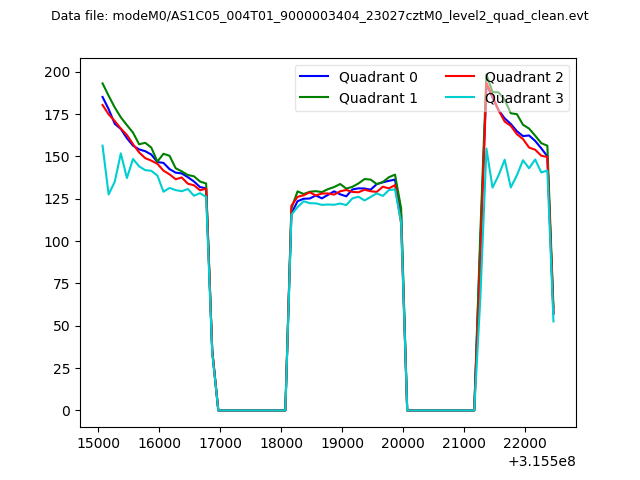 |
|
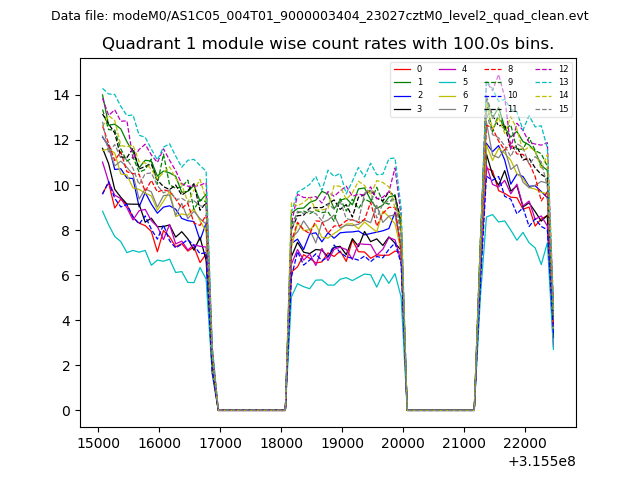
| Module-wise count rates for Quadrant A Data is divided into 100 sec bins |
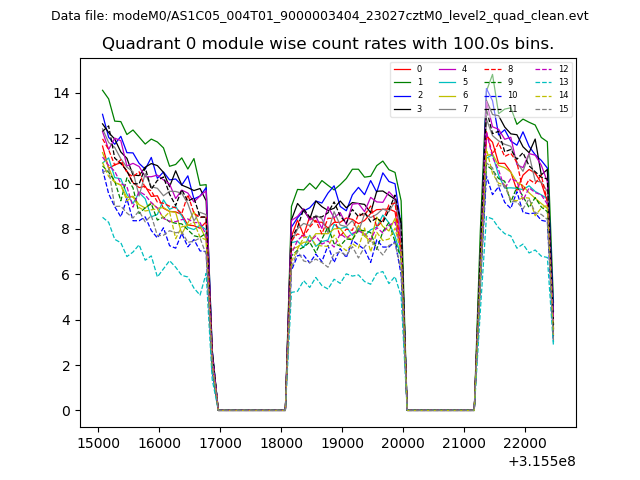 |
 |
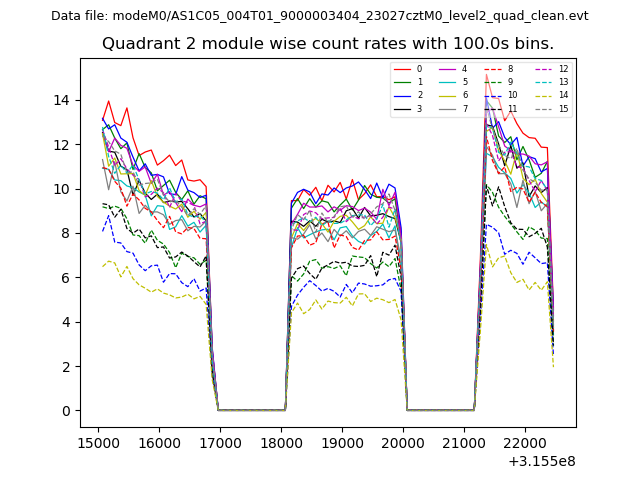
| Module-wise count rates for Quadrant B Data is divided into 100 sec bins |
 |
 |
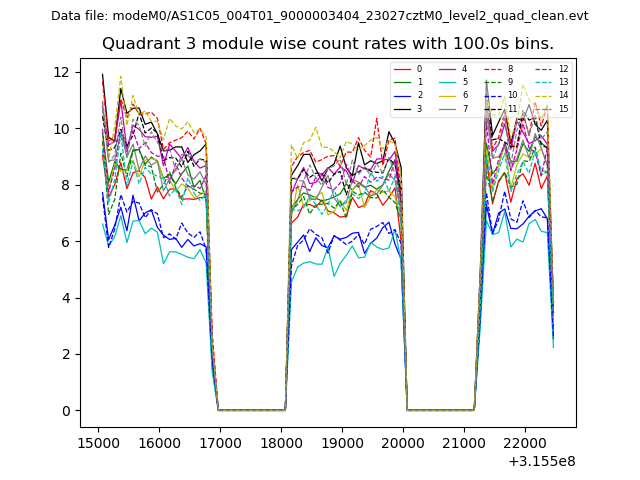
| Module-wise count rates for Quadrant C Data is divided into 100 sec bins |
 |
 |
| Module-wise count rates for Quadrant D Data is divided into 100 sec bins |
 |
 |
| Parameter | Plot |
|---|---|
| CZT HV Monitor | 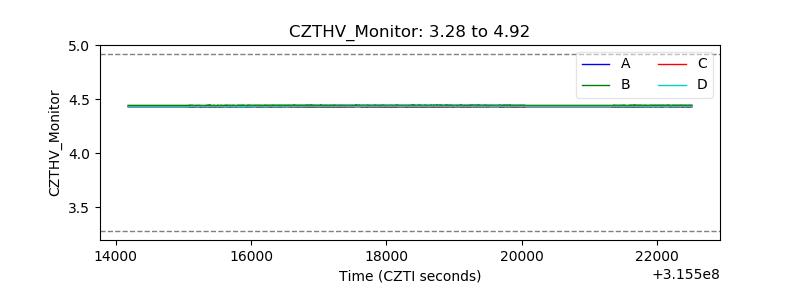 |
| D_VDD | 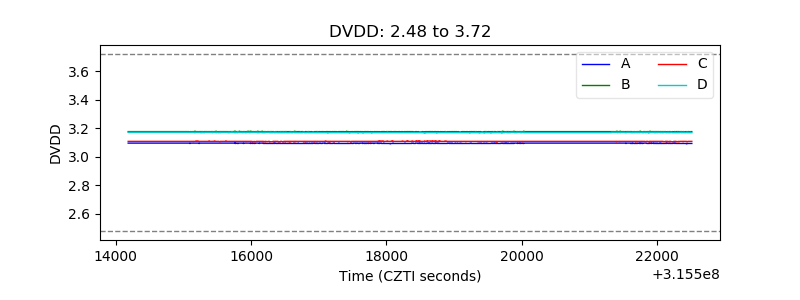 |
| Temperature 1 | 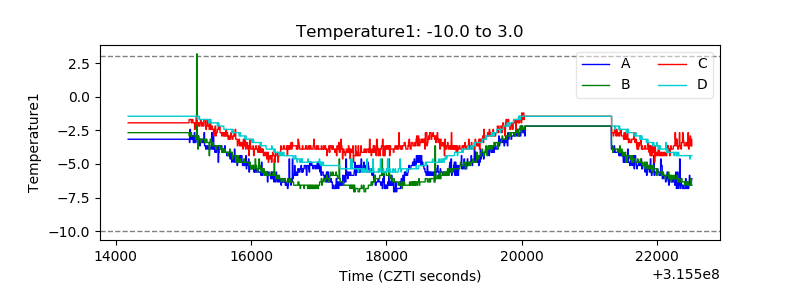 |
| Veto HV Monitor | 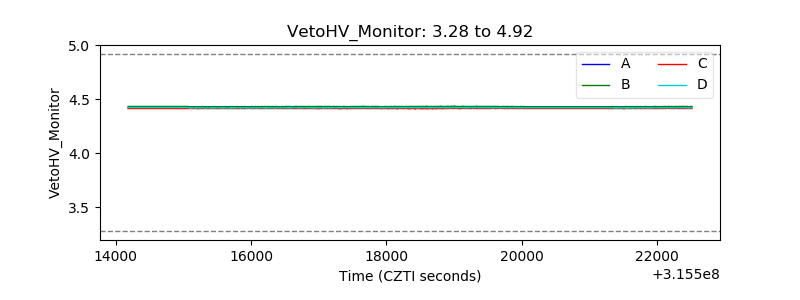 |
| Veto LLD | 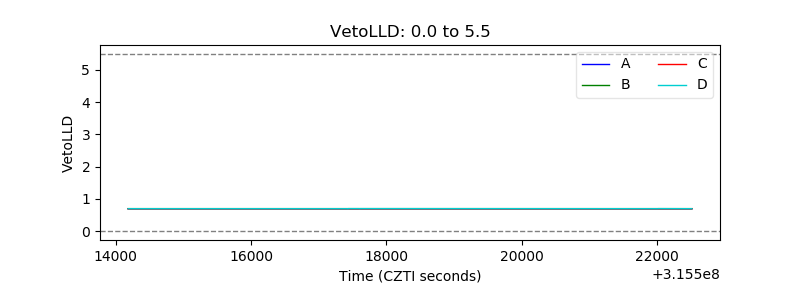 |
| Alpha Counter | 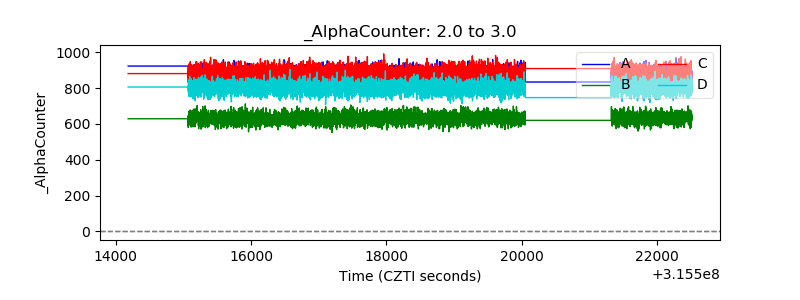 |
| _CPM_Rate | 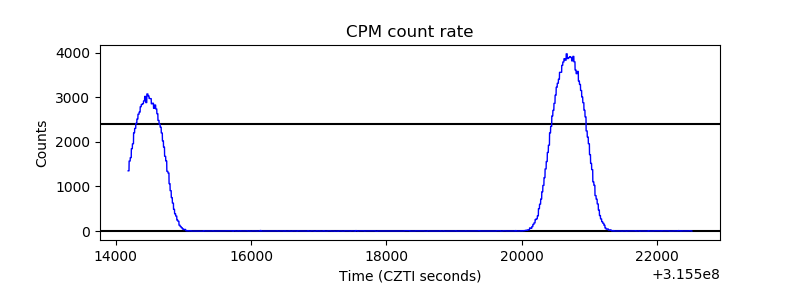 |
| CZT Counter | 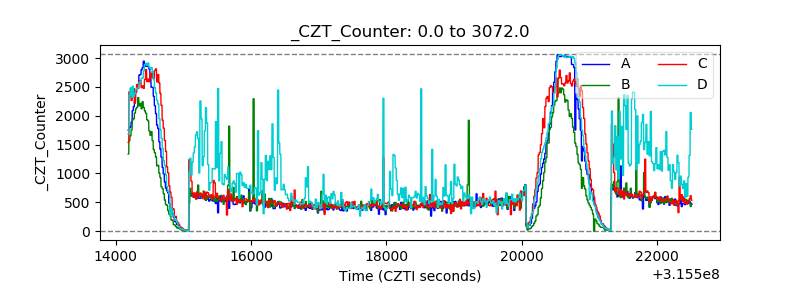 |
| +2.5 Volts monitor | 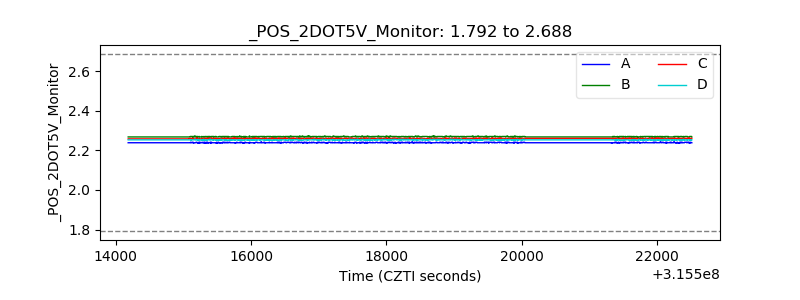 |
| +5 Volts monitor | 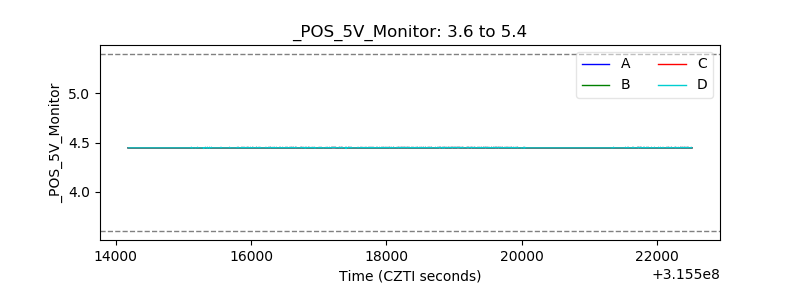 |
| _ROLL_ROT | 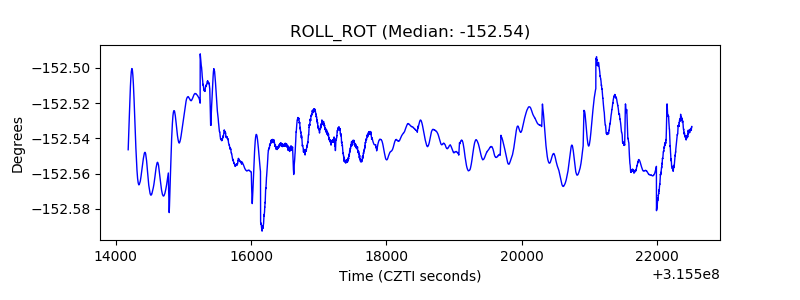 |
| _Roll_DEC | 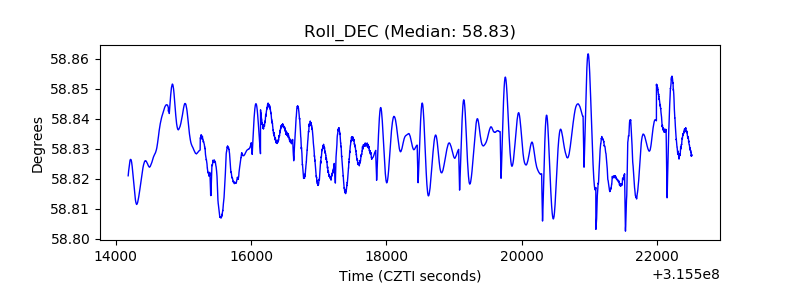 |
| _Roll_RA | 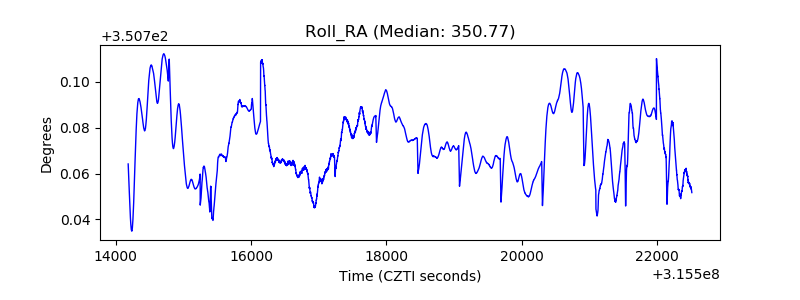 |
| Veto Counter | 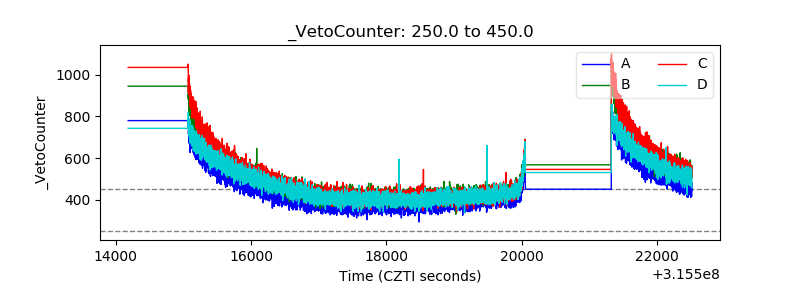 |