| Param | Original file | Final file |
|---|---|---|
| Filename | modeM0/AS1C05_004T01_9000003404_23028cztM0_level2.evt | modeM0/AS1C05_004T01_9000003404_23028cztM0_level2_quad_clean.evt |
| Size (bytes) | 564,534,720 | 105,788,160 |
| Size | 538.4 MB | 100.9 MB |
| Events in quadrant A | 3,038,562 | 705,114 |
| Events in quadrant B | 3,250,646 | 735,385 |
| Events in quadrant C | 3,420,601 | 700,605 |
| Events in quadrant D | 6,971,685 | 633,774 |
| Mode M0 | |||
|---|---|---|---|
| Quadrant | BADHDUFLAG | Total packets | Discarded packets |
| A | 0 | 12962 | 2 |
| B | 0 | 13591 | 2 |
| C | 0 | 14118 | 2 |
| D | 0 | 25041 | 5 |
| Mode SS | |||
|---|---|---|---|
| Quadrant | BADHDUFLAG | Total packets | Discarded packets |
| A | 0 | 126 | 0 |
| B | 0 | 126 | 0 |
| C | 0 | 126 | 0 |
| D | 0 | 126 | 0 |
| Mode M9 | |||
|---|---|---|---|
| Quadrant | BADHDUFLAG | Total packets | Discarded packets |
| A | 0 | 23 | 0 |
| B | 0 | 24 | 0 |
| C | 0 | 24 | 0 |
| D | 0 | 24 | 0 |
| Quadrant | Total seconds | Saturated seconds | Saturation percentage |
|---|---|---|---|
| A | 6139 | 21 | 0.342075% |
| B | 6139 | 62 | 1.009936% |
| C | 6139 | 116 | 1.889559% |
| D | 6138 | 556 | 9.058325% |
Noise dominated data is calculated using 1-second bins in cleaned event files. If a bin has >2000 counts, and if more than 50% of those come from <1% of pixels, then it is considered to be noise-dominated and hence unusable.
| Quadrant | # 1 sec bins | Bins with >0 counts | Bins with >2000 counts | High rate bins dominated by noise | Noise dominated (total time) | Noise dominated (detector-on time) | Marked lightcurve |
|---|---|---|---|---|---|---|---|
| A | 7484 | 6140 | 0 | 0 | 0.00% | 0.00% | 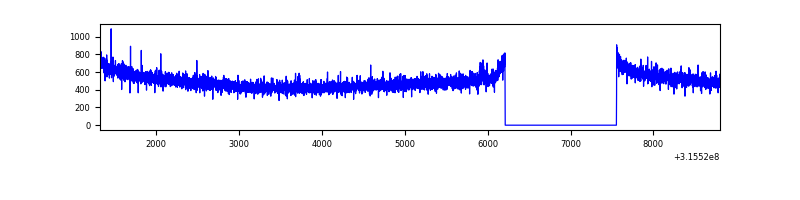 |
| B | 7484 | 6140 | 22 | 22 | 0.29% | 0.36% | 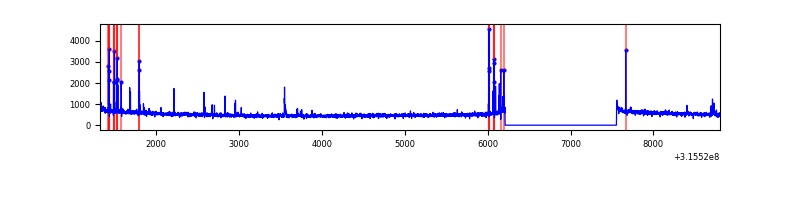 |
| C | 7484 | 6140 | 20 | 20 | 0.27% | 0.33% | 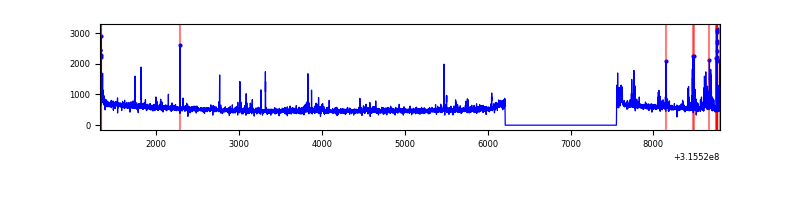 |
| D | 7483 | 6139 | 373 | 373 | 4.98% | 6.08% | 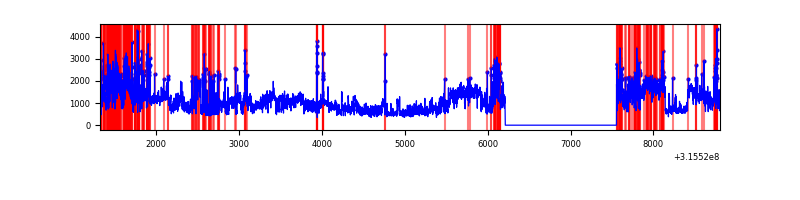 |
Top three noisy pixels from each quadrant. If the there are fewer than three noisy pixels in the level2.evt file, extra rows are filled as -1
| Pixel properties | Quadrant properties | ||||||
|---|---|---|---|---|---|---|---|
| Quadrant | DetID | PixID | Counts | Sigma | Mean | Median | Sigma |
| A | 13 | 254 | 8767 | 51.0 | 786 | 772 | 156.8 |
| A | 0 | 226 | 6807 | 38.5 | 786 | 772 | 156.8 |
| A | 3 | 137 | 6607 | 37.22 | 786 | 772 | 156.8 |
| B | 4 | 216 | 102291 | 694.48 | 792 | 776 | 146.2 |
| B | 0 | 189 | 23690 | 156.76 | 792 | 776 | 146.2 |
| B | 12 | 111 | 16895 | 110.27 | 792 | 776 | 146.2 |
| C | 0 | 207 | 225387 | 1264.86 | 773 | 780 | 177.6 |
| C | 14 | 238 | 125961 | 704.95 | 773 | 780 | 177.6 |
| C | 0 | 10 | 39843 | 219.98 | 773 | 780 | 177.6 |
| D | 1 | 52 | 2805370 | 15738.96 | 747 | 727 | 178.2 |
| D | 9 | 85 | 646716 | 3625.13 | 747 | 727 | 178.2 |
| D | 12 | 227 | 256873 | 1437.43 | 747 | 727 | 178.2 |
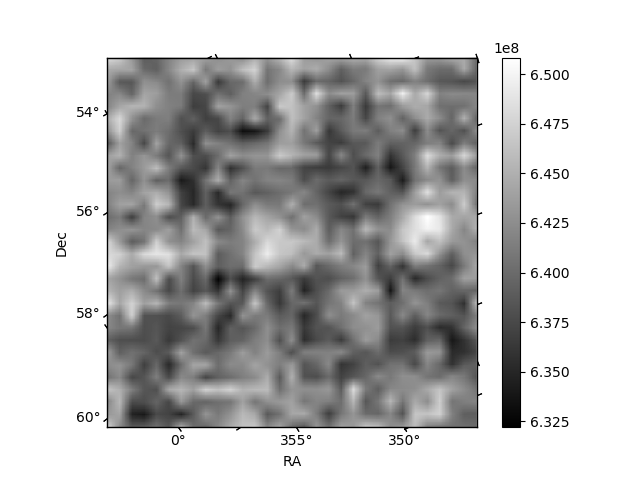
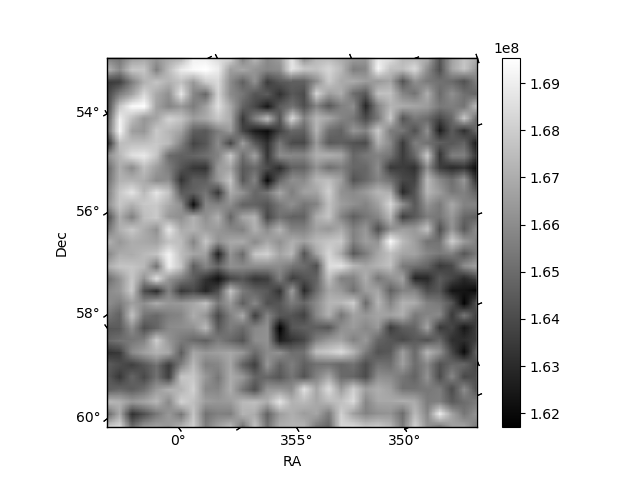
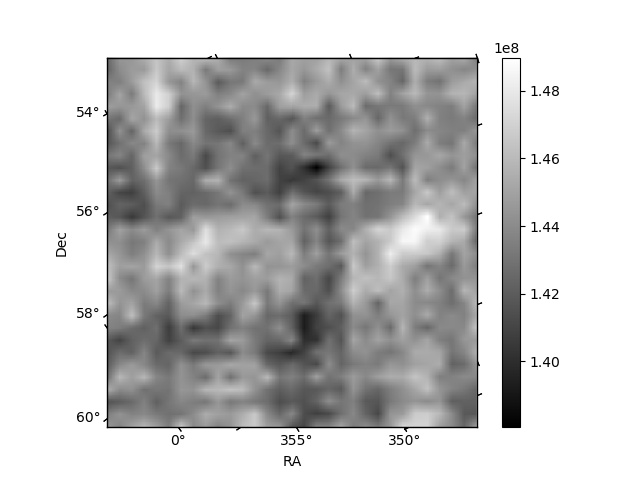
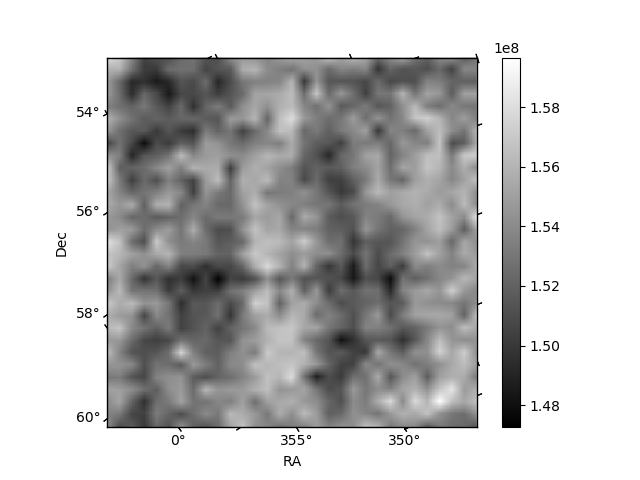
Histogram calculated using DETX and DETY for each event in the final _common_clean file
| Quadrant A | 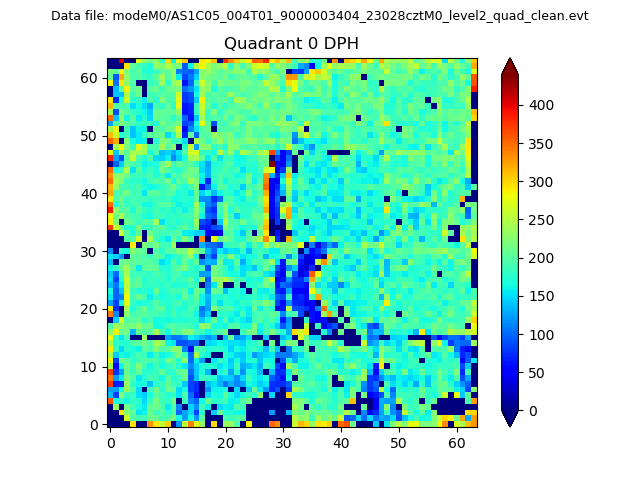 |
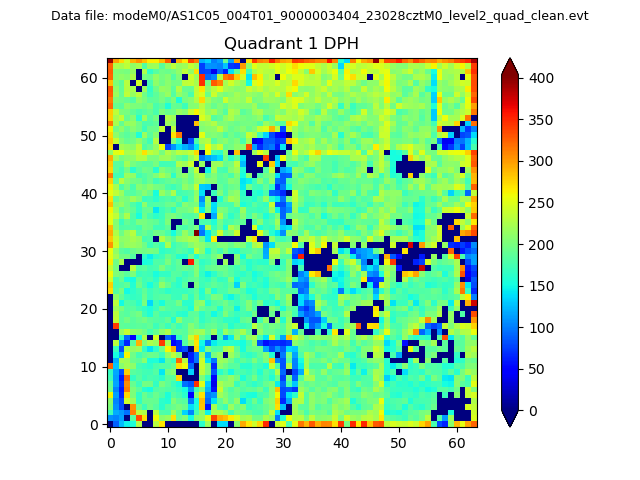 |
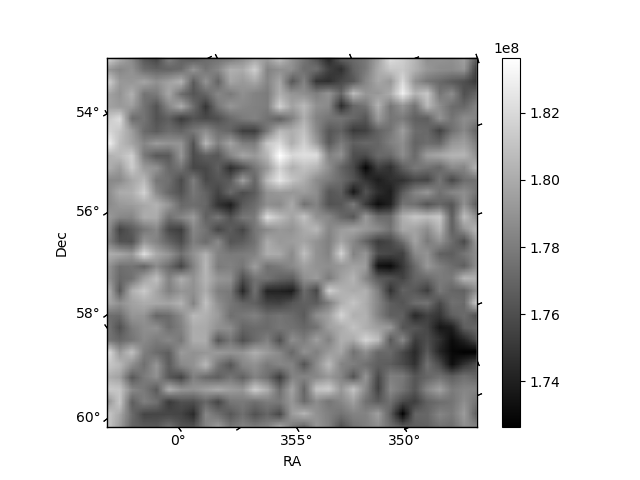
Quadrant B |
|---|---|---|---|
| Quadrant D | 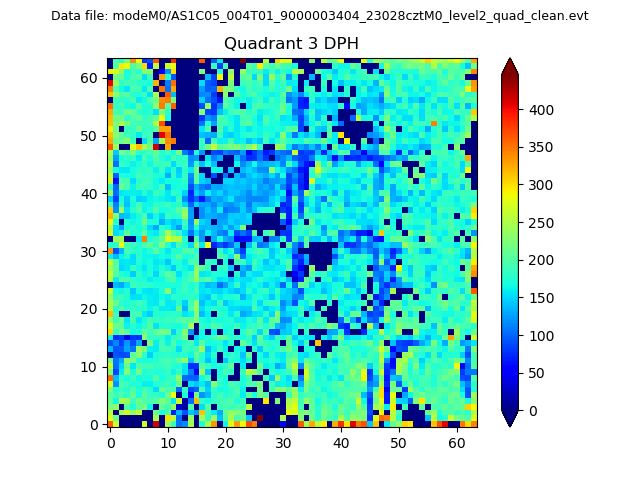 |
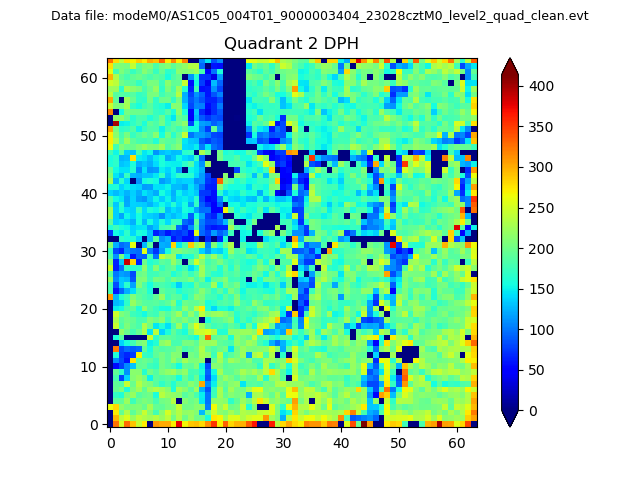 |
Quadrant C |
| Plot type | Count rate plots | Images |
|---|---|---|
| Comparison with Poisson distribution Blue bars denote a histogram of data divided into 1 sec bins. Red curve is a Poisson curve with rate = median count rate of data. |
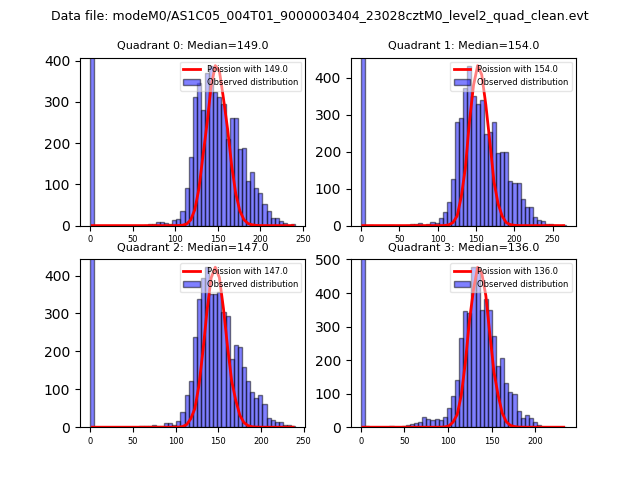 |
 |
| Quadrant-wise count rates Data is divided into 100 sec bins |
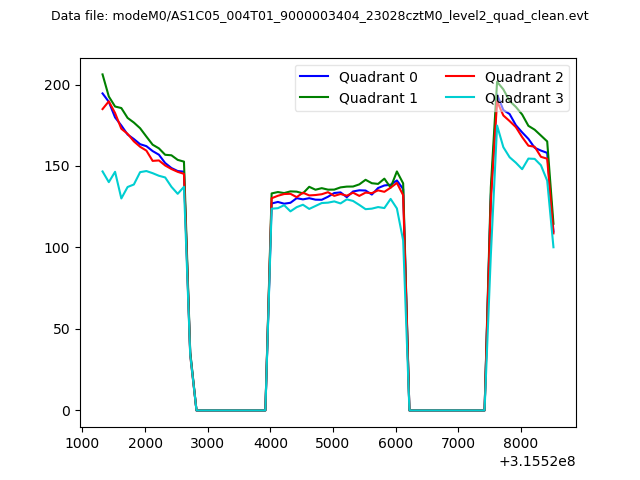 |
|
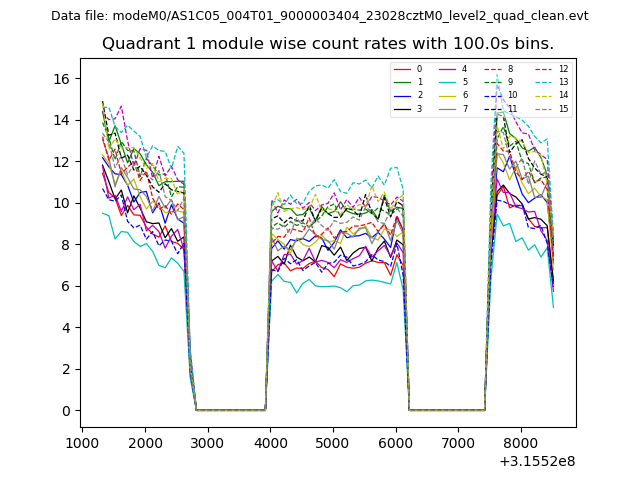
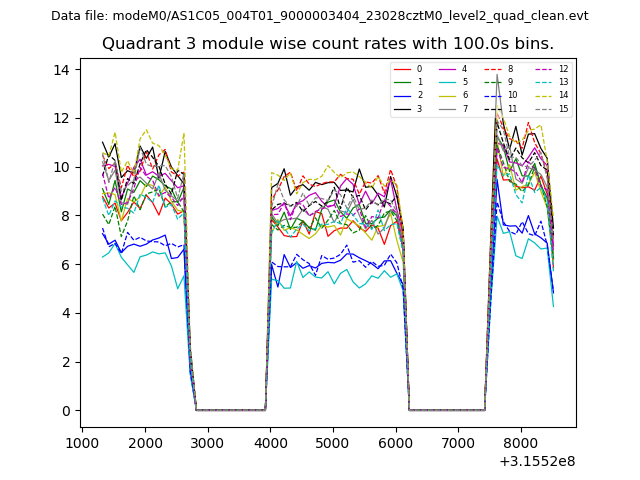
| Module-wise count rates for Quadrant A Data is divided into 100 sec bins |
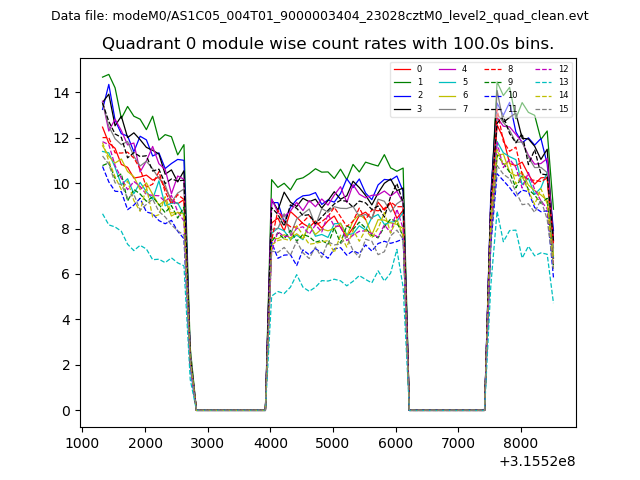 |
 |
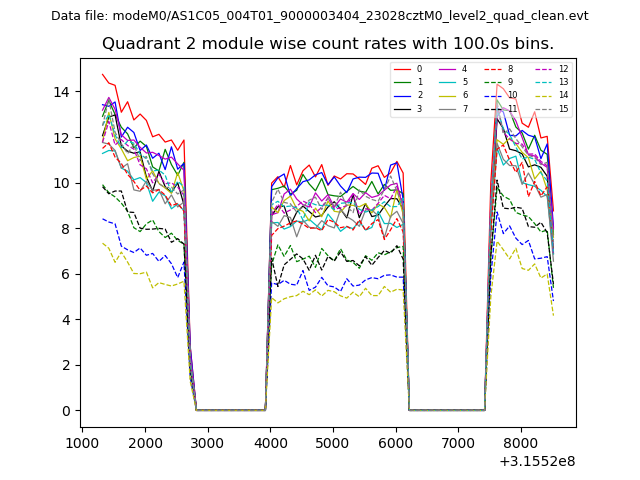
| Module-wise count rates for Quadrant B Data is divided into 100 sec bins |
 |
 |
| Module-wise count rates for Quadrant C Data is divided into 100 sec bins |
 |
 |
| Module-wise count rates for Quadrant D Data is divided into 100 sec bins |
 |
 |
| Parameter | Plot |
|---|---|
| CZT HV Monitor |  |
| D_VDD | 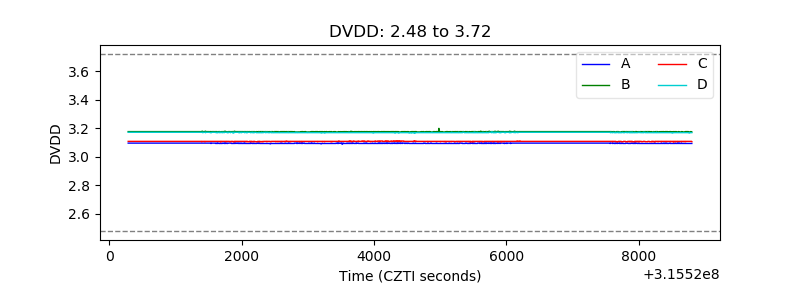 |
| Temperature 1 | 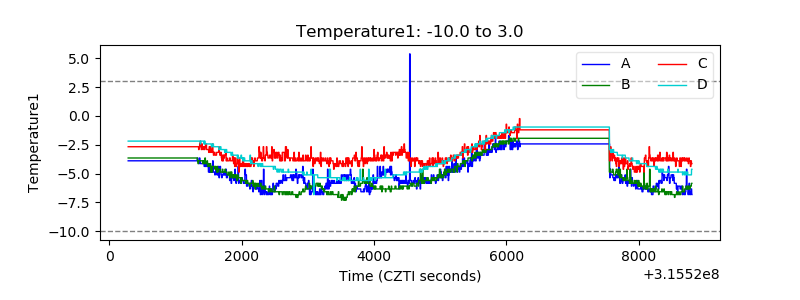 |
| Veto HV Monitor | 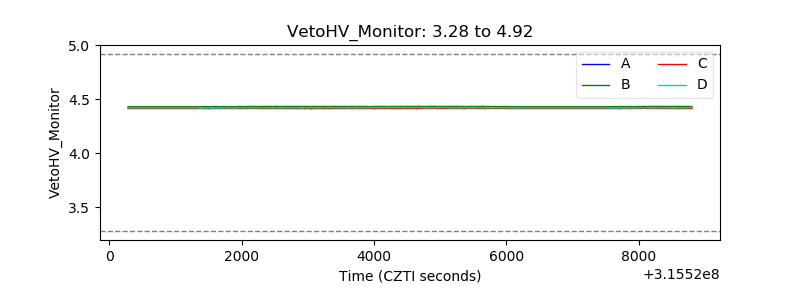 |
| Veto LLD | 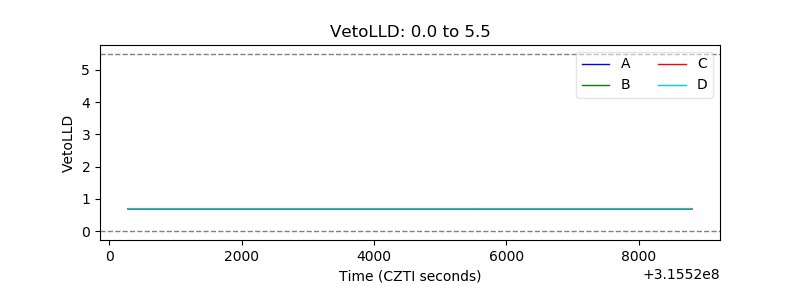 |
| Alpha Counter | 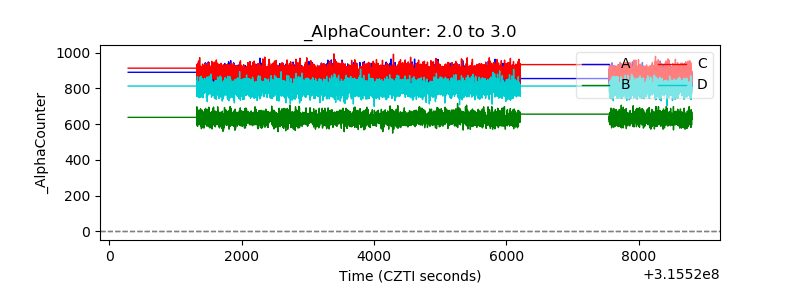 |
| _CPM_Rate | 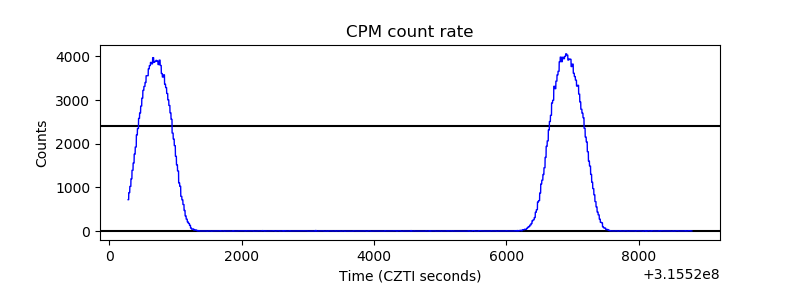 |
| CZT Counter | 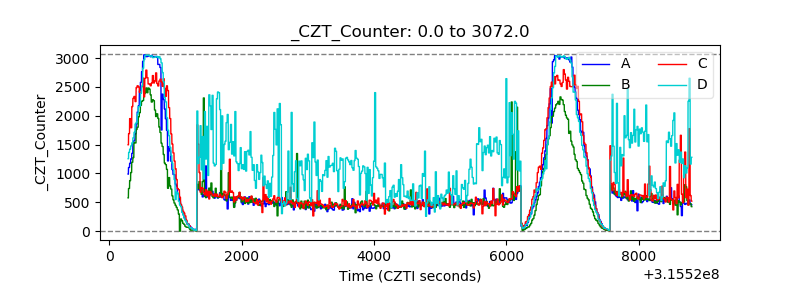 |
| +2.5 Volts monitor | 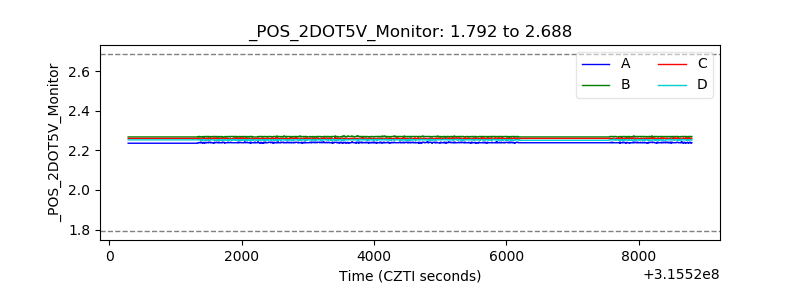 |
| +5 Volts monitor |  |
| _ROLL_ROT | 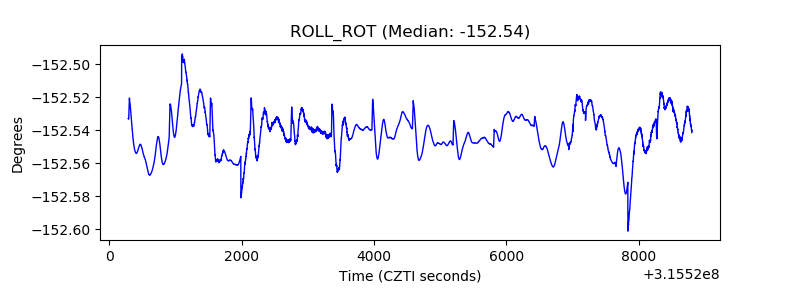 |
| _Roll_DEC | 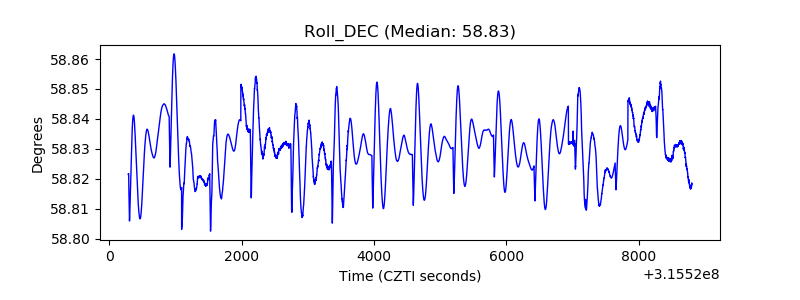 |
| _Roll_RA | 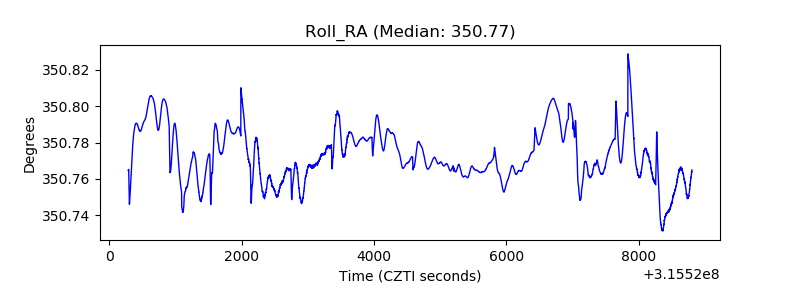 |
| Veto Counter | 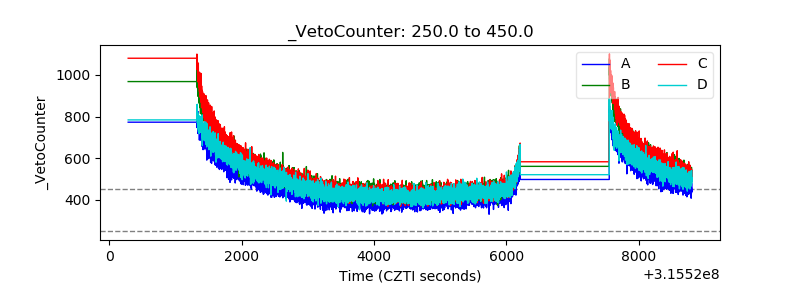 |