| Param | Original file | Final file |
|---|---|---|
| Filename | modeM0/AS1C05_004T01_9000003404_23029cztM0_level2.evt | modeM0/AS1C05_004T01_9000003404_23029cztM0_level2_quad_clean.evt |
| Size (bytes) | 631,523,520 | 97,493,760 |
| Size | 602.3 MB | 93.0 MB |
| Events in quadrant A | 3,201,761 | 639,171 |
| Events in quadrant B | 3,426,751 | 662,114 |
| Events in quadrant C | 3,703,135 | 628,291 |
| Events in quadrant D | 8,356,757 | 571,165 |
| Mode M0 | |||
|---|---|---|---|
| Quadrant | BADHDUFLAG | Total packets | Discarded packets |
| A | 0 | 13576 | 2 |
| B | 0 | 14226 | 2 |
| C | 0 | 15264 | 2 |
| D | 0 | 29408 | 2 |
| Mode SS | |||
|---|---|---|---|
| Quadrant | BADHDUFLAG | Total packets | Discarded packets |
| A | 0 | 132 | 0 |
| B | 0 | 132 | 0 |
| C | 0 | 132 | 0 |
| D | 0 | 132 | 0 |
| Mode M9 | |||
|---|---|---|---|
| Quadrant | BADHDUFLAG | Total packets | Discarded packets |
| A | 0 | 17 | 0 |
| B | 0 | 18 | 0 |
| C | 0 | 18 | 0 |
| D | 0 | 18 | 0 |
| Quadrant | Total seconds | Saturated seconds | Saturation percentage |
|---|---|---|---|
| A | 6474 | 35 | 0.540624% |
| B | 6474 | 82 | 1.266605% |
| C | 6474 | 138 | 2.131603% |
| D | 6473 | 588 | 9.083887% |
Noise dominated data is calculated using 1-second bins in cleaned event files. If a bin has >2000 counts, and if more than 50% of those come from <1% of pixels, then it is considered to be noise-dominated and hence unusable.
| Quadrant | # 1 sec bins | Bins with >0 counts | Bins with >2000 counts | High rate bins dominated by noise | Noise dominated (total time) | Noise dominated (detector-on time) | Marked lightcurve |
|---|---|---|---|---|---|---|---|
| A | 7849 | 6475 | 0 | 0 | 0.00% | 0.00% | 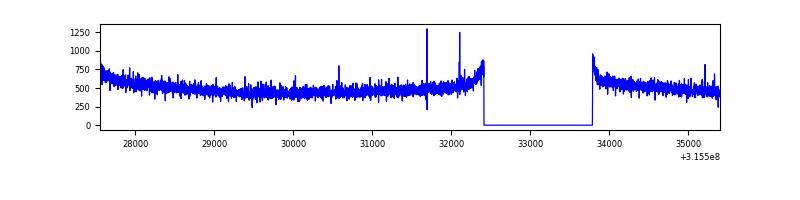 |
| B | 7849 | 6475 | 28 | 28 | 0.36% | 0.43% | 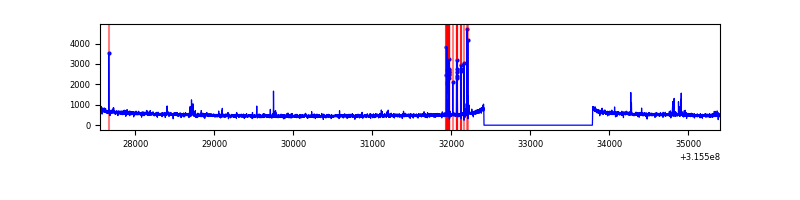 |
| C | 7849 | 6475 | 26 | 26 | 0.33% | 0.40% | 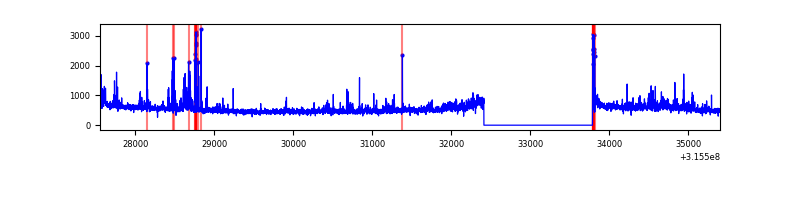 |
| D | 7848 | 6474 | 402 | 402 | 5.12% | 6.21% | 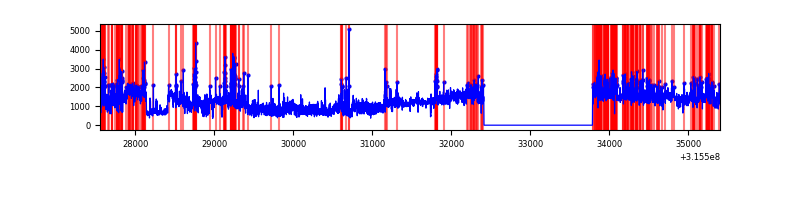 |
Top three noisy pixels from each quadrant. If the there are fewer than three noisy pixels in the level2.evt file, extra rows are filled as -1
| Pixel properties | Quadrant properties | ||||||
|---|---|---|---|---|---|---|---|
| Quadrant | DetID | PixID | Counts | Sigma | Mean | Median | Sigma |
| A | 13 | 254 | 9281 | 51.4 | 830 | 817 | 164.7 |
| A | 0 | 226 | 7122 | 38.29 | 830 | 817 | 164.7 |
| A | 3 | 137 | 6773 | 36.17 | 830 | 817 | 164.7 |
| B | 4 | 216 | 97582 | 632.7 | 836 | 816 | 152.9 |
| B | 0 | 189 | 40542 | 259.75 | 836 | 816 | 152.9 |
| B | 12 | 111 | 17957 | 112.08 | 836 | 816 | 152.9 |
| C | 0 | 207 | 354439 | 1908.25 | 807 | 815 | 185.3 |
| C | 14 | 238 | 132105 | 708.48 | 807 | 815 | 185.3 |
| C | 0 | 10 | 54760 | 291.1 | 807 | 815 | 185.3 |
| D | 1 | 52 | 4226600 | 22401.13 | 788 | 766 | 188.6 |
| D | 13 | 153 | 360650 | 1907.74 | 788 | 766 | 188.6 |
| D | 13 | 174 | 310945 | 1644.26 | 788 | 766 | 188.6 |
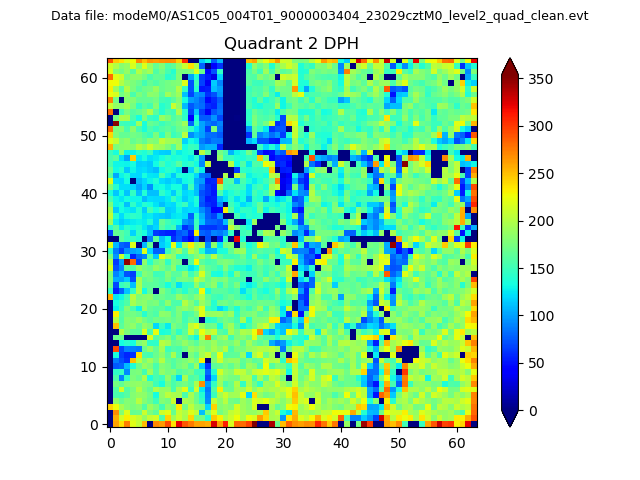
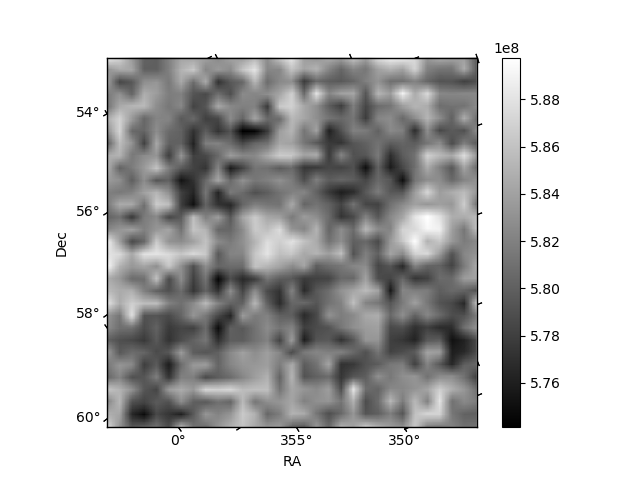
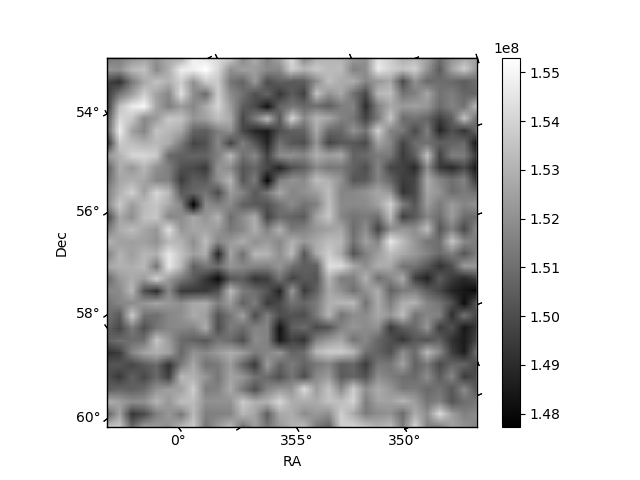
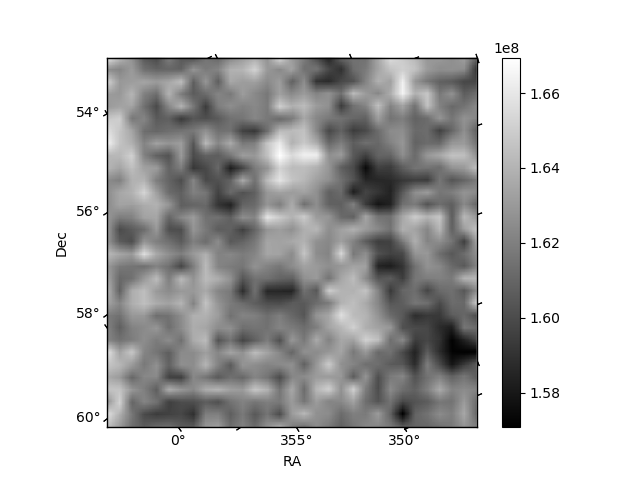
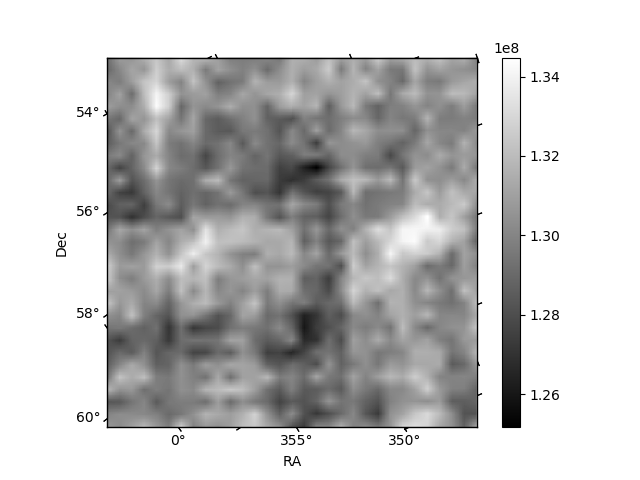
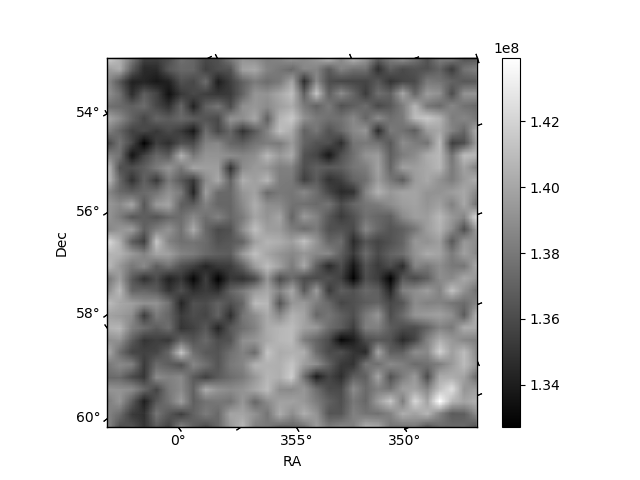
Histogram calculated using DETX and DETY for each event in the final _common_clean file
| Quadrant A | 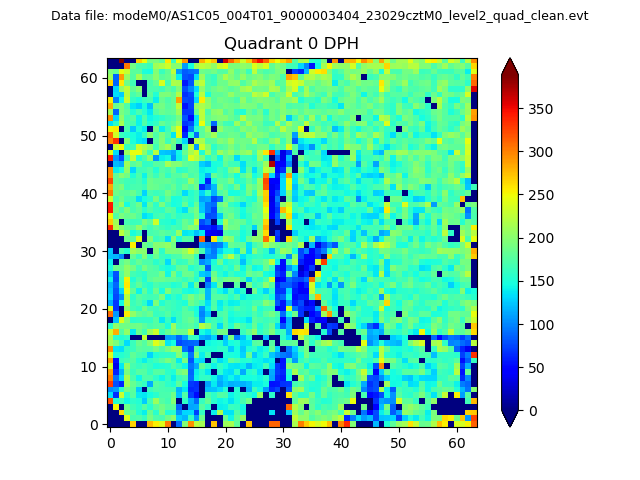 |
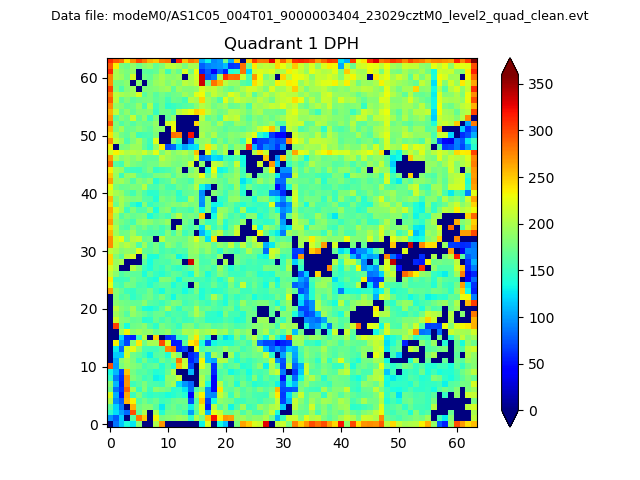 |
Quadrant B |
|---|---|---|---|
| Quadrant D | 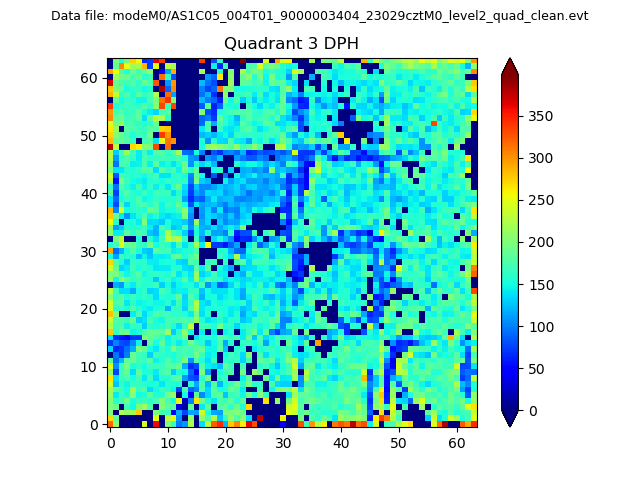 |
 |
Quadrant C |
| Plot type | Count rate plots | Images |
|---|---|---|
| Comparison with Poisson distribution Blue bars denote a histogram of data divided into 1 sec bins. Red curve is a Poisson curve with rate = median count rate of data. |
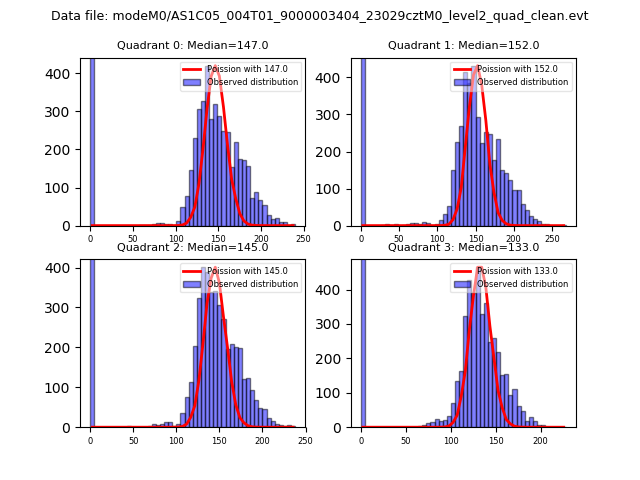 |
 |
| Quadrant-wise count rates Data is divided into 100 sec bins |
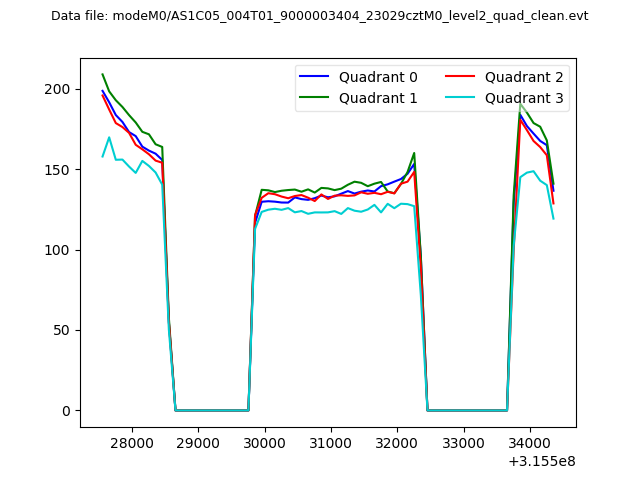 |
|
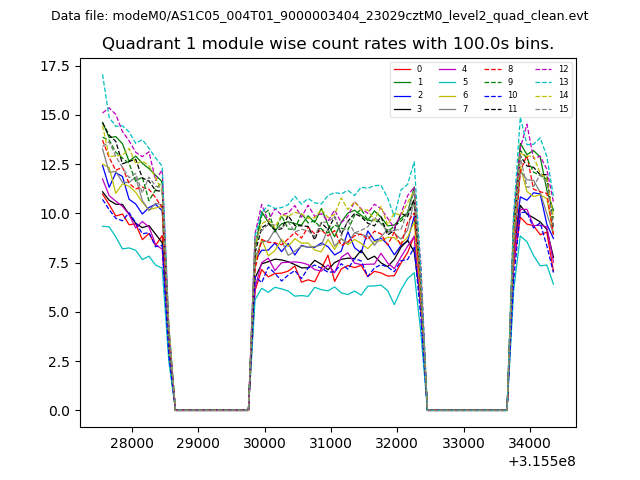
| Module-wise count rates for Quadrant A Data is divided into 100 sec bins |
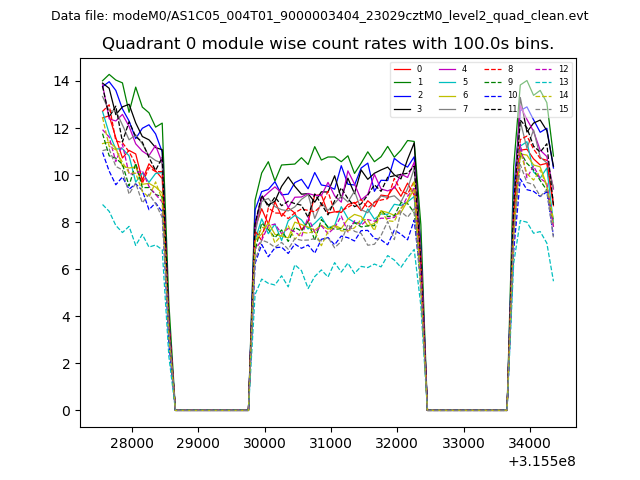 |
 |
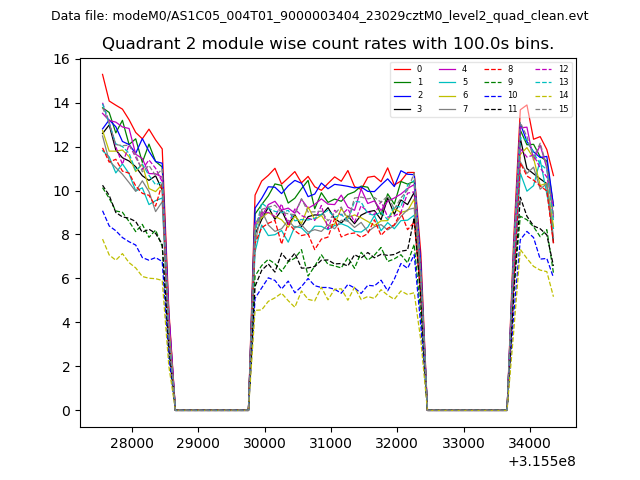
| Module-wise count rates for Quadrant B Data is divided into 100 sec bins |
 |
 |
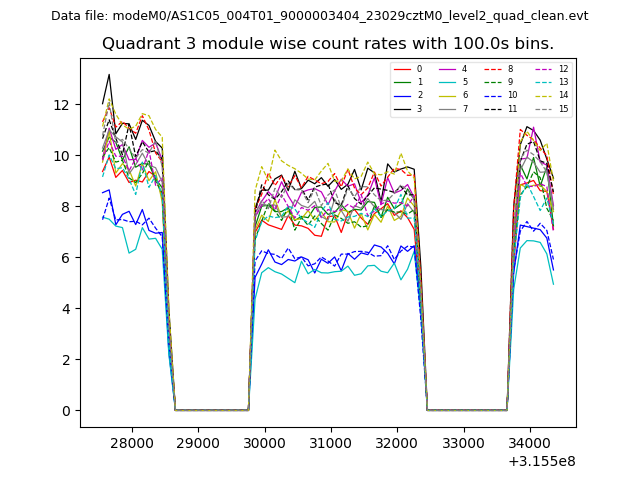
| Module-wise count rates for Quadrant C Data is divided into 100 sec bins |
 |
 |
| Module-wise count rates for Quadrant D Data is divided into 100 sec bins |
 |
 |
| Parameter | Plot |
|---|---|
| CZT HV Monitor | 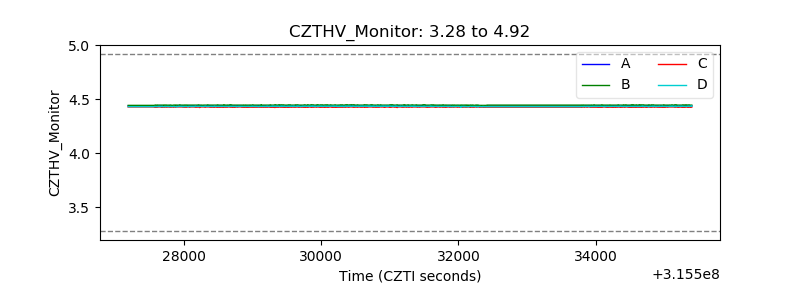 |
| D_VDD | 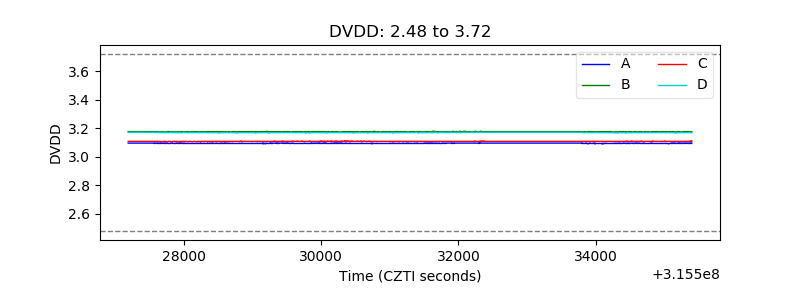 |
| Temperature 1 | 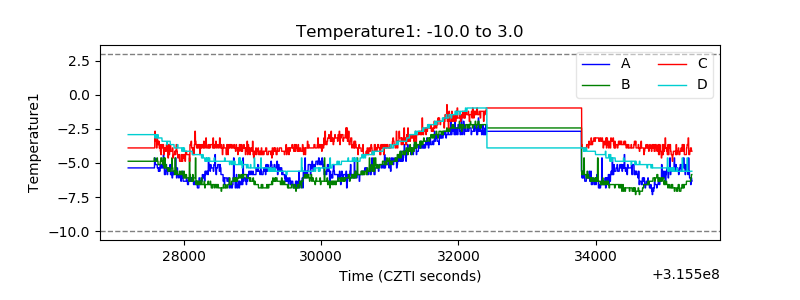 |
| Veto HV Monitor | 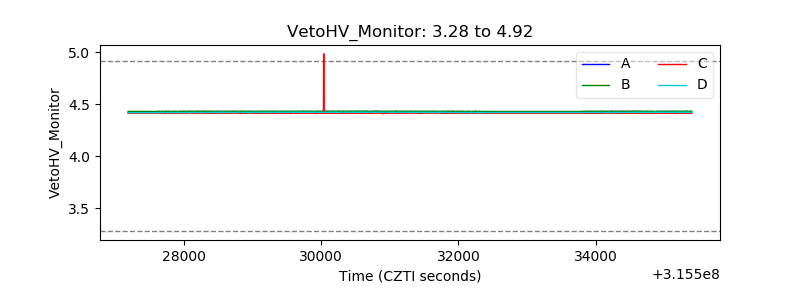 |
| Veto LLD | 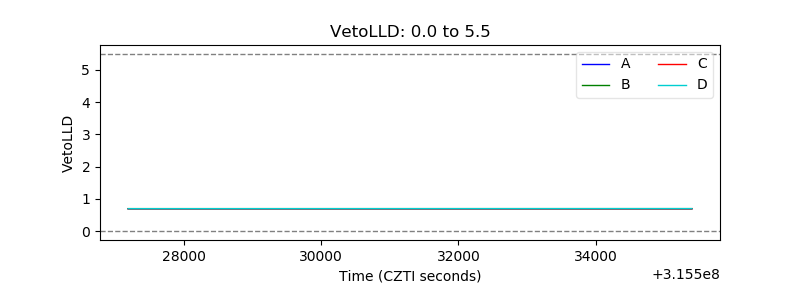 |
| Alpha Counter | 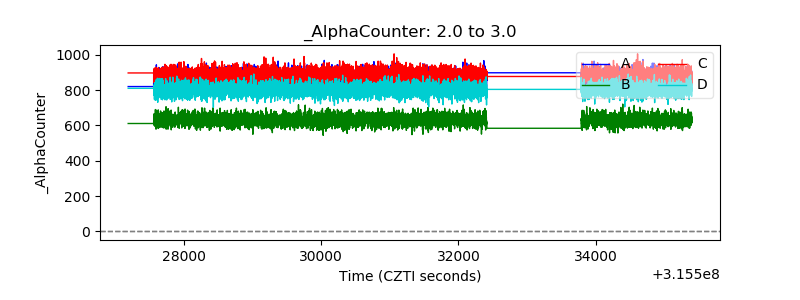 |
| _CPM_Rate | 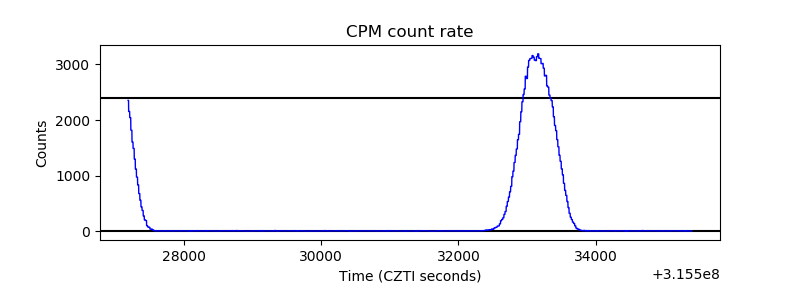 |
| CZT Counter | 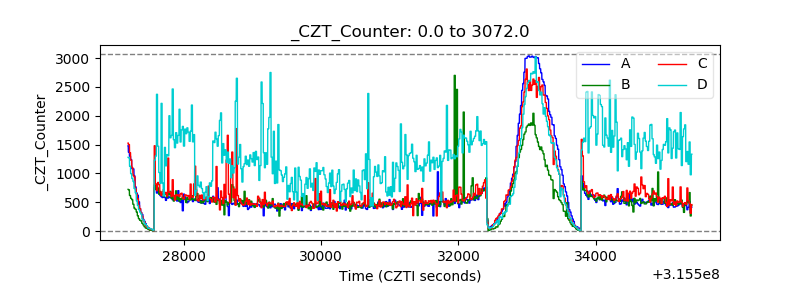 |
| +2.5 Volts monitor |  |
| +5 Volts monitor | 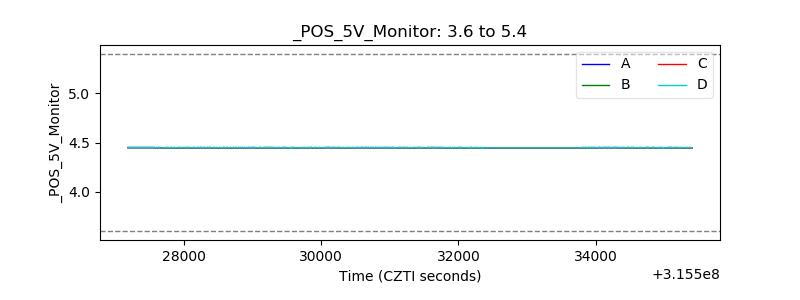 |
| _ROLL_ROT | 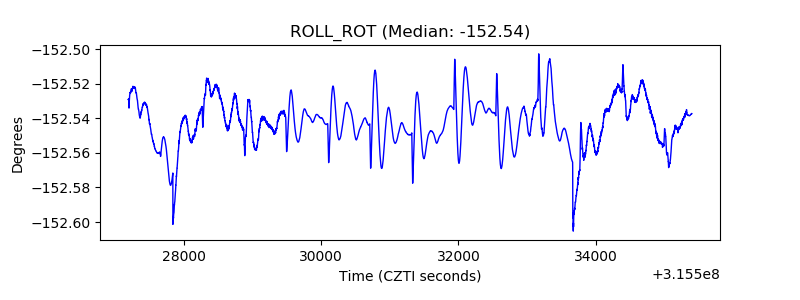 |
| _Roll_DEC | 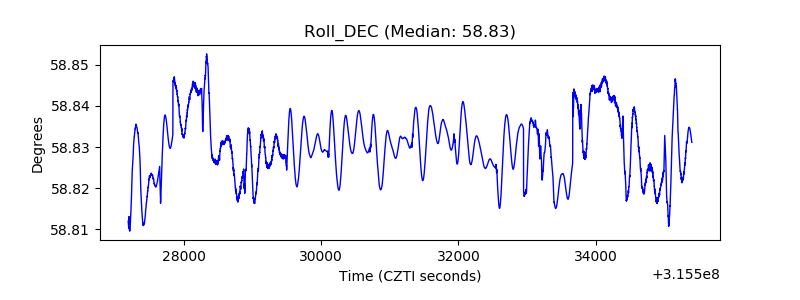 |
| _Roll_RA | 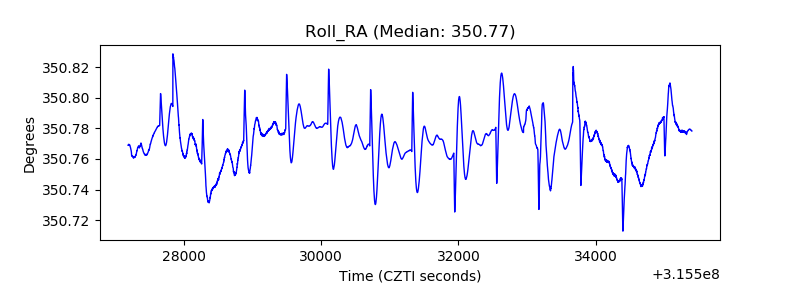 |
| Veto Counter | 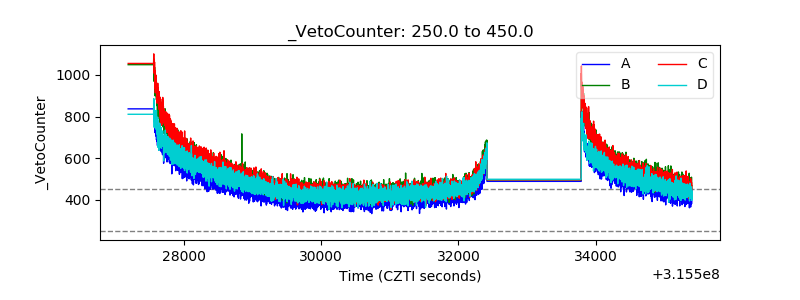 |