| Param | Original file | Final file |
|---|---|---|
| Filename | modeM0/AS1C05_004T01_9000003404_23030cztM0_level2.evt | modeM0/AS1C05_004T01_9000003404_23030cztM0_level2_quad_clean.evt |
| Size (bytes) | 561,726,720 | 79,704,000 |
| Size | 535.7 MB | 76.0 MB |
| Events in quadrant A | 2,948,921 | 508,387 |
| Events in quadrant B | 3,200,984 | 521,774 |
| Events in quadrant C | 3,240,486 | 494,151 |
| Events in quadrant D | 7,207,026 | 461,146 |
| Mode M0 | |||
|---|---|---|---|
| Quadrant | BADHDUFLAG | Total packets | Discarded packets |
| A | 0 | 12578 | 1 |
| B | 0 | 13277 | 1 |
| C | 0 | 13445 | 1 |
| D | 0 | 25626 | 1 |
| Mode SS | |||
|---|---|---|---|
| Quadrant | BADHDUFLAG | Total packets | Discarded packets |
| A | 0 | 124 | 0 |
| B | 0 | 124 | 0 |
| C | 0 | 124 | 0 |
| D | 0 | 124 | 0 |
| Mode M9 | |||
|---|---|---|---|
| Quadrant | BADHDUFLAG | Total packets | Discarded packets |
| A | 0 | 14 | 0 |
| B | 0 | 14 | 0 |
| C | 0 | 14 | 0 |
| D | 0 | 14 | 0 |
| Quadrant | Total seconds | Saturated seconds | Saturation percentage |
|---|---|---|---|
| A | 6130 | 14 | 0.228385% |
| B | 6130 | 62 | 1.011419% |
| C | 6131 | 78 | 1.272223% |
| D | 6131 | 478 | 7.796444% |
Noise dominated data is calculated using 1-second bins in cleaned event files. If a bin has >2000 counts, and if more than 50% of those come from <1% of pixels, then it is considered to be noise-dominated and hence unusable.
| Quadrant | # 1 sec bins | Bins with >0 counts | Bins with >2000 counts | High rate bins dominated by noise | Noise dominated (total time) | Noise dominated (detector-on time) | Marked lightcurve |
|---|---|---|---|---|---|---|---|
| A | 7505 | 6131 | 0 | 0 | 0.00% | 0.00% | 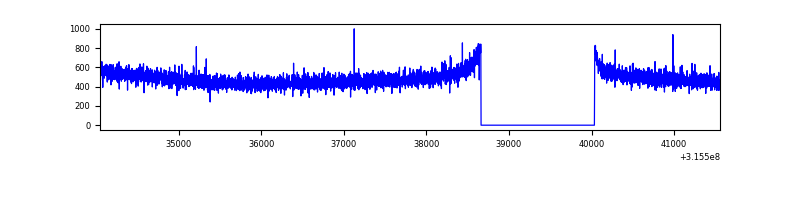 |
| B | 7505 | 6131 | 26 | 26 | 0.35% | 0.42% | 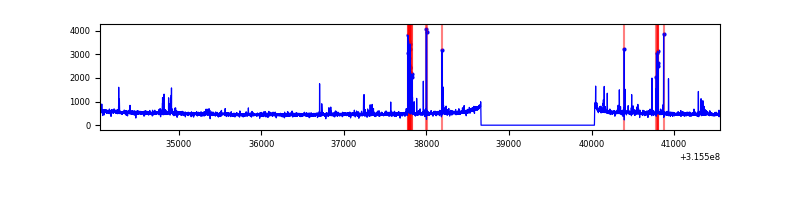 |
| C | 7506 | 6132 | 5 | 5 | 0.07% | 0.08% | 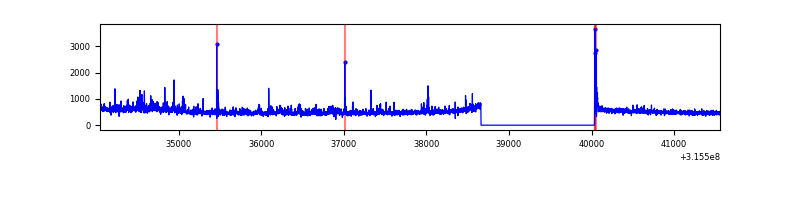 |
| D | 7506 | 6132 | 342 | 342 | 4.56% | 5.58% |  |
Top three noisy pixels from each quadrant. If the there are fewer than three noisy pixels in the level2.evt file, extra rows are filled as -1
| Pixel properties | Quadrant properties | ||||||
|---|---|---|---|---|---|---|---|
| Quadrant | DetID | PixID | Counts | Sigma | Mean | Median | Sigma |
| A | 13 | 254 | 9086 | 55.23 | 763 | 749 | 150.9 |
| A | 0 | 226 | 6611 | 38.84 | 763 | 749 | 150.9 |
| A | 3 | 137 | 6310 | 36.84 | 763 | 749 | 150.9 |
| B | 0 | 189 | 82686 | 582.4 | 763 | 746 | 140.7 |
| B | 4 | 216 | 81416 | 573.37 | 763 | 746 | 140.7 |
| B | 3 | 64 | 25546 | 176.27 | 763 | 746 | 140.7 |
| C | 0 | 207 | 215372 | 1271.93 | 736 | 742 | 168.7 |
| C | 14 | 238 | 121927 | 718.16 | 736 | 742 | 168.7 |
| C | 0 | 10 | 28577 | 164.95 | 736 | 742 | 168.7 |
| D | 1 | 52 | 3489958 | 20006.5 | 723 | 702 | 174.4 |
| D | 5 | 222 | 386817 | 2213.88 | 723 | 702 | 174.4 |
| D | 13 | 174 | 383773 | 2196.43 | 723 | 702 | 174.4 |
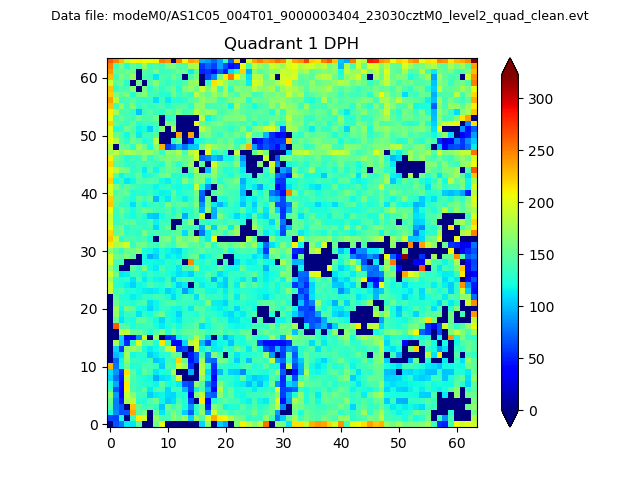
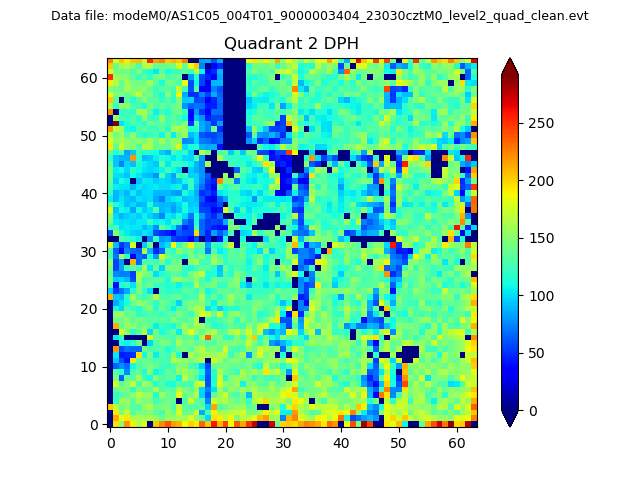
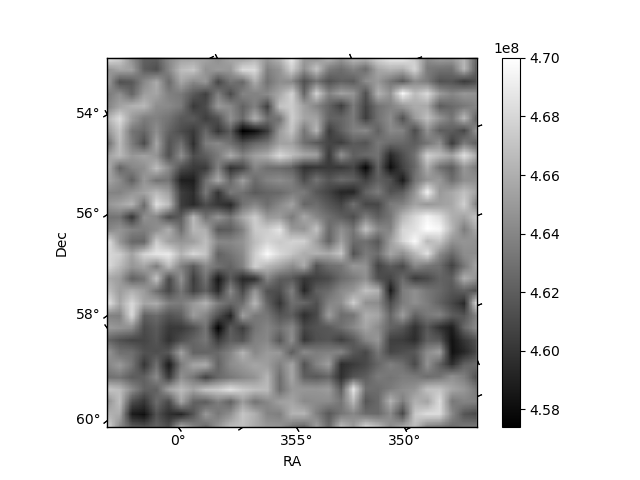
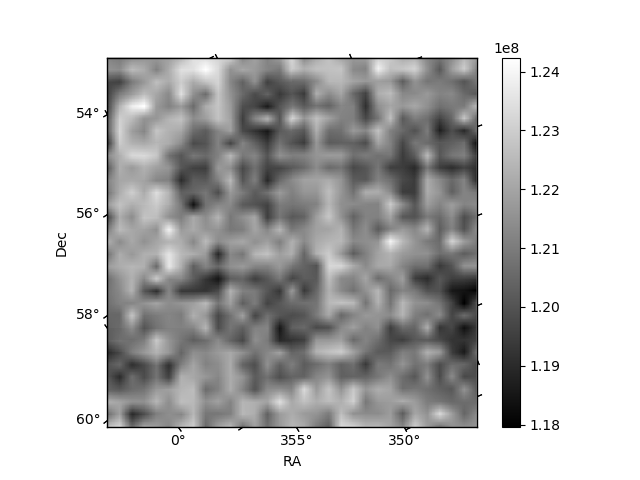
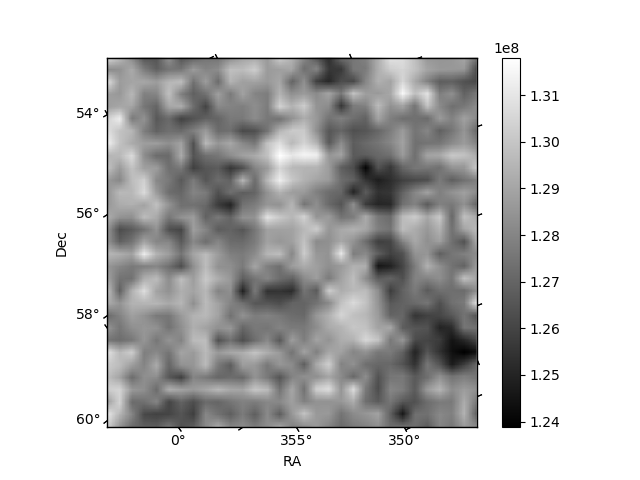
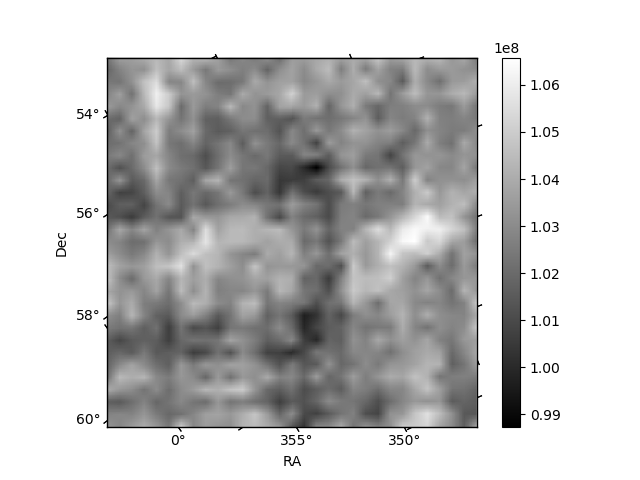
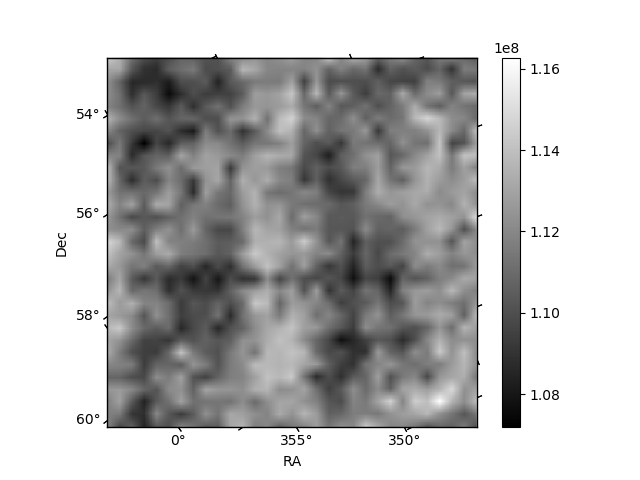
Histogram calculated using DETX and DETY for each event in the final _common_clean file
| Quadrant A | 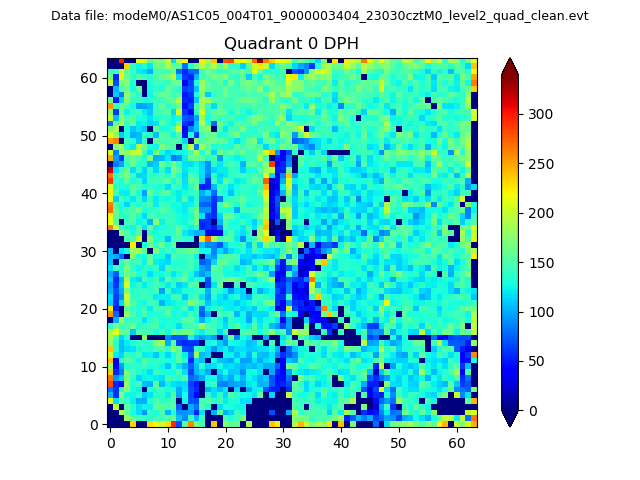 |
 |
Quadrant B |
|---|---|---|---|
| Quadrant D | 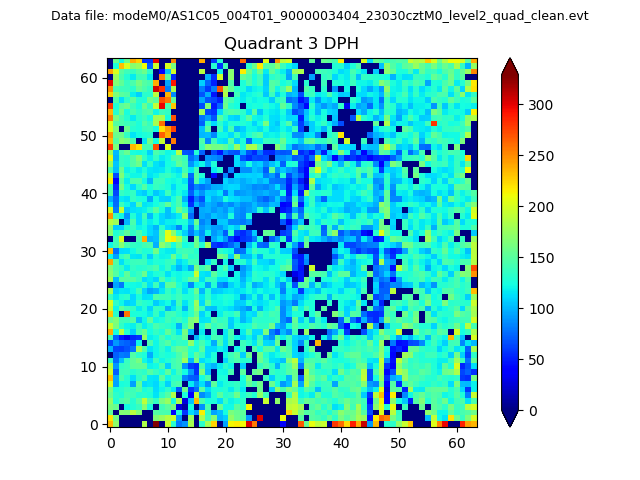 |
 |
Quadrant C |
| Plot type | Count rate plots | Images |
|---|---|---|
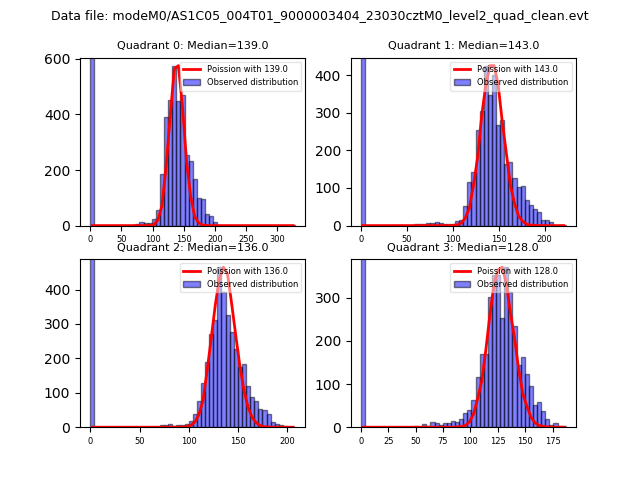
| Comparison with Poisson distribution Blue bars denote a histogram of data divided into 1 sec bins. Red curve is a Poisson curve with rate = median count rate of data. |
 |
 |
| Quadrant-wise count rates Data is divided into 100 sec bins |
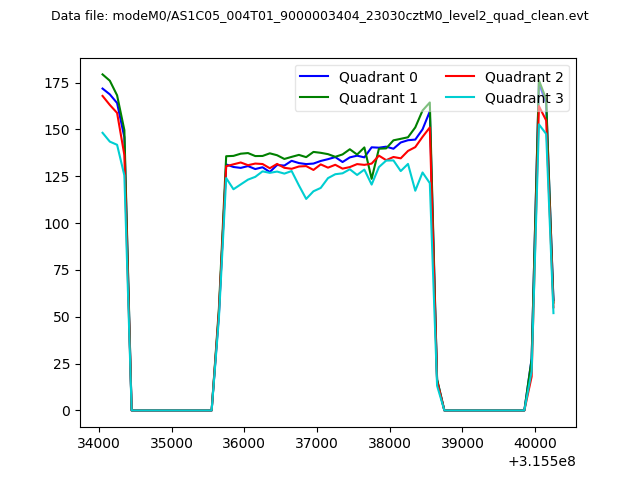 |
|
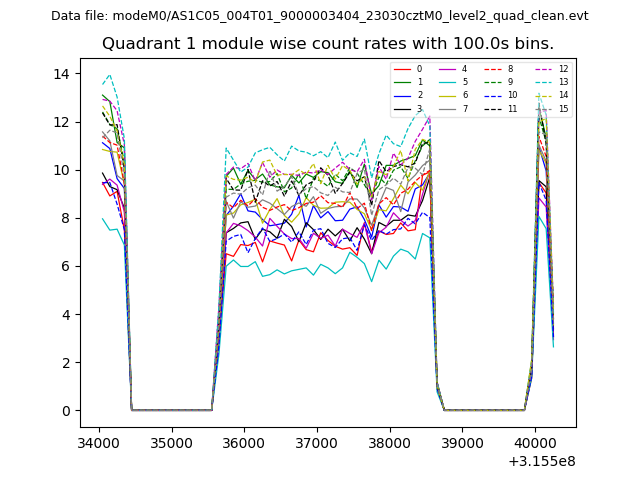
| Module-wise count rates for Quadrant A Data is divided into 100 sec bins |
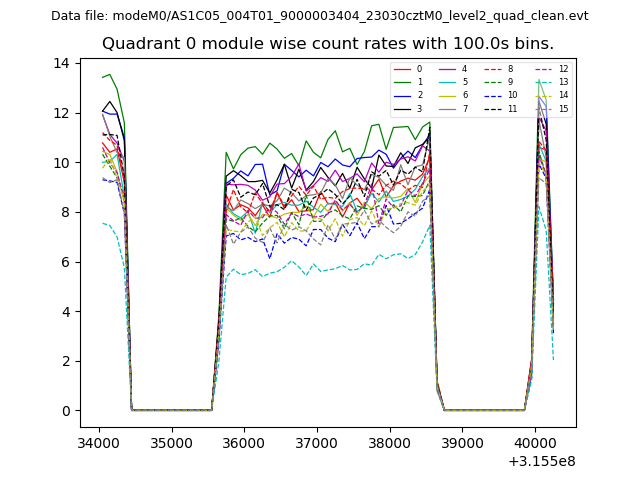 |
 |
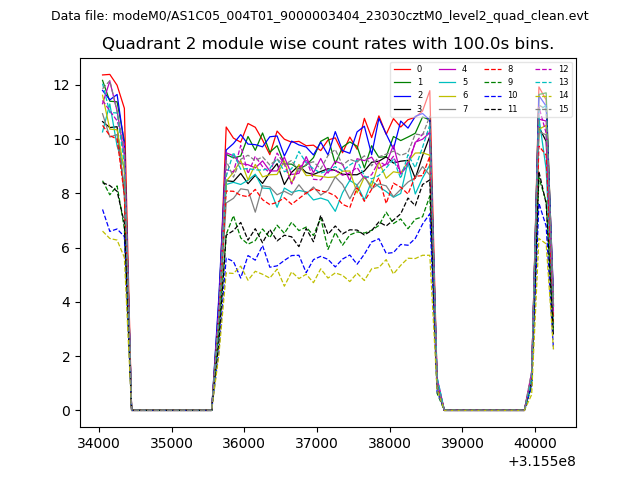
| Module-wise count rates for Quadrant B Data is divided into 100 sec bins |
 |
 |
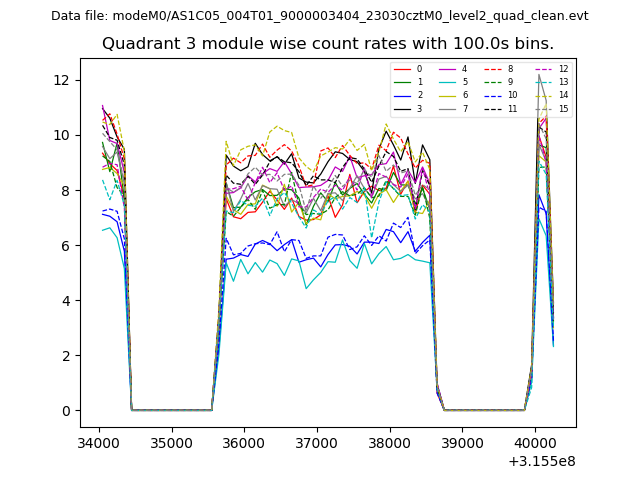
| Module-wise count rates for Quadrant C Data is divided into 100 sec bins |
 |
 |
| Module-wise count rates for Quadrant D Data is divided into 100 sec bins |
 |
 |
| Parameter | Plot |
|---|---|
| CZT HV Monitor | 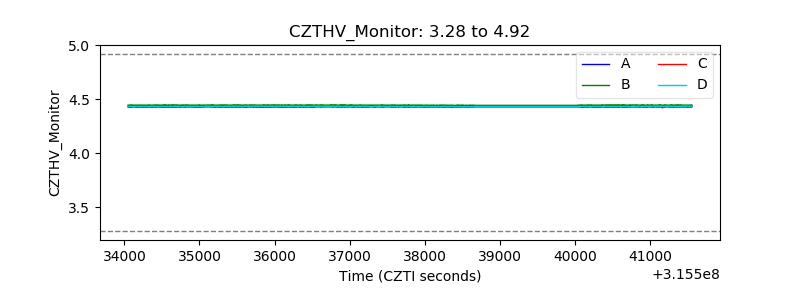 |
| D_VDD | 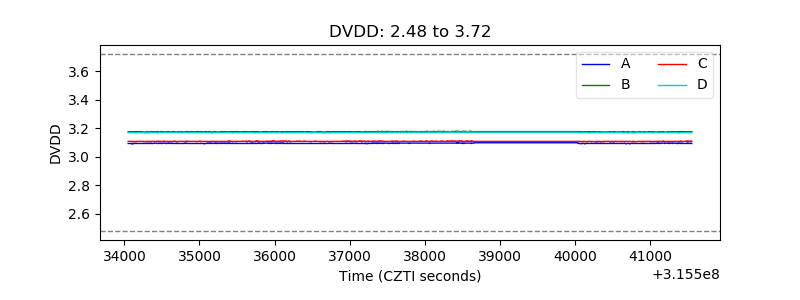 |
| Temperature 1 |  |
| Veto HV Monitor | 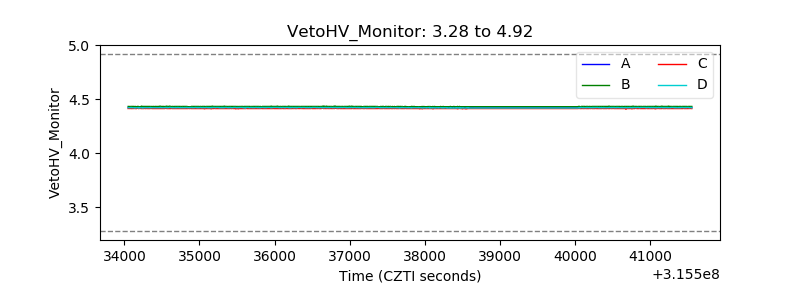 |
| Veto LLD | 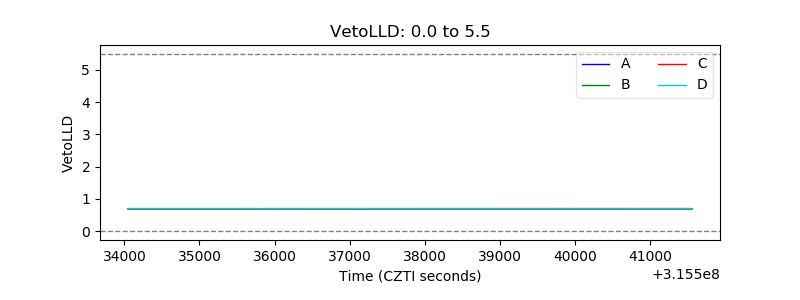 |
| Alpha Counter | 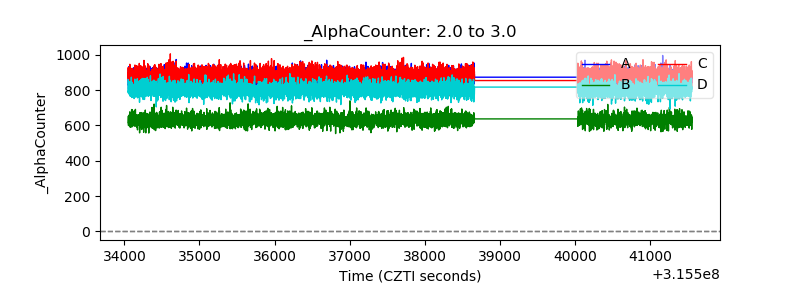 |
| _CPM_Rate | 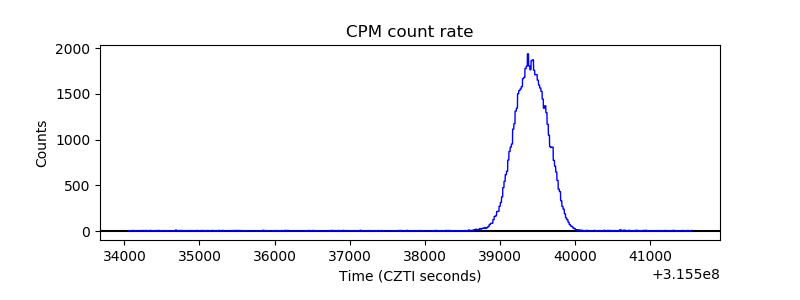 |
| CZT Counter | 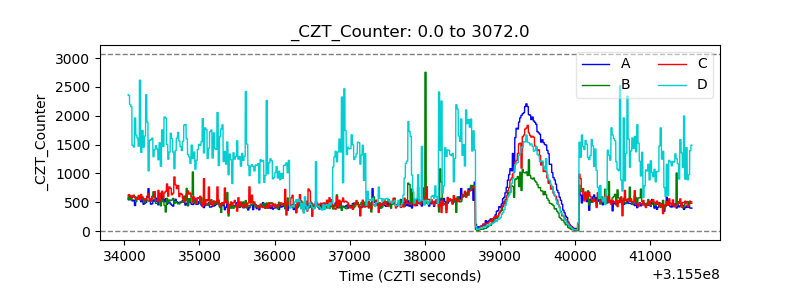 |
| +2.5 Volts monitor | 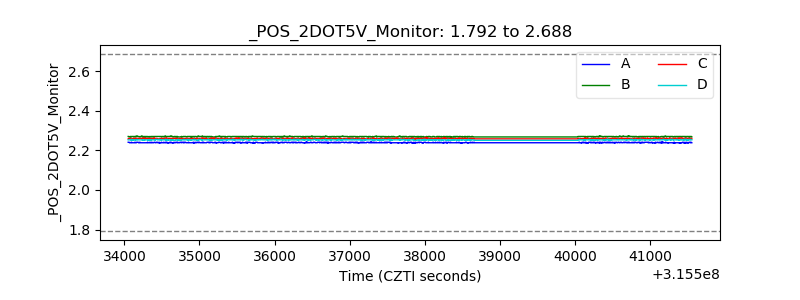 |
| +5 Volts monitor |  |
| _ROLL_ROT | 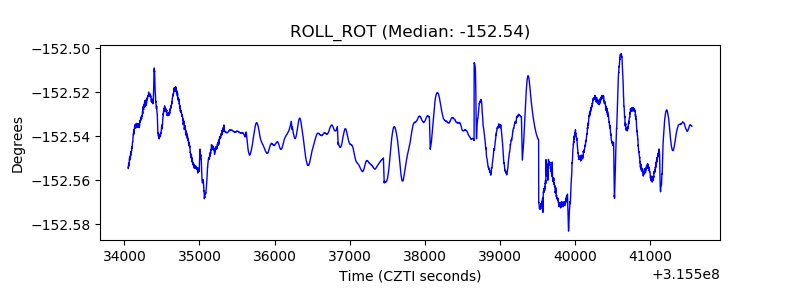 |
| _Roll_DEC | 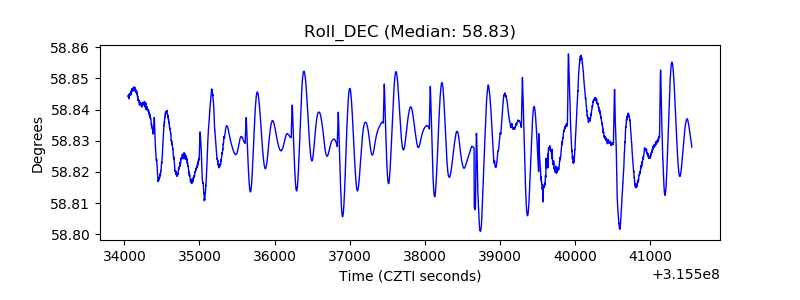 |
| _Roll_RA | 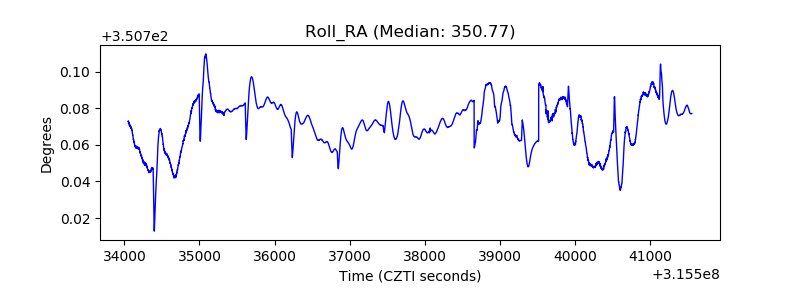 |
| Veto Counter | 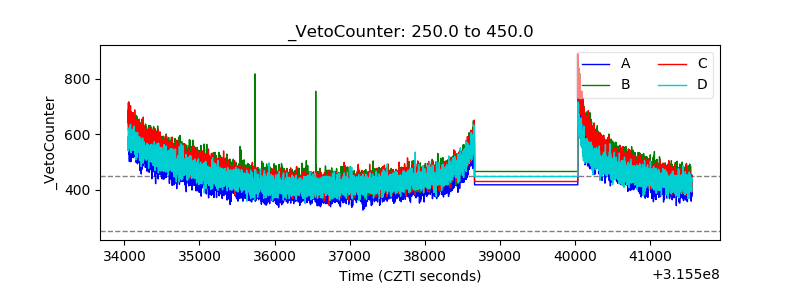 |