| Param | Original file | Final file |
|---|---|---|
| Filename | modeM0/AS1C05_004T01_9000003404_23031cztM0_level2.evt | modeM0/AS1C05_004T01_9000003404_23031cztM0_level2_quad_clean.evt |
| Size (bytes) | 296,645,760 | 44,893,440 |
| Size | 282.9 MB | 42.8 MB |
| Events in quadrant A | 1,580,749 | 284,331 |
| Events in quadrant B | 1,686,245 | 294,226 |
| Events in quadrant C | 1,641,018 | 279,932 |
| Events in quadrant D | 3,844,561 | 260,054 |
| Mode M0 | |||
|---|---|---|---|
| Quadrant | BADHDUFLAG | Total packets | Discarded packets |
| A | 0 | 8326 | 1406 |
| B | 0 | 8657 | 1459 |
| C | 0 | 8510 | 1457 |
| D | 0 | 16113 | 2293 |
| Mode SS | |||
|---|---|---|---|
| Quadrant | BADHDUFLAG | Total packets | Discarded packets |
| A | 0 | 82 | 16 |
| B | 0 | 83 | 17 |
| C | 0 | 81 | 15 |
| D | 0 | 84 | 18 |
| Mode M9 | |||
|---|---|---|---|
| Quadrant | BADHDUFLAG | Total packets | Discarded packets |
| A | 0 | 18 | 4 |
| B | 0 | 16 | 3 |
| C | 0 | 17 | 2 |
| D | 0 | 17 | 4 |
| Quadrant | Total seconds | Saturated seconds | Saturation percentage |
|---|---|---|---|
| A | 3396 | 5 | 0.147232% |
| B | 3403 | 24 | 0.705260% |
| C | 3405 | 34 | 0.998532% |
| D | 3388 | 125 | 3.689492% |
Noise dominated data is calculated using 1-second bins in cleaned event files. If a bin has >2000 counts, and if more than 50% of those come from <1% of pixels, then it is considered to be noise-dominated and hence unusable.
| Quadrant | # 1 sec bins | Bins with >0 counts | Bins with >2000 counts | High rate bins dominated by noise | Noise dominated (total time) | Noise dominated (detector-on time) | Marked lightcurve |
|---|---|---|---|---|---|---|---|
| A | 7785 | 3423 | 0 | 0 | 0.00% | 0.00% | 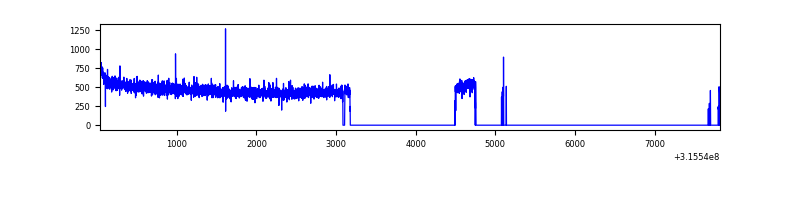 |
| B | 7784 | 3432 | 7 | 7 | 0.09% | 0.20% | 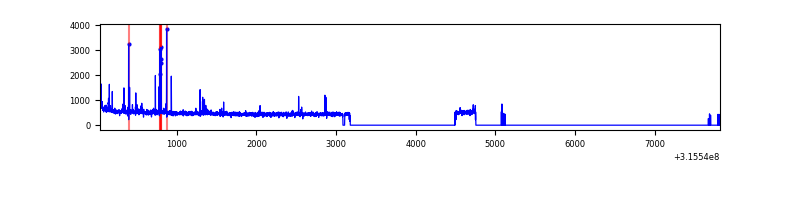 |
| C | 7786 | 3439 | 4 | 4 | 0.05% | 0.12% | 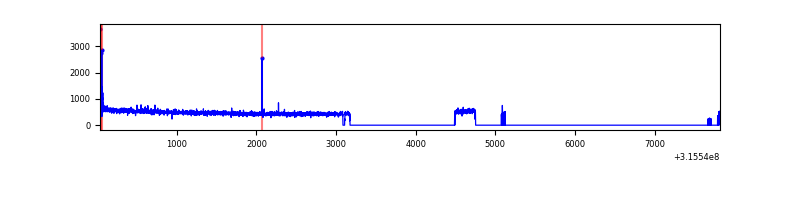 |
| D | 7786 | 3413 | 79 | 79 | 1.01% | 2.31% | 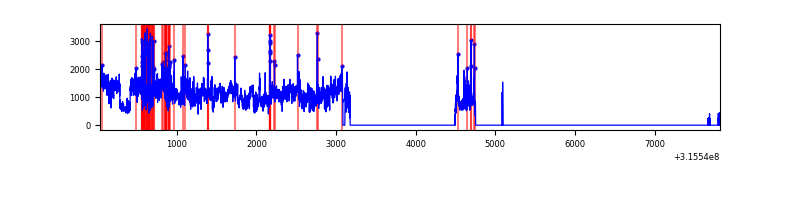 |
Top three noisy pixels from each quadrant. If the there are fewer than three noisy pixels in the level2.evt file, extra rows are filled as -1
| Pixel properties | Quadrant properties | ||||||
|---|---|---|---|---|---|---|---|
| Quadrant | DetID | PixID | Counts | Sigma | Mean | Median | Sigma |
| A | 13 | 254 | 5308 | 59.64 | 409 | 401 | 82.3 |
| A | 0 | 226 | 3601 | 38.9 | 409 | 401 | 82.3 |
| A | 3 | 137 | 3356 | 35.92 | 409 | 401 | 82.3 |
| B | 0 | 189 | 46277 | 585.43 | 410 | 400 | 78.4 |
| B | 3 | 64 | 24234 | 304.14 | 410 | 400 | 78.4 |
| B | 12 | 111 | 9302 | 113.6 | 410 | 400 | 78.4 |
| C | 14 | 238 | 65804 | 710.45 | 394 | 397 | 92.1 |
| C | 0 | 10 | 23675 | 252.85 | 394 | 397 | 92.1 |
| C | 0 | 207 | 13082 | 137.78 | 394 | 397 | 92.1 |
| D | 1 | 52 | 2020687 | 21225.23 | 387 | 375 | 95.2 |
| D | 5 | 222 | 178546 | 1871.85 | 387 | 375 | 95.2 |
| D | 2 | 152 | 123638 | 1294.99 | 387 | 375 | 95.2 |
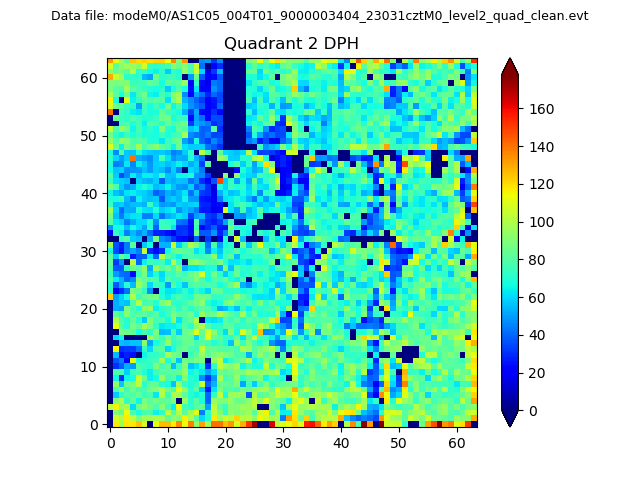
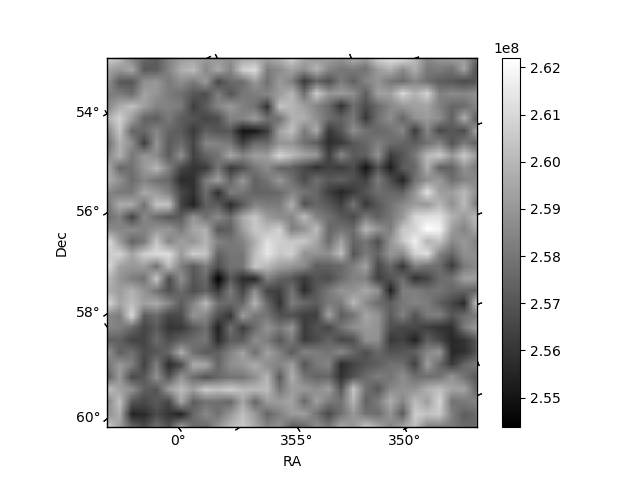
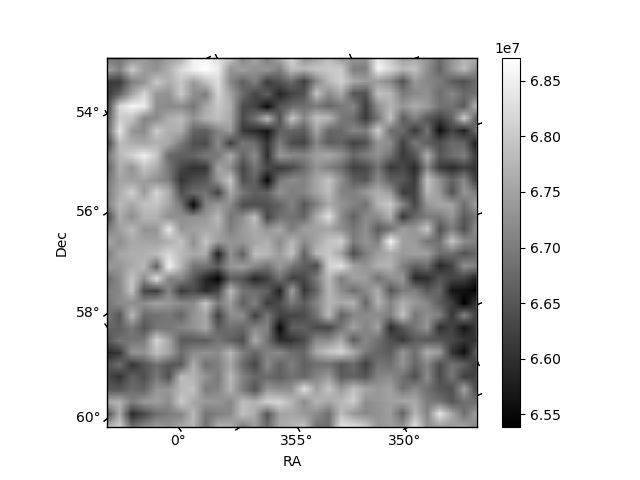
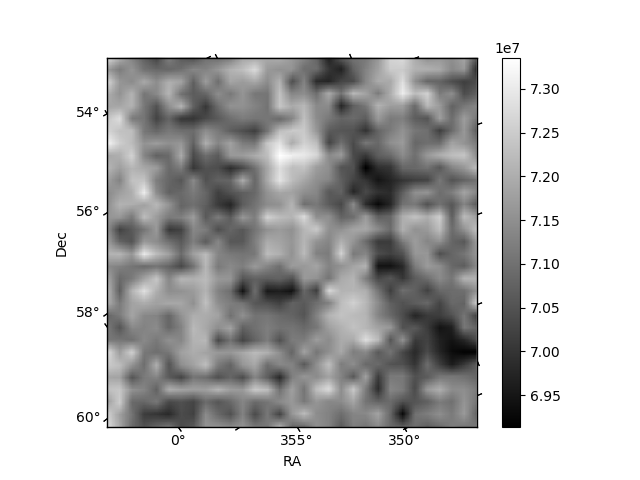
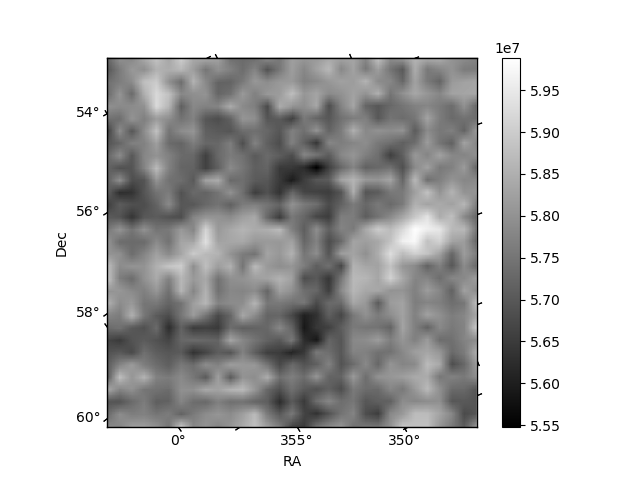
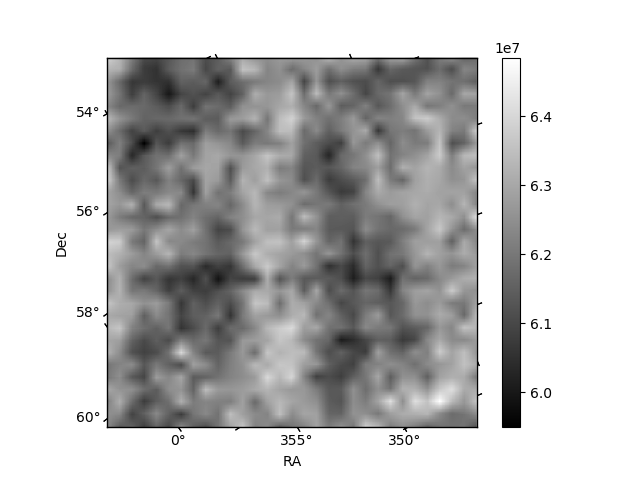
Histogram calculated using DETX and DETY for each event in the final _common_clean file
| Quadrant A | 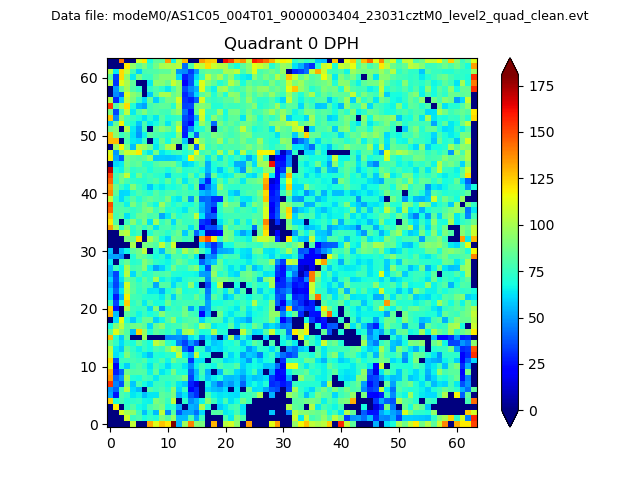 |
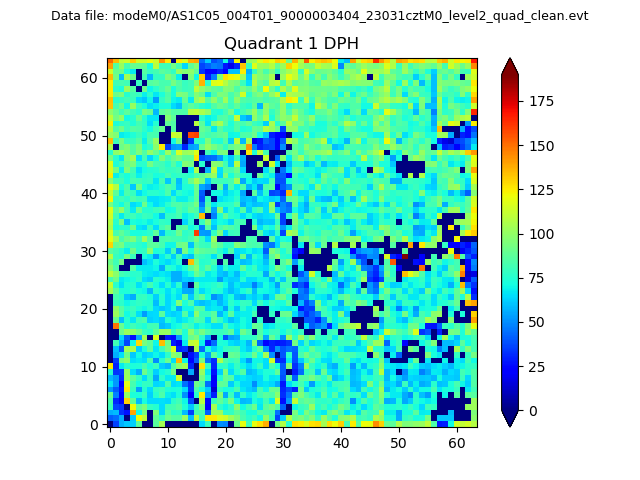 |
Quadrant B |
|---|---|---|---|
| Quadrant D | 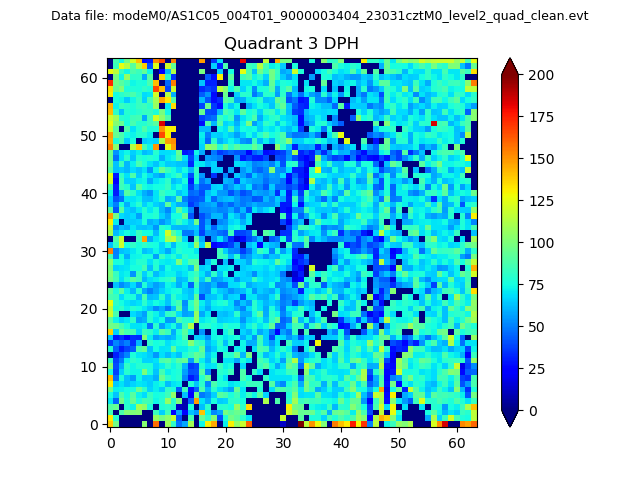 |
 |
Quadrant C |
| Plot type | Count rate plots | Images |
|---|---|---|
| Comparison with Poisson distribution Blue bars denote a histogram of data divided into 1 sec bins. Red curve is a Poisson curve with rate = median count rate of data. |
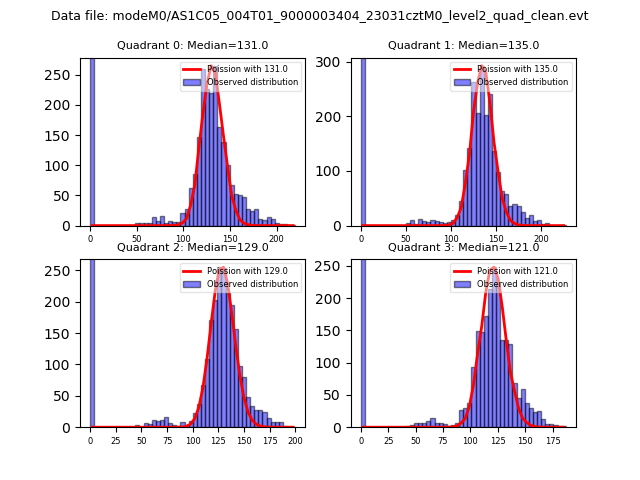 |
 |
| Quadrant-wise count rates Data is divided into 100 sec bins |
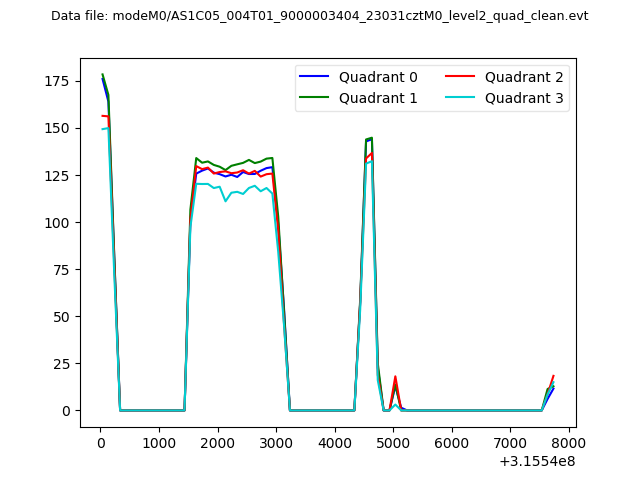 |
|
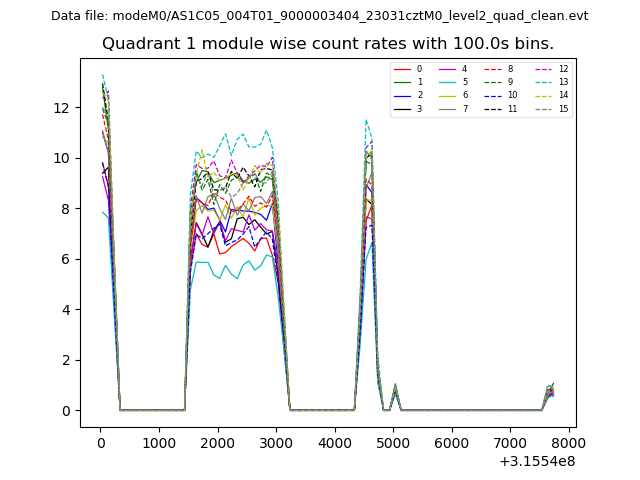
| Module-wise count rates for Quadrant A Data is divided into 100 sec bins |
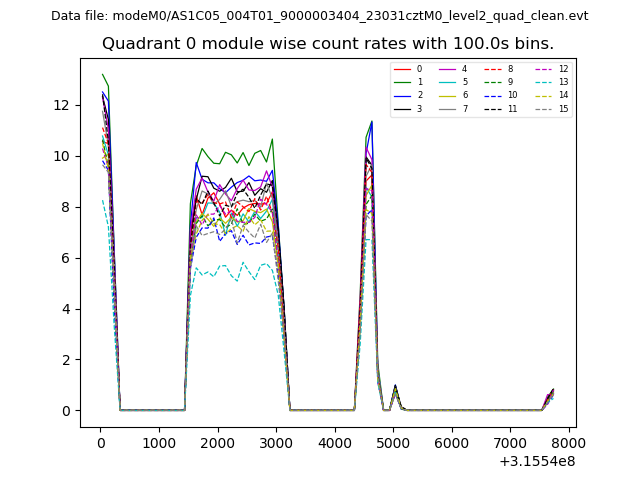 |
 |
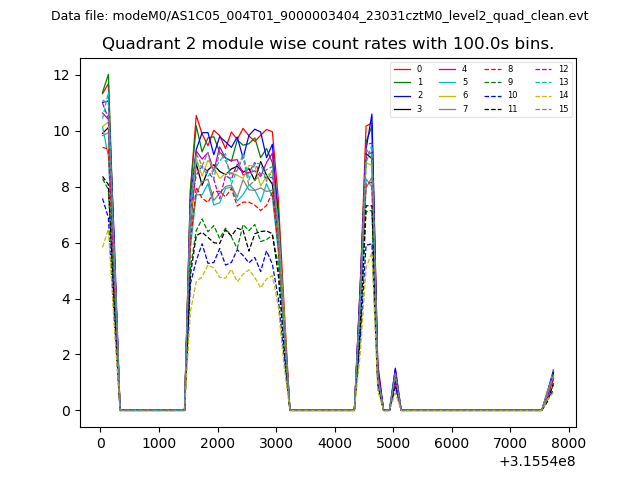
| Module-wise count rates for Quadrant B Data is divided into 100 sec bins |
 |
 |
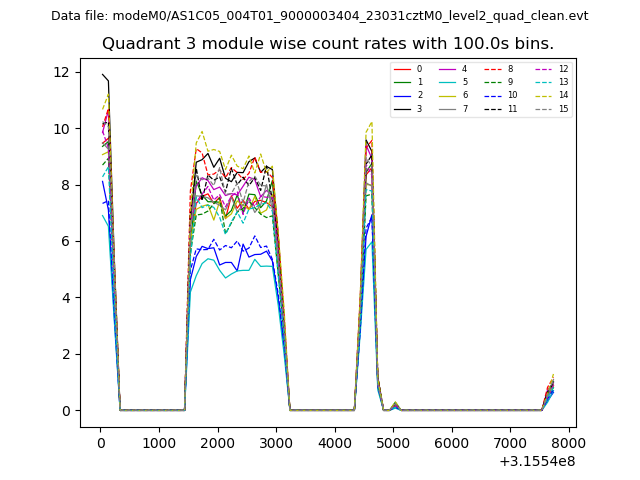
| Module-wise count rates for Quadrant C Data is divided into 100 sec bins |
 |
 |
| Module-wise count rates for Quadrant D Data is divided into 100 sec bins |
 |
 |
| Parameter | Plot |
|---|---|
| CZT HV Monitor | 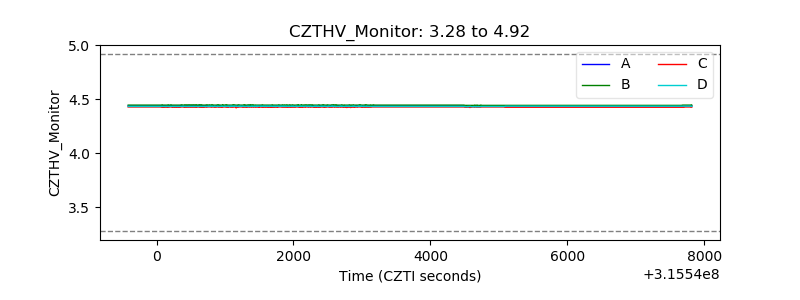 |
| D_VDD | 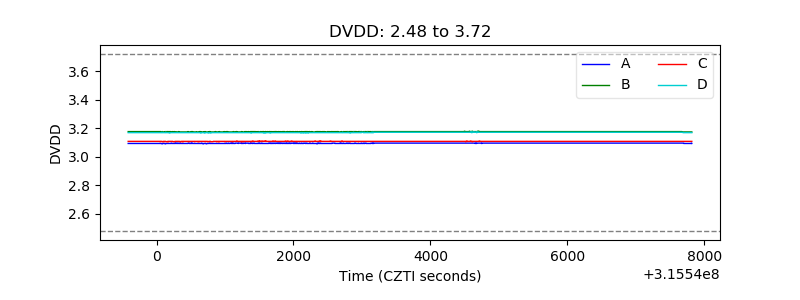 |
| Temperature 1 | 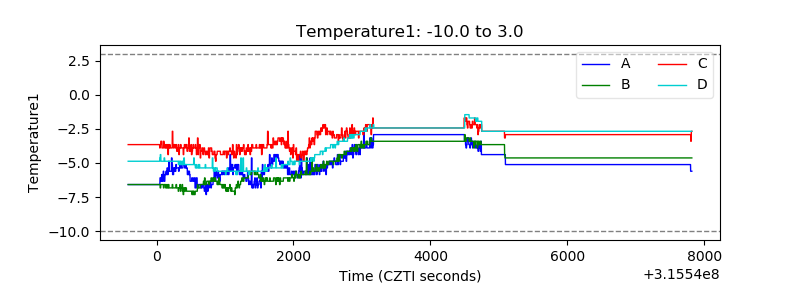 |
| Veto HV Monitor | 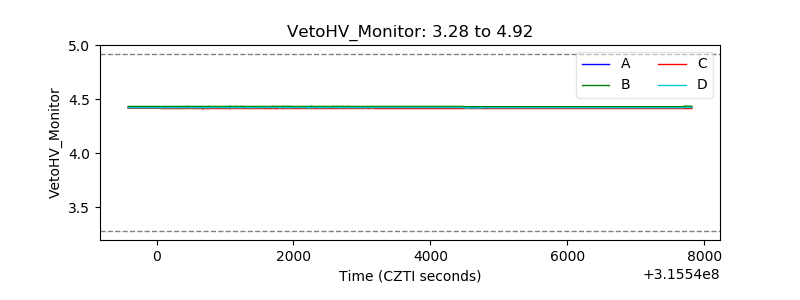 |
| Veto LLD | 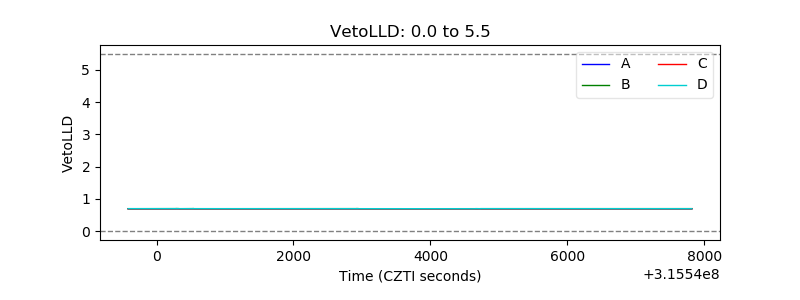 |
| Alpha Counter | 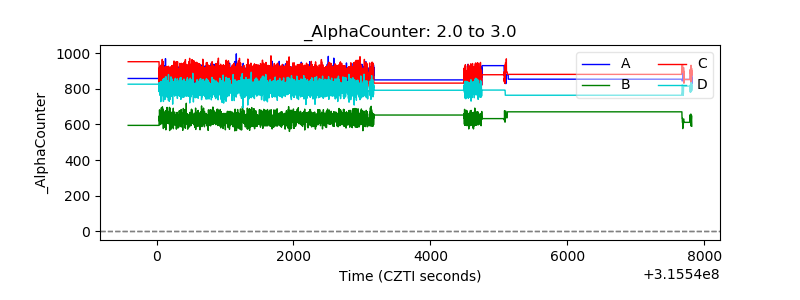 |
| _CPM_Rate | 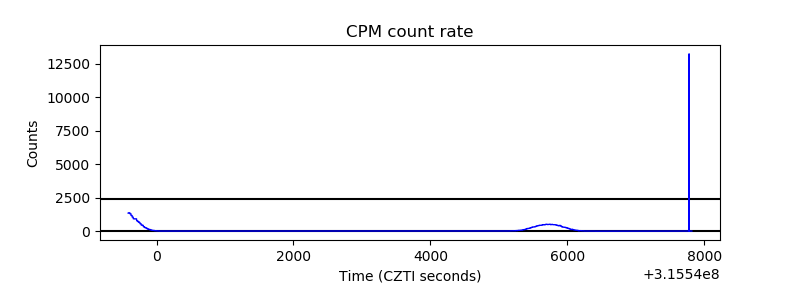 |
| CZT Counter | 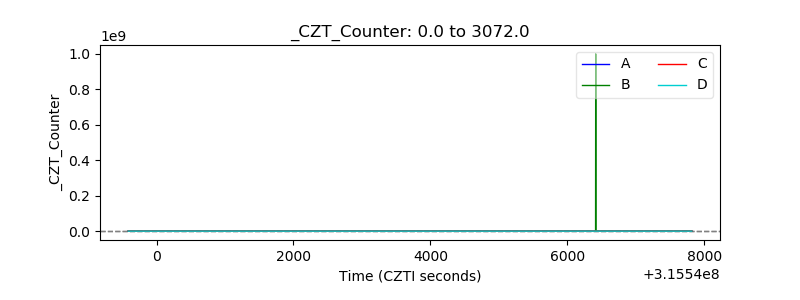 |
| +2.5 Volts monitor |  |
| +5 Volts monitor | 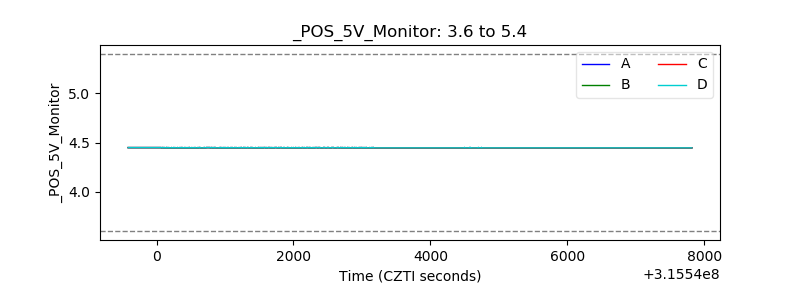 |
| _ROLL_ROT | 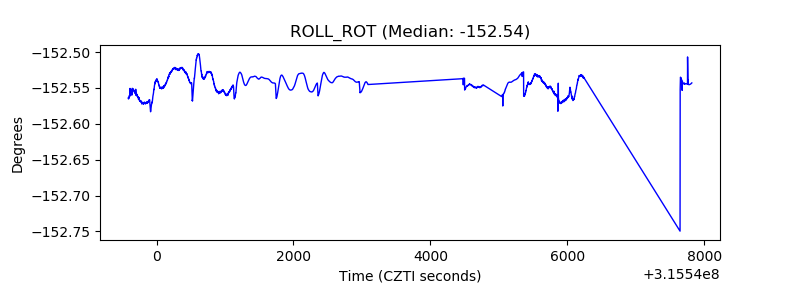 |
| _Roll_DEC | 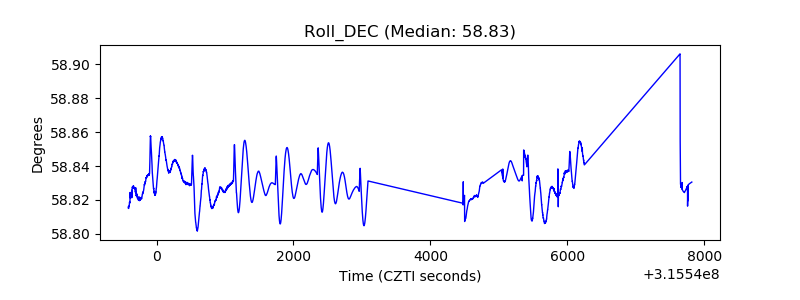 |
| _Roll_RA | 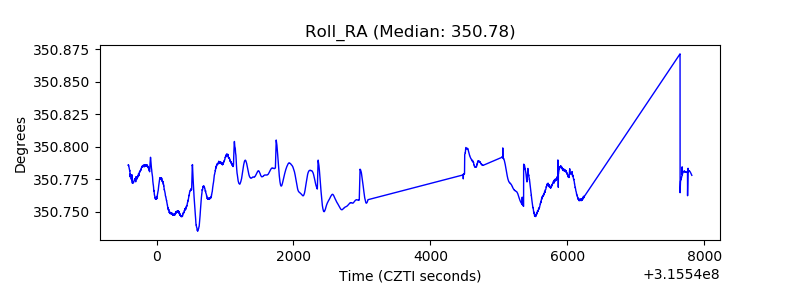 |
| Veto Counter | 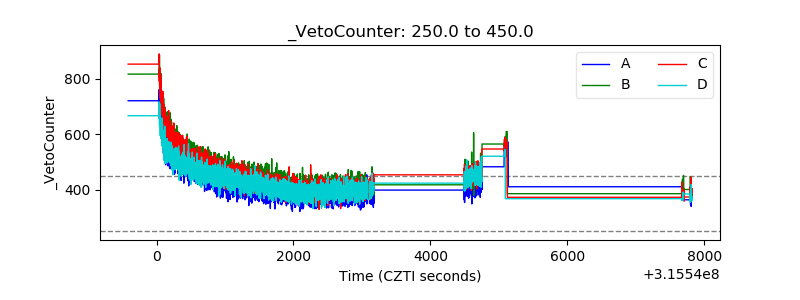 |