| Param | Original file | Final file |
|---|---|---|
| Filename | modeM0/AS1C05_004T01_9000003404_23032cztM0_level2.evt | modeM0/AS1C05_004T01_9000003404_23032cztM0_level2_quad_clean.evt |
| Size (bytes) | 405,457,920 | 79,974,720 |
| Size | 386.7 MB | 76.3 MB |
| Events in quadrant A | 2,441,430 | 525,691 |
| Events in quadrant B | 2,662,036 | 531,182 |
| Events in quadrant C | 2,506,938 | 512,851 |
| Events in quadrant D | 4,308,150 | 480,564 |
| Mode M0 | |||
|---|---|---|---|
| Quadrant | BADHDUFLAG | Total packets | Discarded packets |
| A | 0 | 12194 | 1383 |
| B | 0 | 12922 | 1632 |
| C | 0 | 12335 | 1426 |
| D | 0 | 18228 | 1616 |
| Mode SS | |||
|---|---|---|---|
| Quadrant | BADHDUFLAG | Total packets | Discarded packets |
| A | 0 | 122 | 14 |
| B | 0 | 122 | 14 |
| C | 0 | 119 | 11 |
| D | 0 | 119 | 11 |
| Mode M9 | |||
|---|---|---|---|
| Quadrant | BADHDUFLAG | Total packets | Discarded packets |
| A | 0 | 8 | 0 |
| B | 0 | 9 | 1 |
| C | 0 | 9 | 1 |
| D | 0 | 8 | 0 |
| Quadrant | Total seconds | Saturated seconds | Saturation percentage |
|---|---|---|---|
| A | 5311 | 51 | 0.960271% |
| B | 5275 | 91 | 1.725118% |
| C | 5310 | 90 | 1.694915% |
| D | 5293 | 402 | 7.594937% |
Noise dominated data is calculated using 1-second bins in cleaned event files. If a bin has >2000 counts, and if more than 50% of those come from <1% of pixels, then it is considered to be noise-dominated and hence unusable.
| Quadrant | # 1 sec bins | Bins with >0 counts | Bins with >2000 counts | High rate bins dominated by noise | Noise dominated (total time) | Noise dominated (detector-on time) | Marked lightcurve |
|---|---|---|---|---|---|---|---|
| A | 6980 | 5465 | 0 | 0 | 0.00% | 0.00% | 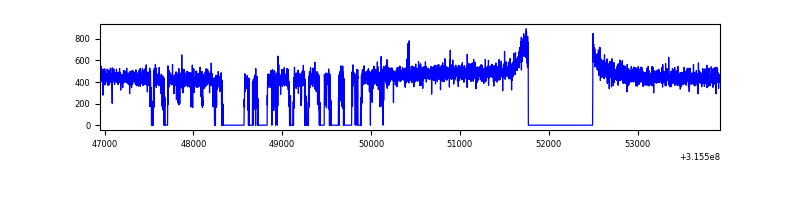 |
| B | 6980 | 5422 | 13 | 13 | 0.19% | 0.24% |  |
| C | 6980 | 5444 | 1 | 1 | 0.01% | 0.02% | 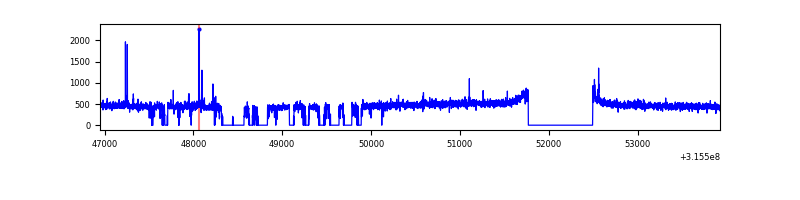 |
| D | 6980 | 5448 | 292 | 292 | 4.18% | 5.36% | 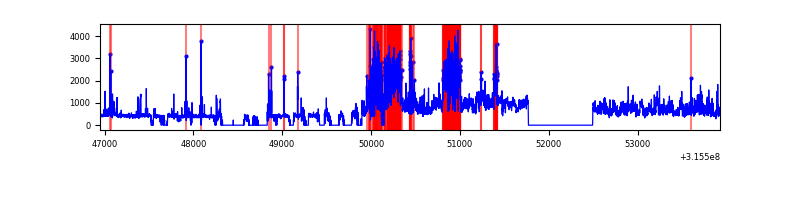 |
Top three noisy pixels from each quadrant. If the there are fewer than three noisy pixels in the level2.evt file, extra rows are filled as -1
| Pixel properties | Quadrant properties | ||||||
|---|---|---|---|---|---|---|---|
| Quadrant | DetID | PixID | Counts | Sigma | Mean | Median | Sigma |
| A | 13 | 254 | 7451 | 53.25 | 631 | 619 | 128.3 |
| A | 2 | 79 | 6652 | 47.02 | 631 | 619 | 128.3 |
| A | 3 | 137 | 5807 | 40.44 | 631 | 619 | 128.3 |
| B | 3 | 64 | 115578 | 967.33 | 625 | 608 | 118.9 |
| B | 0 | 189 | 57757 | 480.84 | 625 | 608 | 118.9 |
| B | 4 | 216 | 28998 | 238.87 | 625 | 608 | 118.9 |
| C | 14 | 238 | 96422 | 672.18 | 608 | 611 | 142.5 |
| C | 0 | 207 | 18956 | 128.7 | 608 | 611 | 142.5 |
| C | 0 | 10 | 11837 | 78.76 | 608 | 611 | 142.5 |
| D | 1 | 52 | 782367 | 5390.06 | 597 | 579 | 145.0 |
| D | 5 | 222 | 727596 | 5012.44 | 597 | 579 | 145.0 |
| D | 2 | 152 | 221916 | 1526.01 | 597 | 579 | 145.0 |
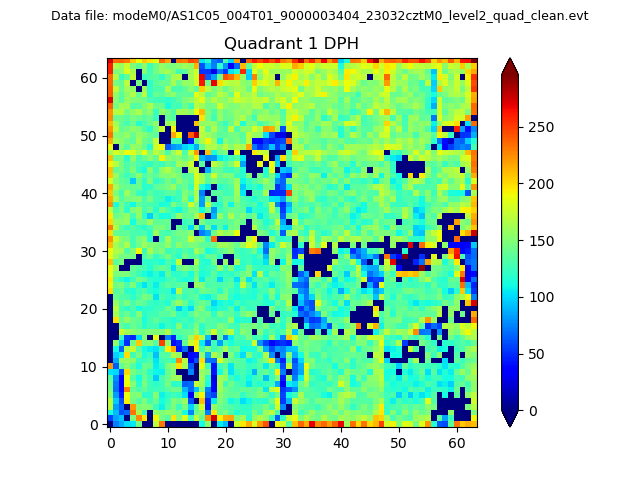
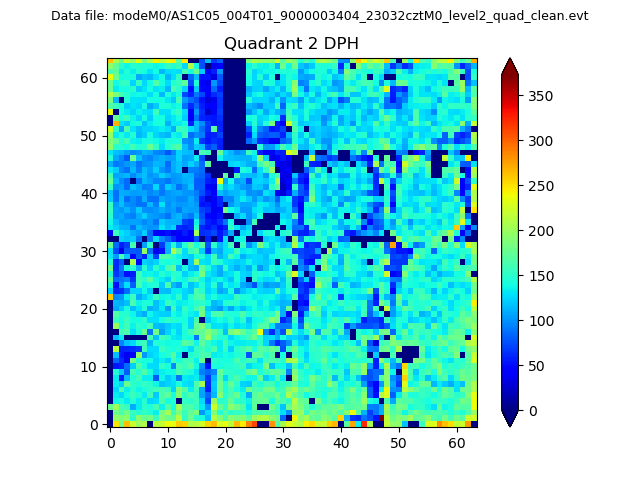
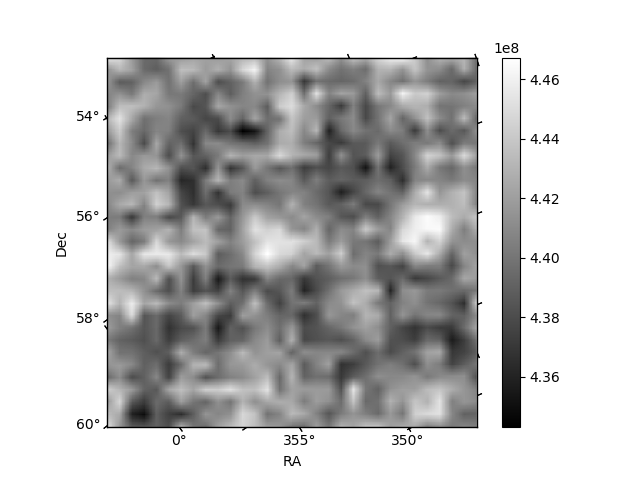
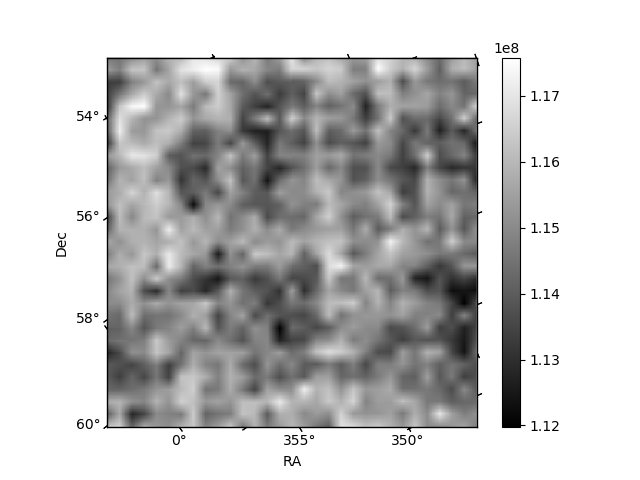
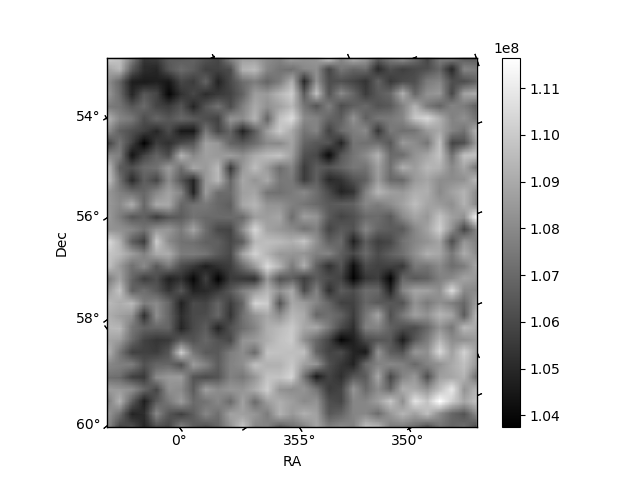
Histogram calculated using DETX and DETY for each event in the final _common_clean file
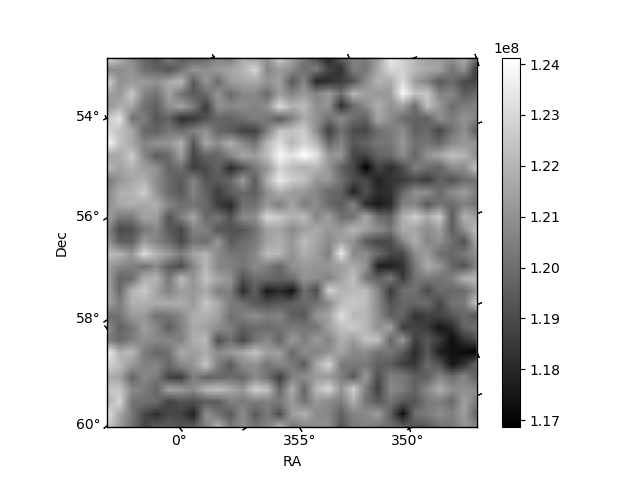
| Quadrant A | 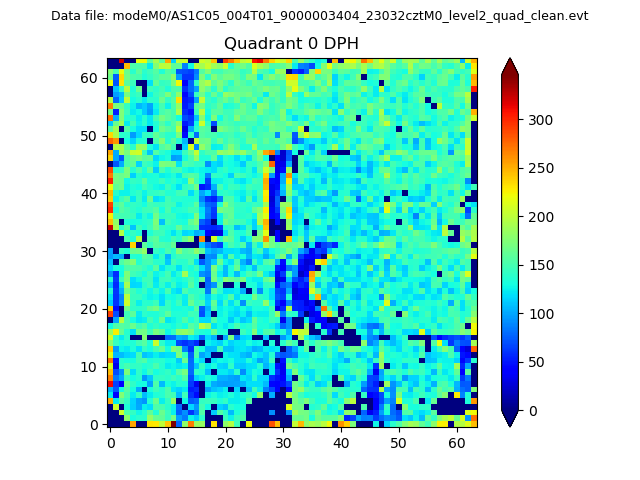 |
 |
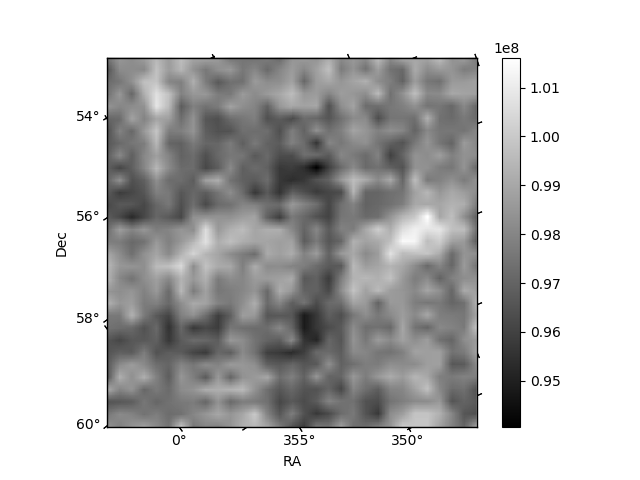
Quadrant B |
|---|---|---|---|
| Quadrant D | 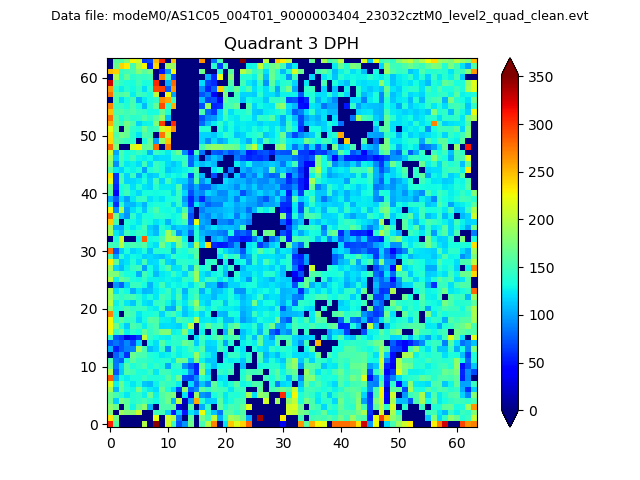 |
 |
Quadrant C |
| Plot type | Count rate plots | Images |
|---|---|---|
| Comparison with Poisson distribution Blue bars denote a histogram of data divided into 1 sec bins. Red curve is a Poisson curve with rate = median count rate of data. |
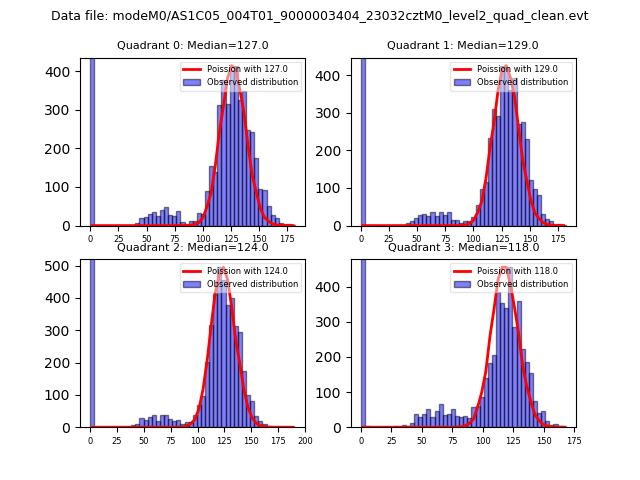 |
 |
| Quadrant-wise count rates Data is divided into 100 sec bins |
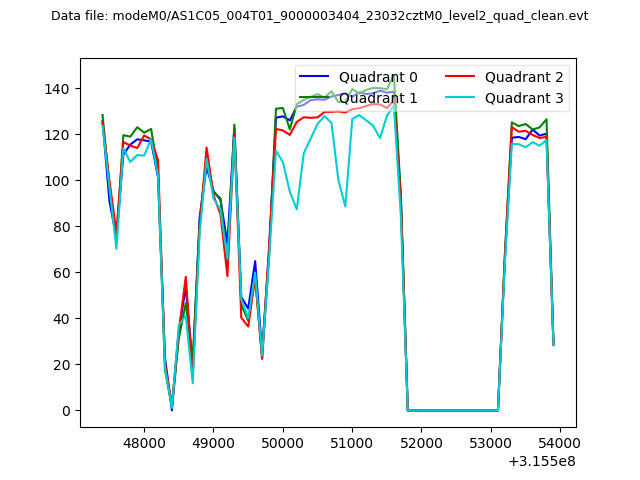 |
|
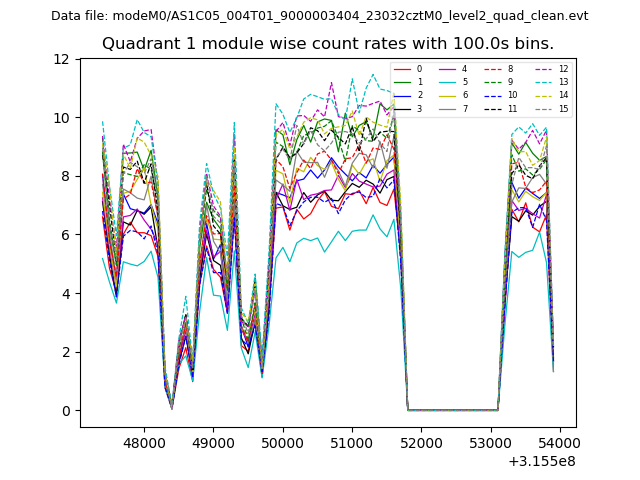
| Module-wise count rates for Quadrant A Data is divided into 100 sec bins |
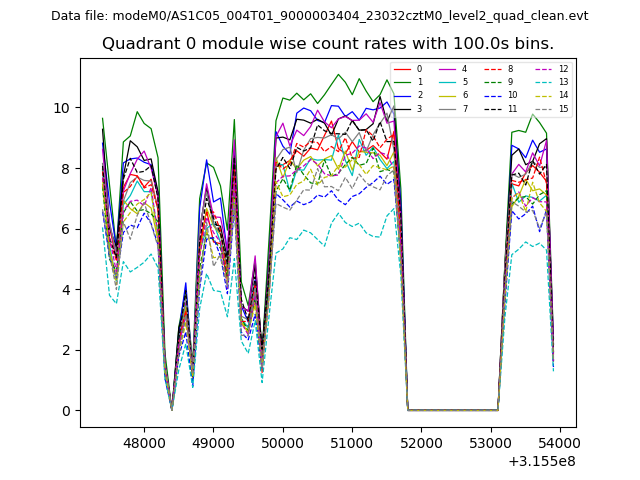 |
 |
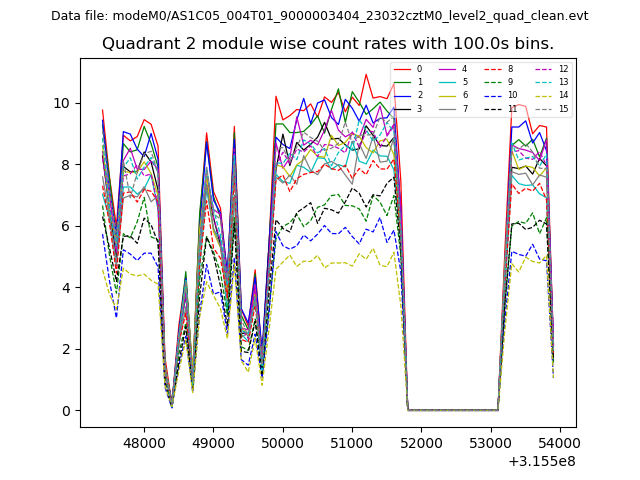
| Module-wise count rates for Quadrant B Data is divided into 100 sec bins |
 |
 |
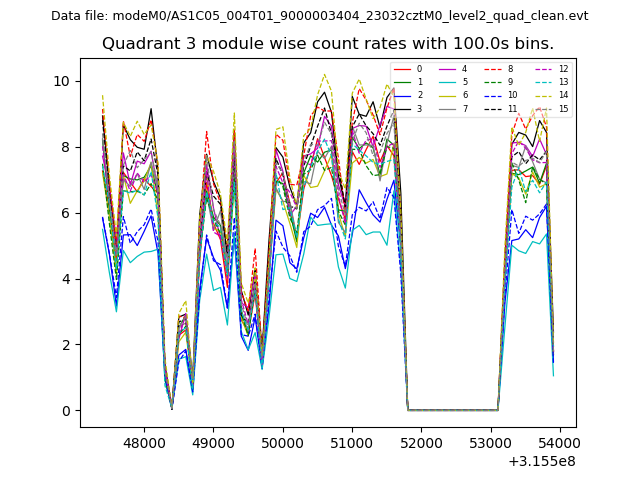
| Module-wise count rates for Quadrant C Data is divided into 100 sec bins |
 |
 |
| Module-wise count rates for Quadrant D Data is divided into 100 sec bins |
 |
 |
| Parameter | Plot |
|---|---|
| CZT HV Monitor | 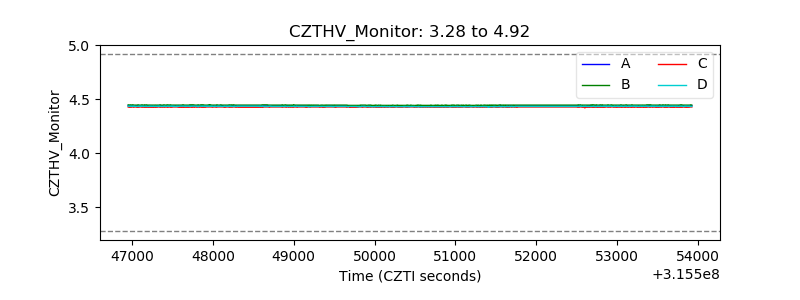 |
| D_VDD | 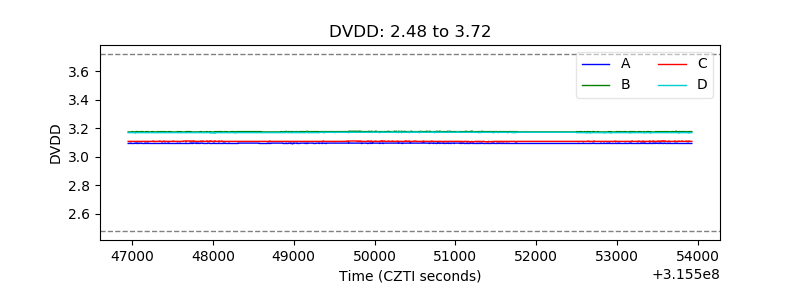 |
| Temperature 1 | 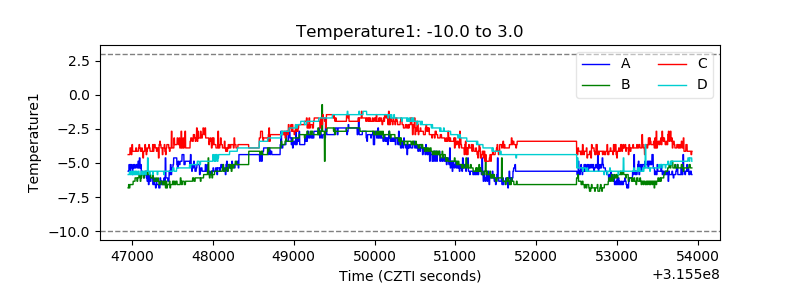 |
| Veto HV Monitor | 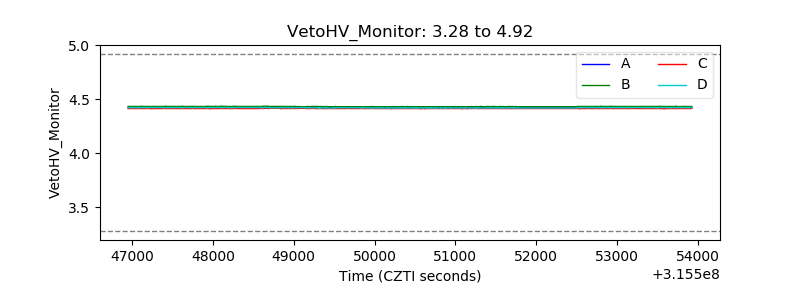 |
| Veto LLD | 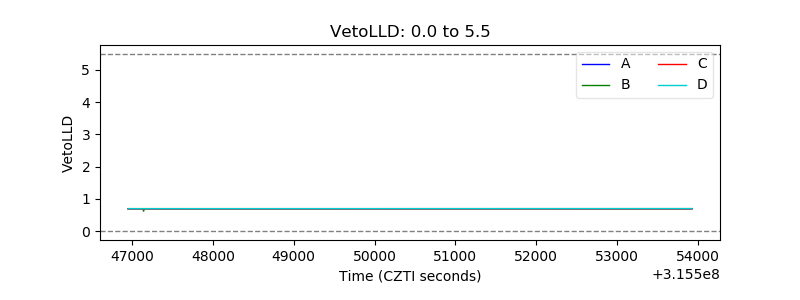 |
| Alpha Counter | 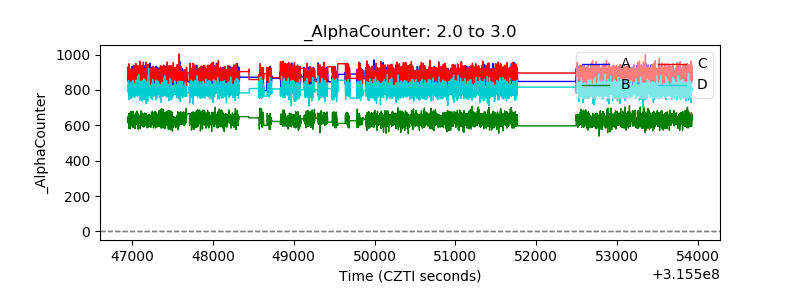 |
| _CPM_Rate | 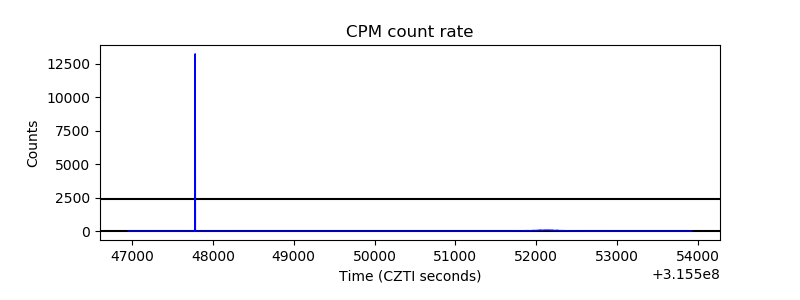 |
| CZT Counter | 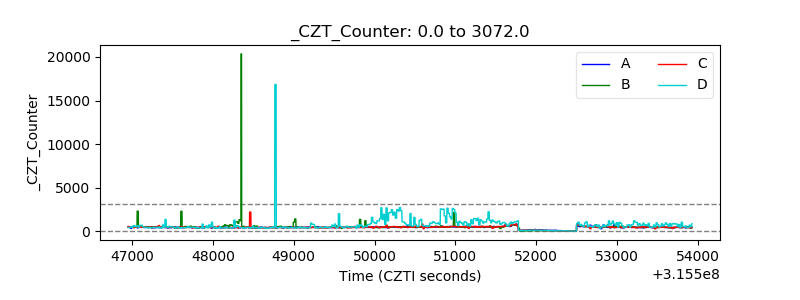 |
| +2.5 Volts monitor |  |
| +5 Volts monitor | 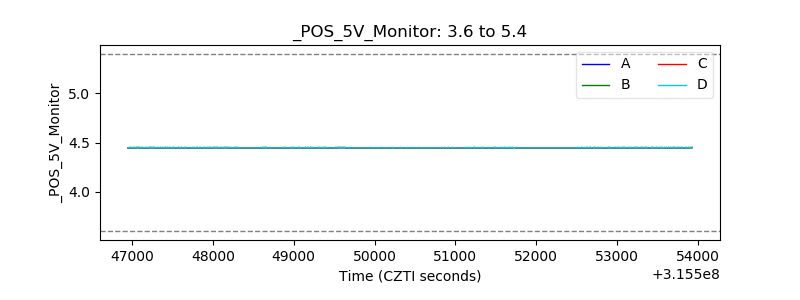 |
| _ROLL_ROT | 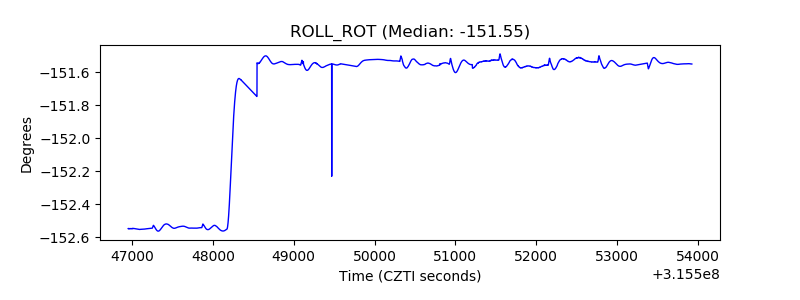 |
| _Roll_DEC | 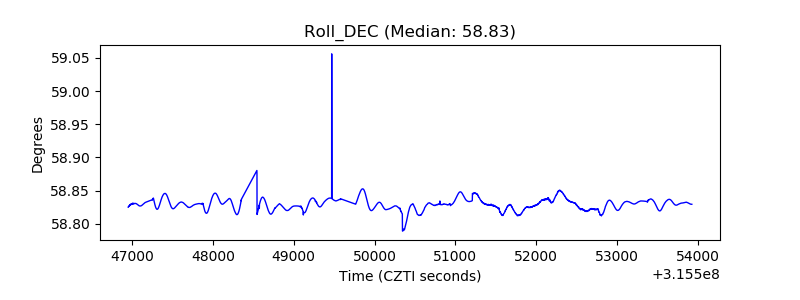 |
| _Roll_RA | 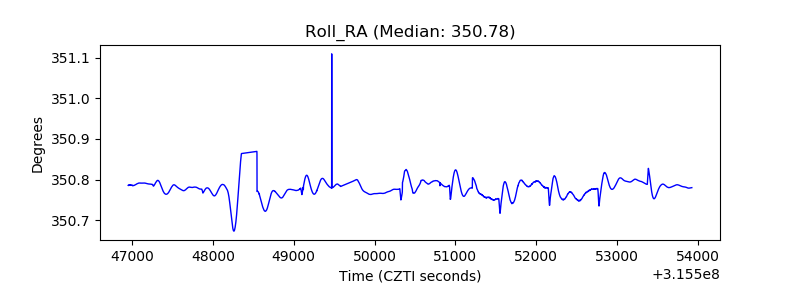 |
| Veto Counter | 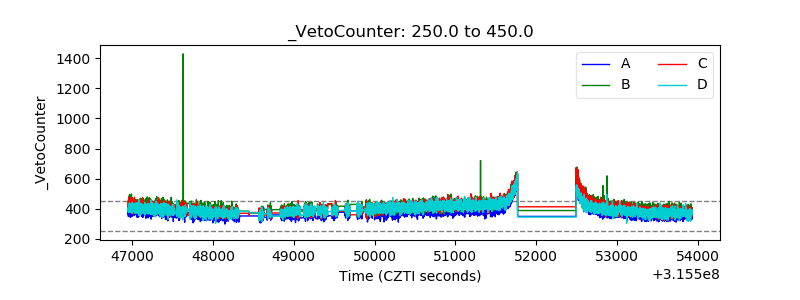 |